Ir Release (2)
•
0 gefällt mir•190 views

HCL Technologies reported its annual and fourth quarter results for fiscal year 2008-2009: - Annual revenues were $2.18 billion, up 17.1% year-over-year. Net income was $264 million, down 5.6% year-over-year. - Fourth quarter revenues were $607 million, up 21% year-over-year and 7.6% sequentially. Net income was $69 million, up 110.3% year-over-year and 60.2% sequentially. - Key growth areas included infrastructure services, enterprise application services, and the media, financial services, manufacturing and life sciences industries. - The company saw increased customer satisfaction scores and

Empfohlen
Empfohlen
Weitere ähnliche Inhalte
Andere mochten auch
Andere mochten auch (20)
Ähnlich wie Ir Release (2)
Ähnlich wie Ir Release (2) (20)
Mehr von Semalytix
Mehr von Semalytix (20)
Ir Release (2)
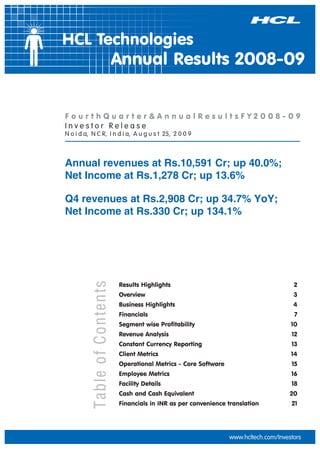
- 1. HCL Technologies Annual Results 2008-09 FourthQuarter&AnnualResultsFY2008-09 Investor Release N o i d a, N C R, I n d i a, A u g u s t 25, 2 0 0 9 Annual revenues at Rs.10,591 Cr; up 40.0%; Net Income at Rs.1,278 Cr; up 13.6% Q4 revenues at Rs.2,908 Cr; up 34.7% YoY; Net Income at Rs.330 Cr; up 134.1% Results Highlights 2 Overview 3 Business Highlights 4 Financials 7 Segment wise Profitability 10 Revenue Analysis 12 Constant Currency Reporting 13 Client Metrics 14 Operational Metrics - Core Software 15 Employee Metrics 16 Facility Details 18 Cash and Cash Equivalent 20 Financials in INR as per convenience translation 21 www.hcltech.com/Investors
- 2. Results Highlights Highlights for the Year (INR) : FY 2008-09 ? Rs.10,591 crore; up 40.0% YoY Revenue at EBIT at Rs.1857 crore, up 40.9% YoY ? ? at Rs.1278 crore, up 13.6% YoY Net Income Gross addition at 15,233 (Net addition 3,475) taking headcount to 54,216 ? Highlights for the Quarter (INR) ?at Rs. 2908 crore; up 34.7% YoY and 1.6% sequentially Revenue ? 524 crore, up 26.8% YoY and 11.9% sequentially EBIT at Rs. ? at Rs.330 crore, up 134.1% YoY and 51.3% sequentially Net Income Final dividend of Re. 1 per share taking total Dividend for FY 08-09 to Rs. 7 per share; 26th ? consecutive quarter of dividend payout Gross addition at 3,391 (Net addition 190) taking headcount to 54,216 ? Highlights for the Year (US$) : FY 2008-09 ?at US$ 2180 mn; up 17.1% YoY Revenue ? 383 mn, up 18.3% YoY EBIT at US$ ? at US$ 264 mn, down 5.6% YoY Net Income Highlights for the Quarter (US$) ?at US$ 607 mn; up 21.0% YoY and up 7.6% sequentially Revenue ?on constant currency basis, up 28.6% YoY and up 3.9% sequentially Revenue ? 109 mn, up 13.9% YoY and up 18.4% sequentially EBIT at US$ ? at US$ 69 mn, up 110.3% YoY and up 60.2% sequentially Net Income 2 www.hcltech.com/Investors
- 3. Overview HCL has converted the challenges in today’s market environment into an opportunity for itself. It continues to build momentum focusing on growth through creating customer value and demonstrating leadership in executing multi-service deals. HCL is well positioned as a ‘Thought Leader’ by gauging and anticipating inflection points early in the industry and changing the paradigm in a rapidly dynamic IT environment. “HCL laid a strong foundation with its transformation journey in 2005 and has today emerged as a unique and trusted partner for its stakeholders. Our ability to anticipate change ahead of time and adapt to the changing market dynamics has stood us ahead of the curve. HCL’s three fold revenue growth over the last four years is a result of our relentless support, commitment and collaboration with our clients to achieve common business goals. With our robust financial position, we are well positioned for growth through these difficult times”, said Shiv Nadar, Chairman and Chief Strategy Officer, HCL Technologies. Commenting on the results, Vineet Nayar, CEO, HCL Technologies says, “The past year has been remarkable for us . We have posted industry leading growth while expanding margins at the same time. In these times when our customers are facing unprecedented business challenges, all HCLites stood by them and increased satisfaction by 43% by focusing on value and not revenues. We accelerated our investments in growth in enterprise application services, emerging geographies and new verticals. The early indicators of these investments are showing in our diversified business portfolio, thought leadership and improving market share and most importantly in employee satisfaction.” 3 www.hcltech.com/Investors
- 4. Business Highlights 700 HCL Revenues 3x in 4 years 600 CQGR 500 6.9% 400 300 200 100 0 09 6 05 06 08 07 8 5 7 8 07 9 6 8 05 06 07 5 S0 J0 J0 J0 J0 D0 J0 S0 S0 M M S M M M D AM D D AM AM AM AM JA ON JA JA JA JF ON ON ON JF JF JF JF QoQ Revenue Growth Rate - % 12% QoQ growth % 10% 7.6% 11.3% 8% 6% 4% 5.2% 5.1% 2% 0% 1.2% - 2% -0.1% Mar'08 Jun'08 Sep'08 Dec'08 Mar'09 Jun'09 YoY Revenue Growth Rate - % 40% YoY growth % 30% 31.8% 20% 26.8% 21.0% 10% 17.2% 18.2% 11.7% 0% Mar'08 Jun'08 Sep'08 Dec'08 Mar'09 Jun'09 EBIT 120 109.5 96.1 92.4 US$ mn 90.1 90.6 81.3 80 40 Mar'08 Jun'08 Sep'08 Dec'08 Mar'09 Jun'09 4 www.hcltech.com/Investors
- 5. Key Catalysts for Growth • HCL has witnessed positive growth across all the geographies • Infrastructure Services, Custom Application and Enterprise Application Services recorded accelerated growth reaffirming HCL’s dominant market position and competitiveness in these service lines respectively • The fastest growth was recorded in Media Publishing & Entertainment, while Financial Services, Manufacturing and Life Sciences have demonstrated positive traction Particulars Segment (US $ ) Growth Annual QoQ QoQ YoY (CC*) Consolidated For the Company 17.1% 7.6% 3.9% Geography Asia Pacific 1.7% 18.8% 9.4% Europe 9.9% 11.2% 1.6% US 25.1% 3.8% 3.8% Service Offering Infrastructure Services 25.7% 25.4% 21.3% Custom Application 1.3% 12.7% 7.9% Enterprise Application Services 94.7% 3.4% -0.7% Industry Media Publishing & Entertainment (MPE) 11.8% 19.8% 18.4% Financial Services 6.3% 13.3% 6.8% Manufacturing 20.6% 9.7% 7.5% Life Sciences 30.7% 8.7% 7.7% * CC - Constant Currency 5 www.hcltech.com/Investors
- 6. Multi-serivce; Multi-year; Multi-million dollar deals • New wins during this quarter include Dr Pepper Snapple Group, Sony Corporation, Nokia Corporation, The Linde Group, Agilent Technologies amongst others Transformation @ HCL • This year HCL conducted a Third party annual Customer Satisfaction survey. The survey established a 43% increase in overall experience scores including loyalty, advocacy, satisfaction and value for money scores with the respondent base increased by 110% Recognitions • HCL profiled as a case-study in the new edition of global bestseller ‘Blueprint to a Billion’ by David G Thomson. The case study articulates how HCL successfully applied the essentials that continue to serve as a global pattern for success, independent of industry, geographic location and economic cycle. This is the third consecutive case study on HCL’s innovative management practices after Harvard Business School and London Business School • HCL named as one of Britain’s Top Employers 2009 for the third successive year by CRF International, an independent business research organisation. HCL was recognised for its long standing commitment to supporting employee productivity in a culture and working environment in which they feel appreciated and innovation is allowed to thrive • HCL AXON wins the 2009 SAP Pinnacle Award. The Global Partner Award recognizes SAP Partners that made exemplary contributions to SAP’s Ecosystem • HCL recognized as a “Leader” in the Forrester WaveTM for North American SOA Systems Integrators,Q2 2009 with HCL scoring one of the highest in customer satisfaction. In the Forrester WaveTM for Global IT Infrastructure Outsourcing Q1 2009, HCL has also been rated as a “Leader” with recognition for its excellent strategies and strong delivery capability • HCL Technologies Ranked ‘Number One’ Among the Top 50 Best Managed Global Outsourcing Vendors of 2009 in The Black Book of Outsourcing by Brown & Wilson. The annual survey, based on client experience of outsourcing vendor management, execution and performance, has ranked HCL Technologies at the top of the list of 50 firms, ahead of global giants • HCL adjudged as the winner of the Indian MAKE (The Most Admired Knowledge Enterprises) Awards 2009. The Global MAKE study recognizes organizations which are world leaders in creating shareholder wealth by transforming new as well as existing enterprise knowledge and intellectual capital into superior products/services/solutions 6 www.hcltech.com/Investors
- 7. Financials Audited consolidated financial results for the quarter and Year ended 30th June, 2009 drawn under US GAAP Consolidated Income Statement Figures in US $ million Income Statement Quarter ended Growth Year ended Growth 30-Jun-08 31-Mar-09 30-Jun-09 YoY QoQ 30-Jun-08 30-Jun-09 YoY Revenues 501.7 564.4 607.2 21.0% 7.6% 1860.9 2179.5 17.1% Direct Costs 300.0 355.2 378.6 1153.7 1347.2 Gross Profits 201.7 209.2 228.6 13.3% 9.3% 707.2 832.3 17.7% SG & A 85.8 88.8 94.1 309.1 357.5 EBITDA 115.8 120.4 134.5 16.1% 11.7% 398.1 474.8 19.3% Depreciation 19.3 19.2 17.1 73.6 73.0 Amortisation 0.4 8.7 7.9 1.0 19.2 EBIT 96.1 92.4 109.5 13.9% 18.4% 323.5 382.6 18.3% Cash flow Hedge accounting gain/(loss) 2.3 (24.8) (32.9) 18.0 (49.5) Foreign Exchange Gains/(loss) (69.7) (15.0) 14.4 (71.3) (50.4) Other Income, net 8.3 (0.5) (2.4) 42.0 33.8 Provision for Tax 4.7 9.6 19.5 31.6 52.5 Share from Equity Investment/ of minority shareholders 0.5 0.3 (0.1) (0.5) 0.5 Net Income 32.8 43.0 68.9 110.3% 60.2% 280.0 264.4 -5.6% Net Income before forex gain/(Loss) 100.2 82.7 87.4 -12.7% 5.6% 333.3 364.4 9.3% Gross Margin 40.2% 37.1% 37.6% 38.0% 38.2% EBITDA Margin 23.1% 21.3% 22.1% 21.4% 21.8% EBIT Margin 19.2% 16.4% 18.0% 17.4% 17.6% Earnings Per Share (EPS) - Annualized Basic – in US $ 0.20 0.26 0.41 0.42 0.40 Diluted – in US $ 0.19 0.26 0.41 0.41 0.39 “Weighted average number of Shares used in computing EPS” Basic 665,561,705 669,733,531 669,896,432 664,424,330 669,016,035 Diluted 682,648,533 669,930,775 674,553,269 682,748,596 674,009,042 7 www.hcltech.com/Investors
- 8. Note: - The above result does not take into account non cash employee stock options charge computed under FAS 123R, as per details given here:- Quarter Ended Year Ended Particulars (in US $ mn) 30-Jun-08 31-Mar-09 30-Jun-09 30-Jun-08 30-Jun-09 Options at market price 1.3 0.5 0.5 5.4 1.9 Options at less than market price 4.6 3.5 3.3 18.5 14.4 Total 5.9 4.0 3.8 23.9 16.3 Tax benefit 0.5 0.3 (0.4) 2.2 0.6 Total (net of tax) 5.4 3.7 4.2 21.7 15.7 Outstanding Options 30-Jun-08 31-Mar-09 30-Jun-09 (in equivalent no of shares) Options at market price 28,208,456 24,459,024 23,962,552 Options at less than market price 12,749,200 10,255,544 9,711,852 The options will vest in tranches till 2011 Consolidated Balance Sheet Figures in US $ million Particulars As on 30-Jun-08 30-Jun-09 Assets a) Cash & Cash Equivalents 108.2 87.7 b) Account Receivables, net 440.1 565.4 c) Deposit with Banks 125.5 304.0 d) Investment Securities, available for sale 335.7 4.8 e) Other Current Assets 105.7 223.4 A) Total Current Assets (a+b+c+d+e) 1,115.1 1185.3 B) Property and Equipments, net 309.5 331.1 C) Intangible Assets, net 222.7 946.2 D) Investment Securities, held to maturity 2.8 4.2 E) Investment in Equity Investee 2.4 3.5 F) Other Assets 117.6 179.7 Total Assets (A+B+C+D+E+F) 1,770.0 2650.1 Liabilities & Stockholders' Equity e) Current Liabilities* 411.5 682.1 f) Loans 6.4 621.5 g) Other Liabilities 138.5 159.4 F) Total Liabilities (e+f+g) 556.4 1463.0 G) Minority Interest 1.3 0.3 H) Total Stockholders Equity 1212.4 1186.7 Total Liabilities and Stockholders Equity (F+G+H) 1,770.0 2650.1 *Tax payable has been shown net of advance taxes. Previous year figure has also been reclassified to conform the current presentation (US$ 96.7 mn) 8 www.hcltech.com/Investors
- 9. Consolidated Cash Flow Statement Figures in US $ million Particulars Year ended 30-Jun-09 CASH FLOWS FROM OPERATING ACTIVITIES Net Income 264.4 Adjustments to Reconcile Net Income to Net Cash provided by Operating Activities Depreciation and Amortization 92.2 (Profit) /Loss on Redemption of Mutual Fund Investments (24.5) Others (7.9) Changes in Assets and Liabilities, net Accounts Receivable (53.5) Other Assets (127.3) Current Liabilities 62.4 Net Cash provided by operating Activities 205.9 CASH FLOWS FROM INVESTING ACTIVITIES Purchase of Property and Equipment (net) (109.2) Short term deposit with Banks (191.1) (Purchase) / Sale of investments 303.0 Payments for business acquisitions, net of cash acquired (703.8) Net Cash used in Investing Activities (701.0) CASH FLOWS FROM FINANCING ACTIVITIES Proceeds from Issuance of Employees Stock Options 4.6 Dividend (148.0) Loans 615.2 Others (0.3) Net Cash provided by (used in) Financing Activities 471.5 Net Increase/ (Decrease) in Cash and Cash Equivalents (23.6) Effect of Exchange Rate on Cash and Cash Equivalents 3.2 CASH AND CASH EQUIVALENTS Beginning of the Year 108.2 End of the Year 87.7 9 www.hcltech.com/Investors
- 10. Segment wise Profitability A. Consolidated IT Services (Software Services [A1] & Infrastructure services [A2]) Figures in US $ million Income Statement Quarter ended Growth Year ended Growth 30-Jun-08 31-Mar-09 30-Jun-09 YoY QoQ 30-Jun-08 30-Jun-09 YoY Revenues 445.3 508.1 548.6 23.2% 8.0% 1638.6 1945.1 18.7% Direct Costs 268.4 319.0 339.8 1021.1 1195.3 Gross Profits 176.9 189.1 208.8 18.0% 10.4% 617.5 749.8 21.4% SG & A 76.8 77.3 83.1 277.6 310.8 EBITDA 100.1 111.8 125.7 25.6% 12.4% 339.9 439.0 29.2% Depreciation 16.4 17.0 14.9 60.8 63.0 Amortisation 0.4 8.2 7.6 1.0 17.8 EBIT 83.2 86.6 103.2 24.0% 19.2% 278.1 358.2 28.8% Gross Margin 39.7% 37.2% 38.1% 37.7% 38.5% EBITDA Margin 22.5% 22.0% 22.9% 20.7% 22.6% EBIT Margin 18.7% 17.0% 18.8% 17.0% 18.4% B. BPO Services Figures in US $ million Income Statement Quarter ended Growth Year ended Growth 30-Jun-08 31-Mar-09 30-Jun-09 YoY QoQ 30-Jun-08 30-Jun-09 YoY Revenues 56.3 56.4 58.6 4.0% 4.0% 222.3 234.4 5.4% Direct Costs 31.6 36.2 38.8 132.6 151.9 Gross Profits 24.8 20.2 19.8 -20.1% -1.8% 89.7 82.5 -8.1% SG & A 9.0 11.5 11.0 31.5 46.7 EBITDA 15.8 8.6 8.8 -44.2% 2.1% 58.2 35.8 -38.4% Depreciation 2.9 2.2 2.2 12.8 10.0 Amortisation - 0.5 0.3 - 1.4 EBIT 12.9 5.9 6.3 -51.0% 7.1% 45.4 24.3 -46.3% Gross Margin 44.0% 35.8% 33.8% 40.4% 35.2% EBITDA Margin 28.0% 15.3% 15.1% 26.2% 15.3% EBIT Margin 22.9% 10.5% 10.8% 20.4% 10.4% 10 www.hcltech.com/Investors
- 11. A1. Software Services Figures in US $ million Income Statement Quarter ended Growth Year ended Growth 30-Jun-08 31-Mar-09 30-Jun-09 YoY QoQ 30-Jun-08 30-Jun-09 YoY Revenues 369.1 422.7 441.5 19.6% 4.5% 1355.3 1589.2 17.3% Direct Costs 217.6 263.0 267.1 826.6 957.1 Gross Profits 151.5 159.6 174.4 15.1% 9.2% 528.7 632.1 19.6% SG & A 65.8 66.6 69.5 238.8 264.1 EBITDA 85.8 93.0 104.9 22.3% 12.8% 290.0 368.1 26.9% Depreciation 12.8 12.0 11.7 46.8 47.6 Amortisation 0.4 8.2 7.6 1.0 17.8 EBIT 72.5 72.8 85.5 17.9% 17.5% 242.1 302.7 25.0% Gross Margin 41.1% 37.8% 39.5% 39.0% 39.8% EBITDA Margin 23.2% 22.0% 23.8% 21.4% 23.2% EBIT Margin 19.6% 17.2% 19.4% 17.9% 19.0% A2. Infrastructure Services Figures in US $ million Income Statement Quarter ended Growth Year ended Growth 30-Jun-08 31-Mar-09 30-Jun-09 YoY QoQ 30-Jun-08 30-Jun-09 YoY Revenues 76.2 85.4 107.1 40.5% 25.5% 283.3 355.9 25.7% Direct Costs 50.8 56.0 72.7 194.5 238.2 Gross Profits 25.4 29.4 34.4 35.7% 17.0% 88.8 117.7 32.6% SG & A 11.1 10.7 13.7 38.9 46.8 EBITDA 14.3 18.7 20.7 45.3% 10.6% 49.9 70.9 42.1% Depreciation 3.6 5.0 3.1 13.9 15.4 Amortisation - - - - - EBIT 10.7 13.7 17.6 65.3% 28.3% 36.0 55.5 54.3% Gross Margin 33.3% 34.5% 32.1% 31.3% 33.1% EBITDA Margin 18.7% 22.0% 19.4% 17.6% 19.9% EBIT Margin 14.0% 16.1% 16.5% 12.7% 15.6% 11 www.hcltech.com/Investors
- 12. Revenue Analysis Geographic Mix (Quarter ended) 30-Jun-08 31-Mar-09 30-Jun-09 LTM US 57.2% 61.0% 58.9% 59.1% Europe 29.2% 27.6% 28.5% 28.1% Asia Pacific 13.6% 11.4% 12.6% 12.8% Service Offering Mix (Quarter ended) 30-Jun-08 31-Mar-09 30-Jun-09 LTM Enterprise Application Services 10.8% 24.5% 23.6% 18.3% Engineering and R&D Services 26.7% 22.0% 19.4% 23.1% Custom Application (Industry Solutions) 36.1% 28.4% 29.7% 31.5% Infrastructure Services 15.2% 15.1% 17.6% 16.3% BPO Services 11.2% 10.0% 9.7% 10.8% Revenue by Contract Type (Qtr ended) 30-Jun-08 31-Mar-09 30-Jun-09 IT Services Time & Material (T&M) 65.0% 62.4% 61.5% Fixed Price Projects 35.0% 37.6% 38.5% Revenue by Vertical (Quarter ended) 30-Jun-08 31-Mar-09 30-Jun-09 Financial Services 27.3% 23.6% 24.8% Manufacturing 30.6% 30.3% 30.9% Telecom 16.0% 12.1% 12.5% Retail & CPG 8.8% 6.9% 6.6% Media Publishing & Entertainment (MPE) 5.6% 5.0% 5.6% Life Sciences 5.7% 6.3% 6.4% Energy-Utilities-Public Sector 1.5% 8.9% 7.6% Others 4.5% 6.9% 5.6% Rupee / US Dollar Rate 30-Jun-08 31-Mar-09 30-Jun-09 Quarter Ended 43.04 50.70 47.90 Average for the Quarter 42.00 50.23 48.35 “LTM” - Last Twelve Months 12 www.hcltech.com/Investors
- 13. Constant Currency (CC) Reporting Reported JFM 08 AMJ 08 JAS 08 OND 08 JFM 09 AMJ 09 Revenue ($ mn) 477.5 501.7 500.9 507.0 564.4 607.2 Growth QoQ 5.2% 5.1% -0.1% 1.2% 11.3% 7.6% Growth YoY 31.8% 26.8% 17.2% 11.7% 18.2% 21.0% Constant Currency (QoQ) JFM 08 AMJ 08 JAS 08 OND 08 JFM 09 AMJ 09 Revenue ($ mn) 476.7 501.8 512.3 540.8 572.2 586.2 Growth QoQ 5.0% 5.1% 2.1% 8.0% 12.9% 3.9% Constant Currency (YoY) JFM 08 AMJ 08 JAS 08 OND 08 JFM 09 AMJ 09 Revenue ($ mn) 461.9 492.0 507.7 555.3 608.7 645.3 Growth YoY 27.5% 24.3% 18.8% 22.4% 27.5% 28.6% Average Rates for Qtr JFM 08 AMJ 08 JAS 08 OND 08 JFM 09 AMJ 09 GBP 1.99 1.98 1.87 1.54 1.43 1.58 EURO 1.53 1.56 1.49 1.32 1.30 1.38 INR 0.03 0.02 0.02 0.02 0.02 0.02 SGD 0.72 0.73 0.71 0.68 0.66 0.69 AUD 0.91 0.95 0.87 0.67 0.66 0.78 Particulars Segment (US $ ) QoQ at Growth CC Consolidated For the Company 3.9% Geography US 3.8% Europe 1.6% Asia Pacific 9.4% Service Offering Enterprise Application Services -0.7% Engineering and R&D Services -5.1% Custom Application 7.9% Infrastructure Services 21.3% BPO Services -3.1% Industry Financial Services 6.8% Manufacturing 7.5% Telecom 6.4% Retail & CPG -0.6% Media Publishing & Entertainment 18.4% Life Sciences 7.7% Energy-Utilities-Public Sector -12.8% Others -14.7% Clients(LTM) Top 5 -2.4% Top 10 -3.2% Top 20 -0.7% 13 www.hcltech.com/Investors
- 14. Client Metrics Client Data (LTM) 30-Jun-08 31-Mar-09 30-Jun-09 QoQ Increase Number of Clients Active Client Relationship 279 353 367 14 New Client Relationship 30 68 37 Accounting for > 5% of revenue 2 2 2 Number of Million Dollar Clients (LTM) 30-Jun-08 31-Mar-09 30-Jun-09 QoQ YoY Increase Increase 100 Million dollar + 2 2 2 - - 50 Million dollar + 3 4 4 - 1 40 Million dollar + 8 7 7 - (1) 30 Million dollar + 12 11 8 (3) (4) 20 Million dollar + 16 19 20 1 4 10 Million dollar + 34 40 43 3 9 5 Million dollar + 66 81 85 4 19 1 Million dollar + 201 256 253 (3) 52 Client Contribution to Revenue (LTM) 30-Jun-08 31-Mar-09 30-Jun-09 QoQ growth Top 5 Clients 26.7% 22.7% 20.6% -3.9% Top 10 Clients 37.3% 31.9% 28.9% -4.3% Top 20 Clients 49.6% 43.6% 40.2% -2.3% Client Business - (LTM) 30-Jun-08 31-Mar-09 30-Jun-09 Repeat Business - Consolidated 94.0% 90.0% 88.4% Days Sales Outstanding 79 83 84 Days Sales Outstanding - excluding unbilled revenue 67 69 68 “LTM” - Last Twelve Months 14 www.hcltech.com/Investors
- 15. Operational Metrics - Software Services Software Services (Quarter Ended) 30-Jun-08 31-Mar-09 30-Jun-09 Efforts Offshore 74.7% 71.6% 71.7% Onsite 25.3% 28.4% 28.3% Revenue Offshore 50.2% 41.1% 41.2% Onsite 49.8% 58.9% 58.8% Utilization Offshore - Including trainees 73.9% 74.1% 76.2% Offshore - Excluding trainees 74.1% 74.8% 76.5% Onsite 96.8% 96.4% 97.0% Software Services Efforts (Man Months) 30-Jun-08 31-Mar-09 30-Jun-09 Efforts Billed - Offshore 48,957 50,539 50,640 Efforts Billed – Onsite 16,608 20,049 20,022 Total Billed Efforts 65,566 70,587 70,662 Not Billed 17,705 18,401 16,179 Trainee 135 75 276 Not Billed (including trainees) 17,840 18,476 16,455 15 www.hcltech.com/Investors
- 16. Employee Metrics Manpower Details 30-Jun-08 31-Mar-09 30-Jun-09 Total Employee Count 50,741 54,026 54,216 IT Services (Software Services [A1] + Infrastructure Services [A2]) 37,426 42,600 42,416 Technical 32,822 37,666 37,544 Support 4,604 4,934 4,872 Gross addition 2,894 1,578 1,353 Net addition 863 332 (184) Gross lateral employee addition 2,391 1,423 667 Attrition (LTM)* - IT Services (Software Services + Infrastructure Services) 14.8% 13.2% 13.0% BPO Services - Total 13,315 11,426 11,800 Offshore 10,620 7,808 8,203 Onsite 1,582 2,188 2,218 Support 1,113 1,430 1,379 Gross addition 2,423 720 2,038 Net addition 76 (1,324) 374 Gross lateral employee addition 1,234 160 662 Offshore Attrition – Quarterly** 12.3% 14.8% 12.6% Offshore Attrition - Quarterly** (excluding attrition of joinees less than 6 months) 5.4% 10.6% 9.3% * Excludes involuntary attrition ** Excludes UK BPO 16 www.hcltech.com/Investors
- 17. A1. Software Services 30-Jun-08 31-Mar-09 30-Jun-09 Software Services - Total 30,391 32,902 32,364 Technical 26,592 28,887 28,353 Support 3,799 4,015 4,011 Gross addition 1,792 622 844 Net addition 4 (396) (538) Gross lateral employee addition 1,580 596 322 Attrition (LTM) 14.8% 13.1% 12.9% A2. Infrastructure Services 30-Jun-08 31-Mar-09 30-Jun-09 Infrastructure Services - Total 7,035 9,698 10,052 Technical 6,230 8,779 9,191 Support 805 919 861 Gross addition 1,102 956 509 Net addition 859 728 354 Gross lateral employee addition 811 827 345 Attrition (LTM) 14.9% 13.5% 13.2% 17 www.hcltech.com/Investors
- 18. Facility Details As on 30th June 2009 Completed Work in Progress Land Available Built Up area Built Up area for expansion - Delivery Locations No. of seats No. of seats in acres (Sq. ft.) (Sq. ft.) Gurgaon 330,127 2,922 Noida (NCR) 1,936,012 21,861 31 Chennai 2,480,358 22,941 569,557 3,973 27 Bangalore 864,900 7,998 518,000 4,400 13 Mumbai 28,300 300 Kolkatta 93,442 1,010 Hyderabad 158,224 1,582 Manesar (Haryana) 10 Nagpur 50,000 500 UK 88,613 1,118 USA 77,020 607 19,512 200 Nortern Ireland(NI) 100,000 1,400 Dubai 886 10 Prague, Czech 2,711 14 Israel 6,650 41 Singapore 15,656 187 Australia 17,894 133 Poland 16,100 200 China 15,300 140 Malaysia 40,955 540 Finland 7,920 70 Brazil 3,800 54 Total 6,281,067 63,074 1,160,869 9,127 81 18 www.hcltech.com/Investors
- 19. Cash & Cash Equivalent and Investments Figures in US $ million As of 30-Jun-09 A. Cash and Cash Equivalent 87.7 B. Fixed Deposit with Banks 304.0 C. Investment Securities, available for Sale 4.8 D. Investment Securities, held to maturity 4.2 Total (A+B+C+D) 400.7 Figures in US $ million A. Details of Cash & Cash Equivalent Bank Name Country Amount in US$ million Silicon Valley Bank USA 4.4 Bank of Baroda India 4.3 HSBC India 4.0 Standard Chartered Bank India 3.1 Barclays Bank UK 2.4 Axis Bank India 1.9 Standard Chartered Bank UK 1.6 State Bank of India India 1.3 Punjab National Bank India 1.2 Bank of Tokyo Japan 1.0 HSBC Malaysia 1.0 Citi Bank - Delaware USA 0.9 Cheques in hand 16.2 Remittances in transit 38.6 Others 6.0 Grand Total 87.7 19 www.hcltech.com/Investors
- 20. Cash & Cash Equivalent and Investments Figures in US $ million B. Details of Investments 30-Jun-09 Fixed Deposits Axis Bank 0.2 Bank of Baroda 71.0 Bank of India 41.8 Canara Bank 47.1 Corporation Bank 5.8 Punjab National Bank 44.0 State Bank of India 93.7 Society General Bank 0.4 Total Fixed Deposit with Banks 304.0 C. Details of Investment Securities, available for Sale DSP Merrill Lynch Mutual Fund - Fixed Maturity Plan ( maturing in next 3 months) 3.9 Others 0.1 Total Investment Securities, available for Sale 4.8 D. Details of Investment Securities, held to Maturity Exim bank Bonds 2008-09 4.2 Total Investment Securities, held to Maturity 4.2 20 www.hcltech.com/Investors
- 21. Financials in INR as per convenience translation (The financials in INR are based on a convenience translation using the closing rate as of the last day of the quarter: US$1 = Rs. 47.90 for the quarter ended on 30 Jun 2009; US $1 = Rs. 50.70 for the quarter ended on 31 Mar 2009; US$ 1 = Rs. 43.04 for the quarter ended 30 Jun 2008: average rate: US$1 = Rs. 48.35 for FY 2008 - 09 and US$ = Rs. 40.66 for FY 2007-08) Audited Financial results for the quarter and Year ended 30th June 2009 drawn under US GAAP Consolidated Income Statement Figures in Rs Crores Income Statement Quarter ended Growth Year ended Growth 30-Jun-08 31-Mar-09 30-Jun-09 YoY QoQ 30-Jun-08 30-Jun-09 YoY Revenues 2158.9 2861.5 2908.5 34.7% 1.6% 7567.0 10591.0 40.0% Direct Costs 1291.0 1800.9 1813.6 4687.7 6548.3 Gross Profits 867.9 1060.7 1094.9 26.2% 3.2% 2879.2 4042.7 40.4% SG & A 369.4 450.3 450.8 1257.8 1736.2 EBITDA 498.5 610.4 644.1 29.2% 5.5% 1621.4 2306.5 42.3% Depreciation 83.2 97.4 81.9 299.0 354.8 Amortisation 1.8 44.1 37.8 4.3 94.6 EBIT 413.5 468.6 524.4 26.8% 11.9% 1318.2 1857.1 40.9% Cash flow Hedge accounting gain/(loss) 9.9 (125.5) (157.6) 72.5 (244.0) Foreign Exchange Gains/(loss) (299.9) (76.1) 69.0 (306.7) (246.1) Other Income, net 35.5 (2.4) (11.6) 169.8 162.4 Provision for Tax 20.3 48.5 93.5 127.1 254.4 Share from Equity Investment/ of minority shareholders 2.3 1.7 (0.4) (1.9) 2.7 Net Income 141.0 218.1 330.1 134.1% 51.3% 1124.8 1277.7 13.6% Net Income before forex gain/(loss) 431.0 419.4 418.9 -2.8% -0.2% 1358.9 1767.8 30.1% Gross Margin 40.2% 37.1% 37.6% 38.0% 38.2% EBITDA Margin 23.1% 21.3% 22.1% 21.4% 21.8% EBIT Margin 19.2% 16.4% 18.0% 17.4% 17.5% Earnings Per Share (EPS) - Annualized Basic – in Rupees (FV Rs. 2/-) 8.5 13.0 19.7 16.9 19.1 Diluted – in Rupees (FV Rs. 2/-) 8.3 13.1 19.6 16.7 19.1 “Weighted average number of Shares used in computing EPS” Basic 665,561,705 669,733,531 669,896,432 664,424,330 669,016,035 Diluted 682,648,533 669,930,775 674,553,269 682,748,596 674,009,042 21 www.hcltech.com/Investors
- 22. Note: - The above result does not take into account non cash employee stock options charge computed under FAS 123R, as per details given here:- Quarter Ended Year Ended Particulars (in US $ mn) 30-Jun-08 31-Mar-09 30-Jun-09 30-Jun-08 30-Jun-09 Options at market price 5.5 2.3 2.5 21.8 9.3 Options at less than market price 19.9 17.5 16.7 75.4 70.4 Total 25.4 19.8 19.2 97.2 79.7 Tax benefit 2.3 1.5 (2.0) 8.8 2.9 Total (net of tax) 23.1 18.3 21.2 88.4 76.8 Outstanding Options 30-Jun-08 31-Mar-09 30-Jun-09 (in equivalent no of shares) Options at market price 28,208,456 24,459,024 23,962,552 Options at less than market price 12,749,200 10,255,544 9,711,852 The options will vest in tranches till 2011 Consolidated Balance Sheet Figures in Rs crores Particulars As on 30-Jun-08 30-Jun-09 Assets a) Cash and Cash Equivalents 464.8 420.3 b) Accounts Receivable, net 1,894.0 2,708.3 c) Deposit with Banks 540.1 1,456.2 d) Investment Securities, available for sale 1,444.7 23.0 e) Other Current Assets 455.1 1,069.9 A) Total current assets (a+b+c+d+e) 4,798.7 5,677.6 B) Property and Equipment, net 1,331.7 1,586.2 C) Intangible Assets, net 958.5 4,532.5 D) Investment Securities, held to maturity 12.0 20.1 E) Investment in Equity Investee 10.1 16.9 F) Other Assets 506.3 860.8 Total assets (A+B+C+D+E+F) 7,617.5 12,693.9 Liabilities and Stockholders' Equity e) Current Liabilities 1,770.9 3,267.5 f) Loans 27.3 2,977.1 g) Other Liabilities 595.9 763.4 F) Total Liabilities (e+f+g) 2,394.1 7,008.0 G) Minority Interest 5.7 1.6 H) Total Stockholders equity 5,217.7 5,684.3 Total liabilities and stockholders equity (F+G+H) 7,617.5 12,693.9 Tax payable has been shown net of advance taxes. Previous year figure has also been reclassified to conform the current presentation (Rs. 416.1 crore) 22 www.hcltech.com/Investors
- 23. Segment wise Profitability A. Consolidated IT Services (Software Services [A1] & Infrastructure Services [A2]) Figures in Rs crores Income Statement Quarter ended Growth Year ended Growth 30-Jun-08 31-Mar-09 30-Jun-09 YoY QoQ 30-Jun-08 30-Jun-09 YoY Revenues 1916.5 2575.8 2627.9 37.1% 2.0% 6664.4 9452.8 41.8% Direct Costs 1155.2 1617.4 1627.7 4149.9 5810.7 Gross Profits 761.3 958.5 1000.1 31.4% 4.3% 2514.5 3642.0 44.8% SG & A 330.7 391.9 398.2 1129.5 1509.2 EBITDA 430.5 566.6 601.9 39.8% 6.2% 1385.0 2132.8 54.0% Depreciation 70.7 86.2 71.2 247.1 306.2 Amortisation 1.8 41.7 36.6 4.2 87.5 EBIT 358.0 438.7 494.1 38.0% 12.6% 1133.7 1739.1 53.4% Gross Margin 39.7% 37.2% 38.1% 37.7% 38.5% EBITDA Margin 22.5% 22.0% 22.9% 20.7% 22.6% EBIT Margin 18.7% 17.0% 18.8% 17.0% 18.4% B. BPO Services Figures in Rs crores Income Statement Quarter ended Growth Year ended Growth 30-Jun-08 31-Mar-09 30-Jun-09 YoY QoQ 30-Jun-08 30-Jun-09 YoY Revenues 242.4 285.7 280.6 15.8% -1.8% 902.6 1138.2 26.1% Direct Costs 135.8 183.5 185.9 537.8 737.6 Gross Profits 106.6 102.2 94.8 -11.1% -7.3% 364.8 400.7 9.8% SG & A 38.7 58.4 52.6 128.3 227.0 EBITDA 67.9 43.8 42.2 -37.9% -3.7% 236.5 173.7 -26.6% Depreciation 12.5 11.3 10.8 51.9 48.6 Amortisation - 2.6 1.2 - 7.1 EBIT 55.4 29.9 30.2 -45.5% 0.9% 184.5 117.9 -36.1% Gross Margin 44.0% 35.8% 33.8% 40.4% 35.2% EBITDA Margin 28.0% 15.3% 15.0% 26.2% 15.3% EBIT Margin 22.9% 10.5% 10.8% 20.4% 10.4% 23 www.hcltech.com/Investors
- 24. A1. Software Services Figures in Rs crores Income Statement Quarter ended Growth Year ended Growth 30-Jun-08 31-Mar-09 30-Jun-09 YoY QoQ 30-Jun-08 30-Jun-09 YoY Revenues 1588.5 2143.0 2114.8 33.1% -1.3% 5512.6 7724.7 40.1% Direct Costs 936.4 1333.7 1279.6 3359.6 4654.4 Gross Profits 652.1 809.4 835.3 28.1% 3.2% 2153.0 3070.3 42.6% SG & A 283.0 337.8 332.7 971.3 1282.3 EBITDA 369.1 471.5 502.5 36.1% 6.6% 1181.7 1787.9 51.3% Depreciation 55.2 60.8 56.3 190.5 231.0 Amortisation 1.8 41.7 36.6 4.2 87.5 EBIT 312.1 369.0 409.6 31.3% 11.0% 987.0 1469.4 48.9% Gross Margin 41.1% 37.8% 39.5% 39.0% 39.8% EBITDA Margin 23.2% 22.0% 23.8% 21.4% 23.1% EBIT Margin 19.6% 17.2% 19.4% 17.9% 19.0% A2. Infrastructure Services Figures in Rs crores Income Statement Quarter ended Growth Year ended Growth 30-Jun-08 31-Mar-09 30-Jun-09 YoY QoQ 30-Jun-08 30-Jun-09 YoY Revenues 328.0 432.8 513.0 56.4% 18.5% 1151.7 1728.1 50.0% Direct Costs 218.8 283.7 348.2 790.3 1156.3 Gross Profits 109.1 149.1 164.9 51.1% 10.6% 361.4 571.8 58.2% SG & A 47.7 54.1 65.5 158.2 226.9 EBITDA 61.4 95.0 99.3 61.8% 4.5% 203.3 344.9 69.7% Depreciation 15.5 25.3 14.9 56.6 75.2 Amortisation 0 0.0 0.0 0.0 EBIT 45.9 69.7 84.5 83.9% 21.2% 146.6 269.7 83.9% Gross Margin 33.3% 34.5% 32.1% 31.3% 33.1% EBITDA Margin 18.7% 22.0% 19.4% 17.6% 20.0% EBIT Margin 14.0% 16.1% 16.5% 12.7% 15.6% 24 www.hcltech.com/Investors
- 25. About HCL Technologies HCL Technologies is a leading global IT services company, working with clients in the areas that impact and redefine the core of their businesses. Since its inception into the global landscape after its IPO in 1999, HCL focuses on ‘transformational outsourcing’, underlined by innovation and value creation, and offers integrated portfolio of services including software-led IT solutions, remote infrastructure management, engineering and R&D services and BPO. HCL leverages its extensive global offshore infrastructure and network of offices in 20 countries to provide holistic, multi-service delivery in key industry verticals including Financial Services, Manufacturing, Aerospace & Defense, Telecom, Retail & CPG, Life Sciences & Healthcare, Media & Entertainment, Travel, Transportation & Logistics, Automotive, Government, Energy & Utilities. HCL takes pride in its philosophy of ‘Employee First’ which empowers our 54,216 transformers to create a real value for the customers. HCL Technologies, along with its subsidiaries, had consolidated revenues of US$ 2.2 billion (Rs. 10,591 crores), as on 30th June 2009. For more information, please visit www.hcltech.com About HCL Enterprise HCL is a $5 billion leading global Technology and IT Enterprise that comprises two companies listed in India - HCL Technologies & HCL Infosystems. Founded in 1976, HCL is one of India's original IT garage start-ups, a pioneer of modern computing, and a global transformational enterprise today. Its range of offerings spans Product Engineering, Custom & Package Applications, BPO, IT Infrastructure Services, IT Hardware, Systems Integration, and distribution of ICT products across a wide range of focused industry verticals. The HCL team comprises over 60,000 professionals of diverse nationalities, who operate from 23 countries including over 500 points of presence in India. HCL has global partnerships with several leading Fortune 1000 firms, including leading IT and Technology firms. For more information, please visit www.hcl.in Forward-looking Statements Certain statements in this release are forward-looking statements, which involve a number of risks, uncertainties, assumptions and other factors that could cause actual results to differ materially from those in such forward-looking statements. All statements, other than statements of historical fact are statements that could be deemed forward looking statements, including but not limited to the statements containing the words 'planned', 'expects', 'believes', 'strategy', 'opportunity', 'anticipates', 'hopes' or other similar words. The risks and uncertainties relating to these statements include, but are not limited to, risks and uncertainties regarding impact of pending regulatory proceedings, fluctuations in earnings, our ability to manage growth, intense competition in IT services, Business Process Outsourcing and consulting services including those factors which may affect our cost advantage, wage increases in India, customer acceptances of our services, products and fee structures, our ability to attract and retain highly skilled professionals, our ability to integrate acquired assets in a cost effective and timely manner, time and cost overruns on fixed-price, fixed-time frame contracts, client concentration, restrictions on immigration, our ability to manage our international operations, reduced demand for technology in our key focus areas, disruptions in telecommunication networks, our ability to successfully complete and integrate potential acquisitions, the success of our brand development efforts, liability for damages on our service contracts, the success of the companies / entities in which we have made strategic investments, withdrawal of governmental fiscal incentives, political instability, legal restrictions on raising capital or acquiring companies outside India, and unauthorized use of our intellectual property, other risks, uncertainties and general economic conditions affecting our industry. There can be no assurance that the forward looking statements made herein will prove to be accurate, and issuance of such forward looking statements should not be regarded as a representation by the Company, or any other person, that the objective and plans of the Company will be achieved. All forward looking statements made herein are based on information presently available to the management of the Company and the Company does not undertake to update any forward-looking statement that may be made from time to time by or on behalf of the Company. 25 www.hcltech.com/Investors
- 26. Talk to me For details, contact: MEDIA RELATIONS INVESTOR RELATIONS Geetanjali Bhatia Sanjay Mendiratta geetanjali.bhatia@hcl.in sanjay.mendiratta@hcl.in +91- 98119 87765 +91- 9312065108 Abhishek Gulyani Renu Yadav abhishek.gulyani@bm.com renu.yadav@hcl.in +91-9899045766 +91- 98713 89754 Ronit Dutta ronit.dutta@hcl.in +91- 9711002816 HCL Technologies Ltd., A 10-11, Sector-III, Noida - 201301 www.hcltech.com Hello there. I'm from HCL. We work behind the scenes, helping our customers to shift paradigms & start revolutions. We use digital engineering to build superhuman capabilities. We make sure that the rate of progress far exceeds the price. And right now, over 60,000 of us bright sparks are busy developing solutions for over 500 customers in 23 countries across the world. How can I help you? www.hcltech.com/Investors