Implication of 3D Mapping in EP
•Als PPTX, PDF herunterladen•
15 gefällt mir•5,218 views


Empfohlen
Weitere ähnliche Inhalte
Was ist angesagt?
Was ist angesagt? (20)
Ähnlich wie Implication of 3D Mapping in EP
Ähnlich wie Implication of 3D Mapping in EP (20)
Mehr von Taiwan Heart Rhythm Society
Mehr von Taiwan Heart Rhythm Society (20)
Kürzlich hochgeladen
Kürzlich hochgeladen (20)
Implication of 3D Mapping in EP
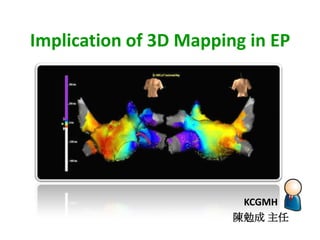
- 1. Implication of 3D Mapping in EP KCGMH 陳勉成 主任
- 3. Indications for Radiofrequency Catheter Ablation • Wolff-Parkinson-White Syndrome (WPW) • Atrioventricular Nodal Reentrant Tachycardia (AVNRT) • Atrial Flutter • Atrial Fibrillation (AF) • Ventricular Tachycardia (VT) • Atrial Tachycardia (AT) • Others
- 4. Sequence of the Flow in a Typical EP and Ablation Procedure • Preparation of the Patient • Insertion of sheaths and Electrode catheters • Basic EPS study to get the basic data • Induction of the Arrhythmia • Diagnosis of the Arrhythmia • Ablation of the Arrhythmia (if indicated) • Confirmation of Therapy Success
- 5. Classification of Tachycardia Tachycardia are classified as focal or macro reentrant tachycardia Focal tachycardia exhibit activation spreading from a single focus either radically, circularly or centrifugally without an electrical activation spanning the tachycardia cycle length (right atrial activation is considerably shorter than the tachycardia cycle length–about 14%) (Zipes DP, Jalife J. Cardiac Electrophysiology: From cell to bedside, 4th edition. 2004; pg. 500-501)
- 6. Classification of Tachycardia Macro reentrant tachycardia typical atrial flutter lower loop reentry, double loop reentry, left atrial macro reentrant tachycardia, scar-related AT, reverse typical atrial flutter and right atrial free wall macro reentry The various patterns are: Single loop (like typical atrial flutter) Figure of eight (made up of two loops) Reentry through narrow channels adjacent to scar, anatomic barriers (i.e. tricuspid annulus) (Zipes DP, Jalife J. Cardiac Electrophysiology: From cell to bedside, 4th edition. 2004; pg. 500-501)
- 7. Arrhythmia Mechanisms • Automaticity • Triggered Activity • Reentry
- 8. Everything should be made as simple as possible, but not simpler. by Albert Einstein
- 9. Map Concept Surface Temperature Animated Propagation Map
- 10. Color-coded Isochrones Anatomic Representation Activation Times
- 11. “Roving” catheters enable Endocardial isochronal maps Advantage - percutaneous procedure Disadvantage - takes a long time; requires a stable rhythm
- 13. 1993 - Isochronal meet 3-D graphics... maps meet 3-D graphics... ...Electro-anatomic mapping is born
- 14. 1995 – Epicardial “plaque” electrodes move endocardial... • Location of catheter electrodes, which enables – geometry creation – boundary-element calculations – navigation • Detection of cardiac electrical activity • Combined, these functions enable non-contact mapping ...Graydon Beatty conceives the Array, non-contact mapping, establishes Endocardial Solutions, Inc.
- 15. ≅ 15
- 16. ≅ 16
- 24. QuickTime™ and a H.264 decompressor are neede d to see this picture. 24
- 26. EnGuide location relative to E1 and E2
- 27. How Created the Geometry of Non Contact Map
- 29. One Beat to Analysis Virtual Unipolar Signal Analysis
- 30. Ablation Site and Confirm the Tracing Virtual If you are an operator, tell me, where you want to target ?
- 32. Successful to Complete line
- 33. Double Potentials • Double potentials are indicative of a line of block • Lines of block are either fixed or functional – Atriotomy sites and the Eustachian ridge are examples of fixed lines of block – Evidence exists that block in region of Cristal terminals during atrial flutter is a form of functional conduction block
- 38. Is True or False DSM ?
- 39. 2003 - Isochronal meet 3-D graphics... maps meet 3-D graphics... Contact Mapping is born
- 40. Contact Mapping Surface-based 5.6 kHz (Classic) /8.138KHz. (Velocity) current signals emitted from 3 pairs of surface electrodes Each catheter electrode located 93 times per second Simultaneously view up to 12 catheters and 64 electrodes All chamber navigation
- 41. Bipolar Signal and Multiple Catheters
- 42. • Realwith NavX Navigation Minimize fluoro Time
- 43. Create Geometry by any Roving Catheters LSPV RSPV RMPV LIPV LA RIPV RA CS IVC
- 45. Validation of Computed Tomography Image Integration into the EnSite NavX Mapping System to Perform Catheter Ablation of Atrial Fibrillation Journal of Cardiovascular Electrophysiology Volume 19, Issue 8, pages 821-827, 26 MAR 2008 DOI: 10.1111/j.1540-8167.2008.01127.x http://onlinelibrary.wiley.com/doi/10.1111/j.1540-8167.2008.01127.x/full#f1
- 46. Validation of Computed Tomography Image Integration into the EnSite NavX Mapping System to Perform Catheter Ablation of Atrial Fibrillation Journal of Cardiovascular Electrophysiology Volume 19, Issue 8, pages 821-827, 26 MAR 2008 DOI: 10.1111/j.1540-8167.2008.01127.x http://onlinelibrary.wiley.com/doi/10.1111/j.1540-8167.2008.01127.x/full#f1
- 47. No fluoroscopic Three Dimensional Mapping for Arrhythmia Ablation : Tool or Toy ? Methods We compared the results of 88 arrhythmia ablations (79 patients) using CARTO with 100 ablations (94 patients) using the conventional technique. The ablations were separated into four groups: AV nodal reentrant tachycardia (AVNRT) Atrial tachycardia/flutter ventricular tachycardia (VT) bypass tract tachycardia. J Cardiovasc Electrohysio, Vol. 11, pp.239-243,March 2000
- 48. No fluoroscopic Three Dimensional Mapping for Arrhythmia Ablation : Tool or Toy ? Result The ablation outcomes were excellent and comparable in all four types of the arrhythmias between the two techniques. Fluoroscopy time was shorter using the CARTO technique: 10 ± 7 versus 27 ± 15 minutes for AVNRT (P <0.01), 18 ± 17 versus 44 ± 23 minutes for atrial tachycardia and flutter (P < 0.01) 15 ± 12 versus 34 ± 31 minutes for VT (P < 0.05) 21 ± 14 versus 53 ± 32 minutes for by pass tract tachycardia (P < 0.01). Conclusion The electro anatomic three-dimensional mapping technique reduced fluoroscopy time J Cardiovasc Electrohysio, Vol. 11, pp.239-243,March 2000
- 49. 3D for you is …………..?
- 50. What do you see ?
- 51. Where is the face in this picture?
- 52. Do not worry about your difficulties in Mathematics. I can assure you mine are still greater. by Albert Einstein
- 53. THANK YOU FOR YOUR ATTENATION
Hinweis der Redaktion
- The array catheter has a 9 French inner lumen, over-thewiredesign, and a 110 cm usable length.Other catheter features include:• Soft, compliant pigtail tip to reduce trauma. The tip ismade of polyurethane and has a radiopaque marker.• Balloon inflation port to inflate and deflate the arrayballoon.• Hemostasis valve with a sideport for flushing thecatheter during use.• Positive gripping mechanism (PGM) to grip thecentral catheter shaft.• 96-pin connector that connects to the BOB.• Data module that includes the number, status, andexact location of each array electrode. Electrode datais unique for each catheter and is established duringmanufacture. The array is functional with up to eightdisabled electrodes.
- The EnSite System uses the chamber geometry to solve theinverse problem for Laplace’s equation at 64 locations onthe geometry surface. The process creates an isopotentialmap surface with more than 3000 virtual EGMs.• The Laplace equation states that if the voltages measuredon an outer boundary (endocardium) are known, voltageseverywhere inside the chamber can be calculated.− The potential field at any one electrode (pointshown) is influenced by electrical potentials fromthe entire endocardium, with the degree of influencediminishing as distance between the electrode andeach endocardial point increases.− The potential field created on the multielectrode array(MEA) surface depends on the shape of the MEA andendocardium as well as their locations relative to oneanother.• Using the known information about the MEA, chambergeometry, and position and distance of the MEA relativeto the endocardial surface, the EnSite System canconstruct endocardial EGMs (virtuals) from MEApotentials.
- R and Z values identify the position of the multielectrodearray (MEA) relative to the located electrode on a roving EPcatheter – called the Active EnGuide. These values serve ascoordinates for optimizing the position of the MEA within achamber.• The R value is the distance in millimeters from the activeelectrode to the center of the MEA.• The Z value is the distance in millimeters of the activeelectrode above or below the MEA equator. The Zvalue is negative if the active electrode is distal the MEAequator and positive if it is proximal to the MEA equator.Note: The R and Z values are displayed in the lower portionof the map. The Active EnGuide is setup at the start of a newstudy (see CheckWizard).
- The EnGuide catheter is a user-selected contact catheterused to collect location information, build the chambergeometry, and place anatomic and lesion markers. TheEnGuide locator displays the position of the EnGuidecatheter relative to the position of the E1 and E2 electrodes ofthe MEA.
- Virtual EGMs display the direction and velocity ofcardiac activation and confirm the site of earliest activation(arrhythmia origin) in the cardiac chamber.• Virtuals are mathematically constructed from voltagemeasurements and plotted as amplitude (verticalaxis) vs. time (horizontal axis). When positioned onthe isopotential map, virtuals verify map color duringdepolarization and are useful in characterizing anarrhythmia.• The tracking virtual is a virtual EGM that automaticallytravels to the most negative location on the map in stepwith the time cursor. The tracking virtual is the red iconwithin the white area of the map. The computed trackingvirtual EGM is displayed in the lower righthand cornerof the map.
- The EnSite System can be used with surface electrodepatches to navigate conventional EP catheters to criticalintracardiac sites, without using fluoroscopy. This techniqueis called contact mapping.Using the surface electrodes, the EnSite System:• Collects, records, and displays surface ECG andintracardiac EGM waveforms.• Locates and displays up to 64 EP catheter electrodes inthe cardiac chamber. The location information is usedto navigate EP catheters. It can also be used to createa chamber geometry and place anatomic labels, lesionmarkers, and EnGuide shadows.
- Contact mapping works by creating an electrical fieldbetween opposing pairs of surface patch electrodes to locateand display an EP catheter in 3D space.
- EnSiteNavX enables physicians to visualize and navigate a myriad of intracardiac catheters in any chamber of the heart. It also simultaneously displays more electrodes and catheters than any other 3-D mapping system currently available.EnSiteNavX is compatible with catheters from all manufacturers. The non-proprietary nature of our technology gives you freedom of choice for diagnostic and ablation catheters.
- Respiration Compensation helps minimize the effects ofrespiration during contact mapping studies. It may facilitatemore consistent geometry creation and lesion marking andimproves navigation stability while placing lesions.During Respiration Compensation, the cardiac mappingsystem:• Instructs the clinician to leave all catheters in relativelystable positions.• Collects the x-y-z coordinates of all electrodes andimpedance values of all surface electrodes over a tensecondsampling period.• Identifies respiration through the surface electrodes as agradual rise in intrathoracic impedance and correlates thisrise with a motion artifact on each electrode.• Monitors surface electrodes for the impedance pattern.When respiration occurs, navigation on each electrode iscompensated gradually, in correlation with the degree ofthe impedance change.The cardiac mapping system accommodates changes inrespiration during sampling. Respiration Compensationcan be recalculated any time and is recommended afteradding electrodes, significantly moving the catheter, or whenrespiration motion is still visible.
- Figure 3. The 3D lesions (actual lesion positions in 3D space) are shown in the upper panels and the surface lesions (projected onto the CT surface) are shown in the lower panels for a patient undergoing left atrial pulmonary vein (PV) circumferential ablation. Panels (A) and (E) show the lesion sets around both PV pairs, (B) and (F) around the left PVs, and (C) and (G) around the right PVs. Panels (D) and (H) show the same orientations as panels (C) and (G) but with the NavX geometry overlaid onto the CT (without any transparency). The close approximation of the NavX geometry and CT can be appreciated, as well as the relationship of the lesion rings to both. The circumferences of the 3D and surface lesion rings were calculated as described in the main text, and the values compared as a measure of accuracy of geometry/CT integration. A single catheter can be seen in the LA in panels (B) and (F).
- 少女與老婦人
- 這種現像在心理學上叫做“非注意盲視(inattential blindness)”,當你全神貫注於某一個問題時,往往會忽視另外一個顯而易見,或是平時會很引人注目的地方。圖中的12指男人是來自古巴的Yoandri Hernandez Garrido,他每個手都有6個手指,每隻腳也各有6個腳趾。