SlideShare ist ein Scribd-Unternehmen logo
1 von 13
inserttext and numericaldata � numbers� text
insertrow/column * �
delete row/column* �
amend text and numericaldata � numbers� text
use formulae and basic functions thatproducecorrectresults * �
replicate formulae (fill) �
recalculate data �
create graph(s)* �
selectdata set(s) * �
align text and numericaldata * �
formatnumericaldata * �
display rows and columns to show borders/shading �
enter graph and axes titles �
set axes upper & lower limits * �
display data labels �
use a legend �
ensurecomparative data is distinctive �
save and close spreadsheet �
set page layout �
insertheaders and footers �
print the spreadsheetwith data showing in full as a table * �
print the spreadsheetwith formulae showing in full and displaying
column and row headings * �
print graphson a sheetseparate to the data source *
Entering data using the keyboard
Most data entry in Calc can be accomplished using the keyboard.
Entering numbers
Click in the cell and type in the number using the number keys on
either the main keyboard or the numeric keypad.
To enter a negative number, either type a minus (–) sign in front of it or
enclose it in parentheses (brackets), like this: (1234).
By default, numbers are right-aligned and negative numbers have a
leading minus symbol.
Entering text
Click in the cell and type the text. Text is left-aligned by default.
Entering numbers as text
If a number is entered in the format 01481,Calc will drop the leading
0. (Exception:see Tip below.) To preserve the leading zero, for example
for telephone area codes,type an apostrophe before the number, like
this: '01481.
The data is now regarded as text by Calc. Formulas and functions will
treat the entry like any other text entry, which typically results in it
being a zero in a formula, and being ignored in a function.
Working with columns and rows
Inserting columns and rows
Columns and rows can be inserted individually or in groups, Single
column or row
Using the Insertmenu:
1) Selectthe column or rows where you want the new column or row
inserted.
2) Selecteither Insert> Columns or Insert> Rows.
Using the mouse:
1) Selectthe column or rows where you want the new column or row
inserted.
2) Right-click the header.
3) SelectInsertRows or InsertColumns.
Multiple columns or rows
Multiple columns or rows can be inserted at once rather than inserting
them one at a time.
1) Highlight the required number of columns or rows by holding
down the left mouse button on the first one and then dragging
across the required number of identifiers.
2) Proceed as forinserting a single column or row above.
Deleting columns and rows
Columns and rows can be deleted individually or in groups.
Single column or row
A single column or row can only be deleted by using the mouse:
1) Selectthe column or row to be deleted.
2) Right-click on the column or row header.
3) SelectDelete Columns or Delete Rows from the pop-up menu.
Multiple columns or rows
Multiple columns or rows can be deleted at once rather than deleting
them one at a time.
1) Highlight the required number of columns or rows by holding
down the left mouse button on the first one and then dragging
across the required number of identifiers.
2) Proceed as fordeleting a single column or row above.
Addition
The + sign is used for addition. To enter the + sign, press the Shift key and the +, ,key.
1. Click on A6.
2. Type the number 10, then press Enter. ("10" appears in "A6" and the active cell is "A7".)
3. Type the number 5, then press Enter. ("5" appears in "A7" and the active cell is "A8".)
4. Type =A6+A7 (Or click the “Function”, , icon. The “=” appears in “A8'. The “Function”,
, icon changes to the “Accept”, , icon. Then type "A6+A7".).
5. Press Enter (or click the “Accept”, , icon). The answer, 15, appears in A8.
Sum (Calculate TheTotalOf A Column)
1. In A1, type 5, press Enter.
2. In A2, type 5, press Enter,
3. In A3, type 5, press Enter,
4. In A4, type 5, press Enter
5. In A5, type 5, press Enter.
6. Click In A6, the last cell in the column of numbers you want to add. ("A6" has a
heavy dark border and is the "Active Cell." )
7. Click on the Sum, Σ, ("Σ" is the mathematics symbol for sum.) icon on the Formula
Toolbar just left of the Input Line The Function, , icon changes to the Accept, , icon.
8. Click the Accept, , icon (green check mark) or press Enter. The formula,
=SUM(A1:A5), appears in the A6 cell.
9. Press Enter. The sum, 25, will appear in A6. A7 becomes the active cell.
Cell Range
In the section above, the SUM function appears as =SUM(A1:A5). The A1:A5 in the
parenthesis is called a Cell Range. It is shorthand for "from A1 to A5".
Subtraction
The - sign is used for subtraction. To enter the – sign, press the key.
1. Click on A8. To clear cell A8, press the Delete key. (The “Delete Contents”
window appears.) Check the Delete all box and click OK.
2. Type =A6-A7 (Or click the “Function”, , icon. The “=” appears in “A8" The “Function”,
, icon changes to the “Accept”, , icon. Then type "A6-A7".).
3. Press Enter (Or click the “Accept”, , icon.) The answer, 20, appears in A8.
Multiplication
The star ,*, sign is used for multiplication. To enter the * sign, press the Shift key and the
number 8 key.
1. Click on A8. To clear cell A8, press the Delete key. (The “Delete Contents”
window appears.) Check the Delete all box and click OK.
2. Type =A6*A7 (Or click the “Function”, , icon. The “=” appears in “A8”. The
“Function”, , icon changes to the “Accept”, , icon. Then type "A6*A7").
3. Press Enter (Or click the “Accept”, , icon.) The answer, 125, appears in A8.
Division
The slash, /, sign is used for division. To enter the slash, /, sign, press the key [? And /].
1. Click on A8. To clear cell A8, press the Delete key. (The “Delete Contents”
window appears.) Check the Delete all box and click OK.
2. Type =A6/A7 (Or click the “Function”, , icon. The “=” appears in “A8'. The “Function”,
, icon changes to the “Accept”, , icon. Then type "A6/A7".).
3. Press Enter (Or click the “Accept”, , icon.) The answer, 5, appears in A8.
Average
1. Click on A7, type =Average(A1:A6), press Enter. (8.33 appears in A7 and 3 now
appears in A8)
Enter Formulas
When you type in formulas, the order of operations must be correct. The correct order
is: exponentiation, multiplication, division, addition, then subtraction. Let's pretend we
want to perform a calculation using the equation:
1. Click on B1.
2. Type 2 in B1 and press Tab. (Cell C1 becomes active)
3. Type 4 in C1 and press Tab. (Cell D1 becomes active)
4. In D1 type the formula =B1+10/C1 + 20. (Or click the “Function” icon which
changes to the “Accept”, , icon. Type "B1+10/C1+20").
5. Press Enter (Or click the “Accept”, , icon. The answer, 24.5, appears in D1.)
The answer is wrong, it should be 1, using x = 20 and y = 10, but we got 41 for an
answer! Why? Because Calc interpreted the equation as:
20 + (10/10) + 20
which equals 41. If you use formulas with equations in the numerator and denominator, you need
to use parenthesis () to force the spreadsheet to calculate them properly. Make the following
changes:
1. Click on C1.
2. Click on the Input Line.
3. Edit the formula to read =(A1+10)/(B1+20). (Click just before the A, then Press
the ( key [Shift-9]. Click after the 0 in 10, then press the ) key [Shift-0]. Click just
before the B, then Press the ( key [Shift-9]. Click after the 0 in 20, then press the
) key [Shift-0]).
4. Click the Accept, , icon (green check mark.) The correct answer, 1, appears in
C1.
Copy Formulas
You can copy a formula so that the formula itself is copied OR that the answer to the formula is
copied.
Copy The Formula Itself
1. Select (click on) the cell(s) that is to be copied.
2. Right-click, then click Copy. (The material is copied to the clipboard)
3. Select (click on) the cell where the material is to appear.
4. Right-click, then click Paste.
Copy The Answer of a Formula
1. Select (click on) the cell(s) that has a formula.
2. Right-click, then click Copy. (The material is copied to the clipboard)
3. Select (click on) the cell where the material is to appear.
4. Right-click, then click Paste Special. (The “Paste Special” window appears)
5. Remove the check mark at Paste all.
6. Remove the check mark at Formulas and add a check mark at Numbers. Click OK.
Exponentiation
The number 102 is written as 10^2. To enter the ^ sign, press the Shift key and the
number 6, , key.
1. Click on A9.
2. Type =A6^A7 (Or click the “Function”, , icon. The “=” appears in "A9". The
“Function”, , icon changes to the “Accept”, , icon. Then type "A6^A7".).
3. Press Enter (Or click the “Accept”, , icon.) The answer, 100000, appears in A8.
Data Relationship
The first thing you need is data that shows a relationship. Examples include mathematical
functions, stock market prices over time, rainfall over time, statistical divisions of a population,
or divisions of an income that make up a budget. Since math is something that anyone can
duplicate, we'll use the sine function:
1. Go to the bottom of your workbook and click on Sheet2.
2. Type X in A1.
3. Type Sine(X) in B1.
4. Enter 0 in A2. (That's a zero. Click anywhere on the Spreadsheet to unselect
“A2” after entering the “0”.)
5. Select A2. (Click on A2 again to select it.) Drag-copy A2 down until you see the tool
tip number read 90. (Put the cursor over the box at the bottom right corner of
"A2". When you see a , click on it and drag it down until you see the tool tip
number read 90 then release the click. The numbers will increase by 1 for every
line you drag over.) (The number 90 will be in cell A92)
6. Go back to the top and Select B2. (Ctrl+up arrow is a quick way to move up.)
7. Enter =SIN(A2).
8. Click on the bottom right corner of the B2 cell. (The "B2" cell contents change from the
formula "=SIN(A2)" into a "0".) Drag-copy the formula all the way down to the 90 in the
A column.
Don't worry if you don't know what the numbers mean; we aren't concerned with that. The order
of the columns matters. Spreadsheet programs typically assume that the column on the left is the
variable that is plotted on the horizontal (x) axis of the chart, and the column on the right is the
variable that is plotted on the vertical (y) axis.
Insert Chart
1. Select columns A and B.
2. Click the Insert Chart, , icon on the Function Toolbar. (The pointer changes to.
Click anywhere on the spreadsheet. Or Click Insert > Chart... The "AutoFormat
Chart" window appears.)
3. Select -New Sheet- from the drop-down box labeled Chart results in
worksheet.
4. Click Next>>>.
5. Select XY Chart. (Hold the cursor over the icons to find it.)
6. Click Next>>>.
7. Select Lines Only and check the X axis and Y axis grid line boxes. ("Y" may
already be checked. Don't uncheck it.)
8. Click Next>>>.
9. Give the chart a title, My First Chart, in the box that has Main Title in it.
(Replace text.)
10. Click the X axis and Y axis check boxes.
11. Type X for X axis title, and Sine(x) for Y axis title. (Replace existing text.)
12. Click Create.
13. Look at the worksheet tabs at the bottom.
14. Click on the last tab. (Probably labeled Sheet4.)
15. Use the little boxes on the corners to resize the chart by clicking on them and
dragging them until you like the proportions.
Appearance Of Chart
Charts created by spreadsheet programs are unappealing most of the time. You have to mess with
the format of the chart elements to make them look better.
The first thing I notice is a jagged plot line. That is appropriate for some data, but the sine
function is a smooth function, so make the following changes:
1. Double-click somewhere on the chart if you see green boxes or no boxes.
2. Click Format > Chart Type...
3. Select Cubic Spline, , from the Variants box at the bottom.
4. Click OK.
That's better, but it could still use some improvement. Try:
1. Click Format > Chart Wall.
2. Click the Area tab. In the dialog box below Fill, click the and select None. Click OK.
3. Place the cursor over the data plot line and double-click. (The smooth Purple line.)
4. Click the Line tab. In the Color dialog box, change the color to Sea Blue.
5. In the Width dialog box, change the width to .02. (Click the repeatedly or
highlight the number in the dialog box and type ”.02”.) Click OK.
6. Select Format > Grid > All Axis Grids...
7. Change the Color to Gray 40%. (You have to scroll down the palette.) Click OK.
8. The chart still seems busy. Select Format > Axis > X Axis. Click the Scale tab.
9. Clear the Maximum check box and replace 90 with 45. Click OK.
10. Change the main title text to Sine Function by double-clicking on it and editing it.
11. When you are done, click somewhere else on the chart to accept the changes.
12. Click on a worksheet cell. Click Format > Sheet > Rename. (The “Rename
Sheet” window appears.) Rename the sheet, Sine Graph.
13. Save your work. (Click “File > Save”.)
Page Preview Toolbar
The Page Preview Toolbar allows you to see what Calc is going to print.
1. Bring up the Checking worksheet. (Use the at the bottom left of your spreadsheet.)
2. Click File > Page Preview. (The Page Preview toolbar appears.)
1. If you look on the left end of the Page Preview Toolbar (the third toolbar), you will see
four book icons with arrows. These let you view each page that would go to the printer.
 The Previous Page icon is first book icon.
 The Next Page icon is the second book icon.
 The First Page icon is the third book icon.
 The Last Page icon is the fourth book icon.
2. Click on the other icons on the Page Preview Toolbar to see their functions.
3. Click Close Preview.
Headers And Footers
When printed, all pages will have a Header and a Footer on them. The header shows the name of
the sheet. The footer shows the page number. All the pages have them. Here's how you can turn
them off or edit them:
1. Click Page Format on the toolbar. (The "Page Style: Default" window appears.
2. Click the Header tab.
You can turn them off by unchecking the Header check box. You can also format the margins
and spacing.
To edit the header, click Edit... (The "Header (Page Style: Default)" window appears.)
Headers and Footers are broken into three sections. You can use one of the auto-format buttons
below the three boxes or type your own header.
1. Click Cancel. (The "Header (Page Style: Default)" window closes.)
2. Uncheck the Header box. Look through the other tabs.
3. Click OK. (The "Page Style: Default" window closes.)
The same procedures apply to the footer, so I won't elaborate on that. The Sheet tab gives you
the capability to control the way Calc determines the page order and what features to print or
scale. The remaining tabs are self-explanatory.
Note: Removing the header and footer will change the chart size, so you may have to resize it.
Print Ranges
What if you don't want to print the whole worksheet? I'm glad you asked! Calc gives you the
ability to define print ranges.
1. Bring up the Checking worksheet.
2. Select A1:G25. (Click "A1". Drag copy to "G1".)
3. Click Format > Print Ranges > Define.
4. Open the Page Preview again.
Now you only have one page. Unfortunately, there is not an equivalent for charts. The only way
you can print a chart only is:
1. Click File > Print...
2. Click the Pages radio button on the bottom left.
3. Type in the page number of the worksheet the chart is on.

Weitere ähnliche Inhalte

Was ist angesagt?

calc lecture
calc lecturecalc lecture
calc lecture
Jelz JZ
 
02 microsoft office (entering formulas)
02 microsoft office (entering formulas)02 microsoft office (entering formulas)
02 microsoft office (entering formulas)
benchhood
 
Excel Powerpoint class with video
Excel Powerpoint class with videoExcel Powerpoint class with video
Excel Powerpoint class with video
Rich Johnson
 
Word excel
Word excelWord excel
Word excel
jjsn04
 
Open Office Impress : Lesson 08
Open Office Impress : Lesson 08Open Office Impress : Lesson 08
Open Office Impress : Lesson 08
thinkict
 

Was ist angesagt? (17)

MS EXCEL PPT PRESENTATION
MS EXCEL PPT PRESENTATIONMS EXCEL PPT PRESENTATION
MS EXCEL PPT PRESENTATION
 
22 Excel Basics
22 Excel Basics22 Excel Basics
22 Excel Basics
 
microsoft ecexl
microsoft ecexlmicrosoft ecexl
microsoft ecexl
 
Performing basic computation (Microsoft Excel)
Performing basic computation (Microsoft Excel)Performing basic computation (Microsoft Excel)
Performing basic computation (Microsoft Excel)
 
calc lecture
calc lecturecalc lecture
calc lecture
 
Sage Intelligence 40 Microsoft Excel Tips and Tricks
Sage Intelligence 40 Microsoft Excel Tips and TricksSage Intelligence 40 Microsoft Excel Tips and Tricks
Sage Intelligence 40 Microsoft Excel Tips and Tricks
 
Ms excel excersices
Ms excel excersicesMs excel excersices
Ms excel excersices
 
Using Microsoft Excel2 Calculations
Using Microsoft Excel2 CalculationsUsing Microsoft Excel2 Calculations
Using Microsoft Excel2 Calculations
 
02 microsoft office (entering formulas)
02 microsoft office (entering formulas)02 microsoft office (entering formulas)
02 microsoft office (entering formulas)
 
Microsoft Office: Practice Questions
Microsoft Office: Practice Questions Microsoft Office: Practice Questions
Microsoft Office: Practice Questions
 
Excel Powerpoint class with video
Excel Powerpoint class with videoExcel Powerpoint class with video
Excel Powerpoint class with video
 
Creating Formulas in Excel
Creating Formulas in ExcelCreating Formulas in Excel
Creating Formulas in Excel
 
Word excel
Word excelWord excel
Word excel
 
Open Office Impress : Lesson 08
Open Office Impress : Lesson 08Open Office Impress : Lesson 08
Open Office Impress : Lesson 08
 
Microsoft excel 2010 useful formula & functions
Microsoft excel 2010   useful formula & functionsMicrosoft excel 2010   useful formula & functions
Microsoft excel 2010 useful formula & functions
 
Microsoft Excel 2007 Tutorial
Microsoft Excel 2007 TutorialMicrosoft Excel 2007 Tutorial
Microsoft Excel 2007 Tutorial
 
Libre Office Calc Lesson 2: Formatting and Charts
Libre Office Calc Lesson 2: Formatting and ChartsLibre Office Calc Lesson 2: Formatting and Charts
Libre Office Calc Lesson 2: Formatting and Charts
 

Ähnlich wie Open Office Calc : Level 1

Open Office Calc : Level1
 Open Office Calc : Level1 Open Office Calc : Level1
Open Office Calc : Level1
thinkict
 
Introduction to Excel
Introduction to ExcelIntroduction to Excel
Introduction to Excel
Najma Alam
 
PAGE 1Using Microsoft Excel 2010 for Selected Tasks(Thr.docx
PAGE  1Using Microsoft Excel 2010 for Selected Tasks(Thr.docxPAGE  1Using Microsoft Excel 2010 for Selected Tasks(Thr.docx
PAGE 1Using Microsoft Excel 2010 for Selected Tasks(Thr.docx
alfred4lewis58146
 
Spreadsheets Introduction using RM Number Magic
Spreadsheets Introduction using RM Number MagicSpreadsheets Introduction using RM Number Magic
Spreadsheets Introduction using RM Number Magic
Malcolm Wilson
 
Jsk industries private limited,excel presentation
Jsk industries private limited,excel presentationJsk industries private limited,excel presentation
Jsk industries private limited,excel presentation
vimeshpandya
 
Sample Training Ppt Excel Basics
Sample Training Ppt Excel BasicsSample Training Ppt Excel Basics
Sample Training Ppt Excel Basics
AudreyMc
 
Excel for beginners class 3
Excel for beginners class 3Excel for beginners class 3
Excel for beginners class 3
Nicholas Charles
 

Ähnlich wie Open Office Calc : Level 1 (20)

Open Office Calc : Level1
 Open Office Calc : Level1 Open Office Calc : Level1
Open Office Calc : Level1
 
Introduction to Excel
Introduction to ExcelIntroduction to Excel
Introduction to Excel
 
excell.pdf
excell.pdfexcell.pdf
excell.pdf
 
WPS Entering Data
WPS Entering DataWPS Entering Data
WPS Entering Data
 
75 tips and_tricks_excel_reduced
75 tips and_tricks_excel_reduced75 tips and_tricks_excel_reduced
75 tips and_tricks_excel_reduced
 
Microsoft 2007 Basics
Microsoft 2007 BasicsMicrosoft 2007 Basics
Microsoft 2007 Basics
 
PAGE 1Using Microsoft Excel 2010 for Selected Tasks(Thr.docx
PAGE  1Using Microsoft Excel 2010 for Selected Tasks(Thr.docxPAGE  1Using Microsoft Excel 2010 for Selected Tasks(Thr.docx
PAGE 1Using Microsoft Excel 2010 for Selected Tasks(Thr.docx
 
How to use a spreadsheet
How to use a spreadsheetHow to use a spreadsheet
How to use a spreadsheet
 
Spreadsheets Introduction using RM Number Magic
Spreadsheets Introduction using RM Number MagicSpreadsheets Introduction using RM Number Magic
Spreadsheets Introduction using RM Number Magic
 
Excel Tutorial
Excel TutorialExcel Tutorial
Excel Tutorial
 
Jsk industries private limited,excel presentation
Jsk industries private limited,excel presentationJsk industries private limited,excel presentation
Jsk industries private limited,excel presentation
 
kiromax.ppt
kiromax.pptkiromax.ppt
kiromax.ppt
 
22-excel-basics-15511.ppt
22-excel-basics-15511.ppt22-excel-basics-15511.ppt
22-excel-basics-15511.ppt
 
Sample Training Ppt Excel Basics
Sample Training Ppt Excel BasicsSample Training Ppt Excel Basics
Sample Training Ppt Excel Basics
 
PPT On Microsoft Excel 2007 Full Information.
PPT On Microsoft Excel 2007 Full Information.PPT On Microsoft Excel 2007 Full Information.
PPT On Microsoft Excel 2007 Full Information.
 
M.S EXCEL
M.S EXCELM.S EXCEL
M.S EXCEL
 
Easy Pivot Tutorial June 2020
Easy Pivot Tutorial June 2020Easy Pivot Tutorial June 2020
Easy Pivot Tutorial June 2020
 
Excel for beginners class 3
Excel for beginners class 3Excel for beginners class 3
Excel for beginners class 3
 
101 Bloggers Bookkeeping
101 Bloggers Bookkeeping101 Bloggers Bookkeeping
101 Bloggers Bookkeeping
 
Excel
ExcelExcel
Excel
 

Mehr von thinkict

Photostory
PhotostoryPhotostory
Photostory
thinkict
 
Text Writer
Text WriterText Writer
Text Writer
thinkict
 
Open Office Writer : Level2
Open Office Writer : Level2 Open Office Writer : Level2
Open Office Writer : Level2
thinkict
 
Open Office Writer : Level1
Open Office Writer : Level1 Open Office Writer : Level1
Open Office Writer : Level1
thinkict
 
Open Office Writer : Lesson 03
Open Office Writer : Lesson 03Open Office Writer : Lesson 03
Open Office Writer : Lesson 03
thinkict
 
Open office Writer : Lesson 02
Open office Writer : Lesson 02Open office Writer : Lesson 02
Open office Writer : Lesson 02
thinkict
 
Marking Grid_Web Communications
Marking Grid_Web CommunicationsMarking Grid_Web Communications
Marking Grid_Web Communications
thinkict
 
Marking Grid_Computer Operations
Marking Grid_Computer OperationsMarking Grid_Computer Operations
Marking Grid_Computer Operations
thinkict
 
Marking Grid_AlphaTech
Marking Grid_AlphaTechMarking Grid_AlphaTech
Marking Grid_AlphaTech
thinkict
 
Web Communications Brochure
Web Communications BrochureWeb Communications Brochure
Web Communications Brochure
thinkict
 
Internet Operations Brochure
Internet Operations BrochureInternet Operations Brochure
Internet Operations Brochure
thinkict
 
Computer Operations Brochure
Computer Operations BrochureComputer Operations Brochure
Computer Operations Brochure
thinkict
 
AlphaTech Brochure
AlphaTech BrochureAlphaTech Brochure
AlphaTech Brochure
thinkict
 
Internet Operations
Internet OperationsInternet Operations
Internet Operations
thinkict
 
Computer Operations
Computer OperationsComputer Operations
Computer Operations
thinkict
 
Alphatech 2011-12
Alphatech 2011-12Alphatech 2011-12
Alphatech 2011-12
thinkict
 
Plagiarism teacher demo_intermediate
Plagiarism teacher demo_intermediatePlagiarism teacher demo_intermediate
Plagiarism teacher demo_intermediate
thinkict
 
Action Plan _ Digital Story Telling
Action Plan _ Digital Story TellingAction Plan _ Digital Story Telling
Action Plan _ Digital Story Telling
thinkict
 
4 action plan
4 action plan4 action plan
4 action plan
thinkict
 
Wlmm stepby step
Wlmm stepby stepWlmm stepby step
Wlmm stepby step
thinkict
 

Mehr von thinkict (20)

Photostory
PhotostoryPhotostory
Photostory
 
Text Writer
Text WriterText Writer
Text Writer
 
Open Office Writer : Level2
Open Office Writer : Level2 Open Office Writer : Level2
Open Office Writer : Level2
 
Open Office Writer : Level1
Open Office Writer : Level1 Open Office Writer : Level1
Open Office Writer : Level1
 
Open Office Writer : Lesson 03
Open Office Writer : Lesson 03Open Office Writer : Lesson 03
Open Office Writer : Lesson 03
 
Open office Writer : Lesson 02
Open office Writer : Lesson 02Open office Writer : Lesson 02
Open office Writer : Lesson 02
 
Marking Grid_Web Communications
Marking Grid_Web CommunicationsMarking Grid_Web Communications
Marking Grid_Web Communications
 
Marking Grid_Computer Operations
Marking Grid_Computer OperationsMarking Grid_Computer Operations
Marking Grid_Computer Operations
 
Marking Grid_AlphaTech
Marking Grid_AlphaTechMarking Grid_AlphaTech
Marking Grid_AlphaTech
 
Web Communications Brochure
Web Communications BrochureWeb Communications Brochure
Web Communications Brochure
 
Internet Operations Brochure
Internet Operations BrochureInternet Operations Brochure
Internet Operations Brochure
 
Computer Operations Brochure
Computer Operations BrochureComputer Operations Brochure
Computer Operations Brochure
 
AlphaTech Brochure
AlphaTech BrochureAlphaTech Brochure
AlphaTech Brochure
 
Internet Operations
Internet OperationsInternet Operations
Internet Operations
 
Computer Operations
Computer OperationsComputer Operations
Computer Operations
 
Alphatech 2011-12
Alphatech 2011-12Alphatech 2011-12
Alphatech 2011-12
 
Plagiarism teacher demo_intermediate
Plagiarism teacher demo_intermediatePlagiarism teacher demo_intermediate
Plagiarism teacher demo_intermediate
 
Action Plan _ Digital Story Telling
Action Plan _ Digital Story TellingAction Plan _ Digital Story Telling
Action Plan _ Digital Story Telling
 
4 action plan
4 action plan4 action plan
4 action plan
 
Wlmm stepby step
Wlmm stepby stepWlmm stepby step
Wlmm stepby step
 

Kürzlich hochgeladen

Beyond the EU: DORA and NIS 2 Directive's Global Impact
Beyond the EU: DORA and NIS 2 Directive's Global ImpactBeyond the EU: DORA and NIS 2 Directive's Global Impact
Beyond the EU: DORA and NIS 2 Directive's Global Impact
PECB
 
An Overview of Mutual Funds Bcom Project.pdf
An Overview of Mutual Funds Bcom Project.pdfAn Overview of Mutual Funds Bcom Project.pdf
An Overview of Mutual Funds Bcom Project.pdf
SanaAli374401
 
1029-Danh muc Sach Giao Khoa khoi 6.pdf
1029-Danh muc Sach Giao Khoa khoi  6.pdf1029-Danh muc Sach Giao Khoa khoi  6.pdf
1029-Danh muc Sach Giao Khoa khoi 6.pdf
QucHHunhnh
 

Kürzlich hochgeladen (20)

Unit-IV; Professional Sales Representative (PSR).pptx
Unit-IV; Professional Sales Representative (PSR).pptxUnit-IV; Professional Sales Representative (PSR).pptx
Unit-IV; Professional Sales Representative (PSR).pptx
 
Introduction to Nonprofit Accounting: The Basics
Introduction to Nonprofit Accounting: The BasicsIntroduction to Nonprofit Accounting: The Basics
Introduction to Nonprofit Accounting: The Basics
 
Mattingly "AI & Prompt Design: Structured Data, Assistants, & RAG"
Mattingly "AI & Prompt Design: Structured Data, Assistants, & RAG"Mattingly "AI & Prompt Design: Structured Data, Assistants, & RAG"
Mattingly "AI & Prompt Design: Structured Data, Assistants, & RAG"
 
SECOND SEMESTER TOPIC COVERAGE SY 2023-2024 Trends, Networks, and Critical Th...
SECOND SEMESTER TOPIC COVERAGE SY 2023-2024 Trends, Networks, and Critical Th...SECOND SEMESTER TOPIC COVERAGE SY 2023-2024 Trends, Networks, and Critical Th...
SECOND SEMESTER TOPIC COVERAGE SY 2023-2024 Trends, Networks, and Critical Th...
 
Grant Readiness 101 TechSoup and Remy Consulting
Grant Readiness 101 TechSoup and Remy ConsultingGrant Readiness 101 TechSoup and Remy Consulting
Grant Readiness 101 TechSoup and Remy Consulting
 
Web & Social Media Analytics Previous Year Question Paper.pdf
Web & Social Media Analytics Previous Year Question Paper.pdfWeb & Social Media Analytics Previous Year Question Paper.pdf
Web & Social Media Analytics Previous Year Question Paper.pdf
 
Ecological Succession. ( ECOSYSTEM, B. Pharmacy, 1st Year, Sem-II, Environmen...
Ecological Succession. ( ECOSYSTEM, B. Pharmacy, 1st Year, Sem-II, Environmen...Ecological Succession. ( ECOSYSTEM, B. Pharmacy, 1st Year, Sem-II, Environmen...
Ecological Succession. ( ECOSYSTEM, B. Pharmacy, 1st Year, Sem-II, Environmen...
 
Accessible design: Minimum effort, maximum impact
Accessible design: Minimum effort, maximum impactAccessible design: Minimum effort, maximum impact
Accessible design: Minimum effort, maximum impact
 
Beyond the EU: DORA and NIS 2 Directive's Global Impact
Beyond the EU: DORA and NIS 2 Directive's Global ImpactBeyond the EU: DORA and NIS 2 Directive's Global Impact
Beyond the EU: DORA and NIS 2 Directive's Global Impact
 
Advanced Views - Calendar View in Odoo 17
Advanced Views - Calendar View in Odoo 17Advanced Views - Calendar View in Odoo 17
Advanced Views - Calendar View in Odoo 17
 
How to Give a Domain for a Field in Odoo 17
How to Give a Domain for a Field in Odoo 17How to Give a Domain for a Field in Odoo 17
How to Give a Domain for a Field in Odoo 17
 
APM Welcome, APM North West Network Conference, Synergies Across Sectors
APM Welcome, APM North West Network Conference, Synergies Across SectorsAPM Welcome, APM North West Network Conference, Synergies Across Sectors
APM Welcome, APM North West Network Conference, Synergies Across Sectors
 
ICT Role in 21st Century Education & its Challenges.pptx
ICT Role in 21st Century Education & its Challenges.pptxICT Role in 21st Century Education & its Challenges.pptx
ICT Role in 21st Century Education & its Challenges.pptx
 
INDIA QUIZ 2024 RLAC DELHI UNIVERSITY.pptx
INDIA QUIZ 2024 RLAC DELHI UNIVERSITY.pptxINDIA QUIZ 2024 RLAC DELHI UNIVERSITY.pptx
INDIA QUIZ 2024 RLAC DELHI UNIVERSITY.pptx
 
Measures of Dispersion and Variability: Range, QD, AD and SD
Measures of Dispersion and Variability: Range, QD, AD and SDMeasures of Dispersion and Variability: Range, QD, AD and SD
Measures of Dispersion and Variability: Range, QD, AD and SD
 
An Overview of Mutual Funds Bcom Project.pdf
An Overview of Mutual Funds Bcom Project.pdfAn Overview of Mutual Funds Bcom Project.pdf
An Overview of Mutual Funds Bcom Project.pdf
 
1029-Danh muc Sach Giao Khoa khoi 6.pdf
1029-Danh muc Sach Giao Khoa khoi  6.pdf1029-Danh muc Sach Giao Khoa khoi  6.pdf
1029-Danh muc Sach Giao Khoa khoi 6.pdf
 
SOCIAL AND HISTORICAL CONTEXT - LFTVD.pptx
SOCIAL AND HISTORICAL CONTEXT - LFTVD.pptxSOCIAL AND HISTORICAL CONTEXT - LFTVD.pptx
SOCIAL AND HISTORICAL CONTEXT - LFTVD.pptx
 
Presentation by Andreas Schleicher Tackling the School Absenteeism Crisis 30 ...
Presentation by Andreas Schleicher Tackling the School Absenteeism Crisis 30 ...Presentation by Andreas Schleicher Tackling the School Absenteeism Crisis 30 ...
Presentation by Andreas Schleicher Tackling the School Absenteeism Crisis 30 ...
 
Application orientated numerical on hev.ppt
Application orientated numerical on hev.pptApplication orientated numerical on hev.ppt
Application orientated numerical on hev.ppt
 

Open Office Calc : Level 1

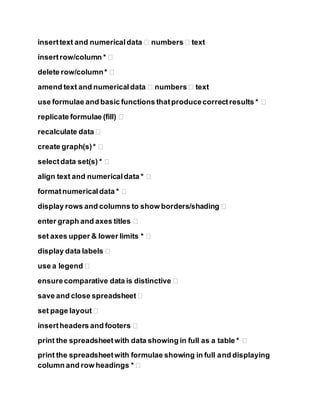
  • 1. inserttext and numericaldata � numbers� text insertrow/column * � delete row/column* � amend text and numericaldata � numbers� text use formulae and basic functions thatproducecorrectresults * � replicate formulae (fill) � recalculate data � create graph(s)* � selectdata set(s) * � align text and numericaldata * � formatnumericaldata * � display rows and columns to show borders/shading � enter graph and axes titles � set axes upper & lower limits * � display data labels � use a legend � ensurecomparative data is distinctive � save and close spreadsheet � set page layout � insertheaders and footers � print the spreadsheetwith data showing in full as a table * � print the spreadsheetwith formulae showing in full and displaying column and row headings * �
  • 2. print graphson a sheetseparate to the data source *
  • 3. Entering data using the keyboard Most data entry in Calc can be accomplished using the keyboard. Entering numbers Click in the cell and type in the number using the number keys on either the main keyboard or the numeric keypad. To enter a negative number, either type a minus (–) sign in front of it or enclose it in parentheses (brackets), like this: (1234). By default, numbers are right-aligned and negative numbers have a leading minus symbol. Entering text Click in the cell and type the text. Text is left-aligned by default. Entering numbers as text If a number is entered in the format 01481,Calc will drop the leading 0. (Exception:see Tip below.) To preserve the leading zero, for example for telephone area codes,type an apostrophe before the number, like this: '01481. The data is now regarded as text by Calc. Formulas and functions will treat the entry like any other text entry, which typically results in it being a zero in a formula, and being ignored in a function. Working with columns and rows Inserting columns and rows Columns and rows can be inserted individually or in groups, Single column or row Using the Insertmenu: 1) Selectthe column or rows where you want the new column or row inserted. 2) Selecteither Insert> Columns or Insert> Rows. Using the mouse: 1) Selectthe column or rows where you want the new column or row inserted. 2) Right-click the header. 3) SelectInsertRows or InsertColumns. Multiple columns or rows Multiple columns or rows can be inserted at once rather than inserting them one at a time.
  • 4. 1) Highlight the required number of columns or rows by holding down the left mouse button on the first one and then dragging across the required number of identifiers. 2) Proceed as forinserting a single column or row above. Deleting columns and rows Columns and rows can be deleted individually or in groups. Single column or row A single column or row can only be deleted by using the mouse: 1) Selectthe column or row to be deleted. 2) Right-click on the column or row header. 3) SelectDelete Columns or Delete Rows from the pop-up menu. Multiple columns or rows Multiple columns or rows can be deleted at once rather than deleting them one at a time. 1) Highlight the required number of columns or rows by holding down the left mouse button on the first one and then dragging across the required number of identifiers. 2) Proceed as fordeleting a single column or row above. Addition The + sign is used for addition. To enter the + sign, press the Shift key and the +, ,key. 1. Click on A6. 2. Type the number 10, then press Enter. ("10" appears in "A6" and the active cell is "A7".) 3. Type the number 5, then press Enter. ("5" appears in "A7" and the active cell is "A8".) 4. Type =A6+A7 (Or click the “Function”, , icon. The “=” appears in “A8'. The “Function”, , icon changes to the “Accept”, , icon. Then type "A6+A7".). 5. Press Enter (or click the “Accept”, , icon). The answer, 15, appears in A8. Sum (Calculate TheTotalOf A Column) 1. In A1, type 5, press Enter. 2. In A2, type 5, press Enter, 3. In A3, type 5, press Enter, 4. In A4, type 5, press Enter
  • 5. 5. In A5, type 5, press Enter. 6. Click In A6, the last cell in the column of numbers you want to add. ("A6" has a heavy dark border and is the "Active Cell." ) 7. Click on the Sum, Σ, ("Σ" is the mathematics symbol for sum.) icon on the Formula Toolbar just left of the Input Line The Function, , icon changes to the Accept, , icon. 8. Click the Accept, , icon (green check mark) or press Enter. The formula, =SUM(A1:A5), appears in the A6 cell. 9. Press Enter. The sum, 25, will appear in A6. A7 becomes the active cell. Cell Range In the section above, the SUM function appears as =SUM(A1:A5). The A1:A5 in the parenthesis is called a Cell Range. It is shorthand for "from A1 to A5". Subtraction The - sign is used for subtraction. To enter the – sign, press the key. 1. Click on A8. To clear cell A8, press the Delete key. (The “Delete Contents” window appears.) Check the Delete all box and click OK. 2. Type =A6-A7 (Or click the “Function”, , icon. The “=” appears in “A8" The “Function”, , icon changes to the “Accept”, , icon. Then type "A6-A7".). 3. Press Enter (Or click the “Accept”, , icon.) The answer, 20, appears in A8. Multiplication The star ,*, sign is used for multiplication. To enter the * sign, press the Shift key and the number 8 key. 1. Click on A8. To clear cell A8, press the Delete key. (The “Delete Contents” window appears.) Check the Delete all box and click OK. 2. Type =A6*A7 (Or click the “Function”, , icon. The “=” appears in “A8”. The “Function”, , icon changes to the “Accept”, , icon. Then type "A6*A7"). 3. Press Enter (Or click the “Accept”, , icon.) The answer, 125, appears in A8. Division The slash, /, sign is used for division. To enter the slash, /, sign, press the key [? And /]. 1. Click on A8. To clear cell A8, press the Delete key. (The “Delete Contents” window appears.) Check the Delete all box and click OK.
  • 6. 2. Type =A6/A7 (Or click the “Function”, , icon. The “=” appears in “A8'. The “Function”, , icon changes to the “Accept”, , icon. Then type "A6/A7".). 3. Press Enter (Or click the “Accept”, , icon.) The answer, 5, appears in A8. Average 1. Click on A7, type =Average(A1:A6), press Enter. (8.33 appears in A7 and 3 now appears in A8) Enter Formulas When you type in formulas, the order of operations must be correct. The correct order is: exponentiation, multiplication, division, addition, then subtraction. Let's pretend we want to perform a calculation using the equation: 1. Click on B1. 2. Type 2 in B1 and press Tab. (Cell C1 becomes active) 3. Type 4 in C1 and press Tab. (Cell D1 becomes active) 4. In D1 type the formula =B1+10/C1 + 20. (Or click the “Function” icon which changes to the “Accept”, , icon. Type "B1+10/C1+20"). 5. Press Enter (Or click the “Accept”, , icon. The answer, 24.5, appears in D1.) The answer is wrong, it should be 1, using x = 20 and y = 10, but we got 41 for an answer! Why? Because Calc interpreted the equation as: 20 + (10/10) + 20 which equals 41. If you use formulas with equations in the numerator and denominator, you need to use parenthesis () to force the spreadsheet to calculate them properly. Make the following changes: 1. Click on C1. 2. Click on the Input Line. 3. Edit the formula to read =(A1+10)/(B1+20). (Click just before the A, then Press the ( key [Shift-9]. Click after the 0 in 10, then press the ) key [Shift-0]. Click just before the B, then Press the ( key [Shift-9]. Click after the 0 in 20, then press the ) key [Shift-0]). 4. Click the Accept, , icon (green check mark.) The correct answer, 1, appears in C1. Copy Formulas
  • 7. You can copy a formula so that the formula itself is copied OR that the answer to the formula is copied. Copy The Formula Itself 1. Select (click on) the cell(s) that is to be copied. 2. Right-click, then click Copy. (The material is copied to the clipboard) 3. Select (click on) the cell where the material is to appear. 4. Right-click, then click Paste. Copy The Answer of a Formula 1. Select (click on) the cell(s) that has a formula. 2. Right-click, then click Copy. (The material is copied to the clipboard) 3. Select (click on) the cell where the material is to appear. 4. Right-click, then click Paste Special. (The “Paste Special” window appears) 5. Remove the check mark at Paste all. 6. Remove the check mark at Formulas and add a check mark at Numbers. Click OK. Exponentiation The number 102 is written as 10^2. To enter the ^ sign, press the Shift key and the number 6, , key. 1. Click on A9. 2. Type =A6^A7 (Or click the “Function”, , icon. The “=” appears in "A9". The “Function”, , icon changes to the “Accept”, , icon. Then type "A6^A7".). 3. Press Enter (Or click the “Accept”, , icon.) The answer, 100000, appears in A8. Data Relationship The first thing you need is data that shows a relationship. Examples include mathematical functions, stock market prices over time, rainfall over time, statistical divisions of a population, or divisions of an income that make up a budget. Since math is something that anyone can duplicate, we'll use the sine function: 1. Go to the bottom of your workbook and click on Sheet2. 2. Type X in A1.
  • 8. 3. Type Sine(X) in B1. 4. Enter 0 in A2. (That's a zero. Click anywhere on the Spreadsheet to unselect “A2” after entering the “0”.) 5. Select A2. (Click on A2 again to select it.) Drag-copy A2 down until you see the tool tip number read 90. (Put the cursor over the box at the bottom right corner of "A2". When you see a , click on it and drag it down until you see the tool tip number read 90 then release the click. The numbers will increase by 1 for every line you drag over.) (The number 90 will be in cell A92) 6. Go back to the top and Select B2. (Ctrl+up arrow is a quick way to move up.) 7. Enter =SIN(A2). 8. Click on the bottom right corner of the B2 cell. (The "B2" cell contents change from the formula "=SIN(A2)" into a "0".) Drag-copy the formula all the way down to the 90 in the A column. Don't worry if you don't know what the numbers mean; we aren't concerned with that. The order of the columns matters. Spreadsheet programs typically assume that the column on the left is the variable that is plotted on the horizontal (x) axis of the chart, and the column on the right is the variable that is plotted on the vertical (y) axis. Insert Chart 1. Select columns A and B. 2. Click the Insert Chart, , icon on the Function Toolbar. (The pointer changes to. Click anywhere on the spreadsheet. Or Click Insert > Chart... The "AutoFormat Chart" window appears.) 3. Select -New Sheet- from the drop-down box labeled Chart results in worksheet.
  • 9. 4. Click Next>>>. 5. Select XY Chart. (Hold the cursor over the icons to find it.) 6. Click Next>>>. 7. Select Lines Only and check the X axis and Y axis grid line boxes. ("Y" may already be checked. Don't uncheck it.)
  • 10. 8. Click Next>>>. 9. Give the chart a title, My First Chart, in the box that has Main Title in it. (Replace text.) 10. Click the X axis and Y axis check boxes. 11. Type X for X axis title, and Sine(x) for Y axis title. (Replace existing text.) 12. Click Create. 13. Look at the worksheet tabs at the bottom. 14. Click on the last tab. (Probably labeled Sheet4.) 15. Use the little boxes on the corners to resize the chart by clicking on them and dragging them until you like the proportions. Appearance Of Chart Charts created by spreadsheet programs are unappealing most of the time. You have to mess with the format of the chart elements to make them look better. The first thing I notice is a jagged plot line. That is appropriate for some data, but the sine function is a smooth function, so make the following changes: 1. Double-click somewhere on the chart if you see green boxes or no boxes. 2. Click Format > Chart Type... 3. Select Cubic Spline, , from the Variants box at the bottom.
  • 11. 4. Click OK. That's better, but it could still use some improvement. Try: 1. Click Format > Chart Wall. 2. Click the Area tab. In the dialog box below Fill, click the and select None. Click OK. 3. Place the cursor over the data plot line and double-click. (The smooth Purple line.) 4. Click the Line tab. In the Color dialog box, change the color to Sea Blue. 5. In the Width dialog box, change the width to .02. (Click the repeatedly or highlight the number in the dialog box and type ”.02”.) Click OK. 6. Select Format > Grid > All Axis Grids... 7. Change the Color to Gray 40%. (You have to scroll down the palette.) Click OK. 8. The chart still seems busy. Select Format > Axis > X Axis. Click the Scale tab. 9. Clear the Maximum check box and replace 90 with 45. Click OK. 10. Change the main title text to Sine Function by double-clicking on it and editing it. 11. When you are done, click somewhere else on the chart to accept the changes. 12. Click on a worksheet cell. Click Format > Sheet > Rename. (The “Rename Sheet” window appears.) Rename the sheet, Sine Graph. 13. Save your work. (Click “File > Save”.) Page Preview Toolbar The Page Preview Toolbar allows you to see what Calc is going to print. 1. Bring up the Checking worksheet. (Use the at the bottom left of your spreadsheet.) 2. Click File > Page Preview. (The Page Preview toolbar appears.) 1. If you look on the left end of the Page Preview Toolbar (the third toolbar), you will see four book icons with arrows. These let you view each page that would go to the printer.  The Previous Page icon is first book icon.  The Next Page icon is the second book icon.  The First Page icon is the third book icon.  The Last Page icon is the fourth book icon. 2. Click on the other icons on the Page Preview Toolbar to see their functions.
  • 12. 3. Click Close Preview. Headers And Footers When printed, all pages will have a Header and a Footer on them. The header shows the name of the sheet. The footer shows the page number. All the pages have them. Here's how you can turn them off or edit them: 1. Click Page Format on the toolbar. (The "Page Style: Default" window appears. 2. Click the Header tab. You can turn them off by unchecking the Header check box. You can also format the margins and spacing. To edit the header, click Edit... (The "Header (Page Style: Default)" window appears.) Headers and Footers are broken into three sections. You can use one of the auto-format buttons below the three boxes or type your own header. 1. Click Cancel. (The "Header (Page Style: Default)" window closes.) 2. Uncheck the Header box. Look through the other tabs. 3. Click OK. (The "Page Style: Default" window closes.) The same procedures apply to the footer, so I won't elaborate on that. The Sheet tab gives you the capability to control the way Calc determines the page order and what features to print or scale. The remaining tabs are self-explanatory. Note: Removing the header and footer will change the chart size, so you may have to resize it. Print Ranges What if you don't want to print the whole worksheet? I'm glad you asked! Calc gives you the ability to define print ranges. 1. Bring up the Checking worksheet. 2. Select A1:G25. (Click "A1". Drag copy to "G1".) 3. Click Format > Print Ranges > Define. 4. Open the Page Preview again. Now you only have one page. Unfortunately, there is not an equivalent for charts. The only way you can print a chart only is: 1. Click File > Print...
  • 13. 2. Click the Pages radio button on the bottom left. 3. Type in the page number of the worksheet the chart is on.