SlideShare ist ein Scribd-Unternehmen logo
1 von 2
Downloaden Sie, um offline zu lesen
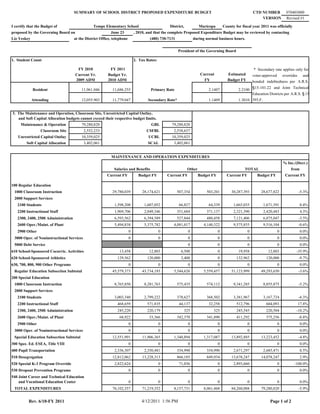
SUMMARY OF SCHOOL DISTRICT PROPOSED EXPENDITURE BUDGET                                                              CTD NUMBER          070403000
                                                                                                                                                             VERSION         Revised #1

I certify that the Budget of                    Tempe Elementary School                           District,           Maricopa        County for fiscal year 2011 was officially
proposed by the Governing Board on                         June 23           , 2010, and that the complete Proposed Expenditure Budget may be reviewed by contacting
Liz Yeskey                           at the District Office, telephone                (480) 730-7131              during normal business hours.


                                                                                                       President of the Governing Board

1. Student Count                                                             2. Tax Rates:

                                      FY 2010             FY 2011                                                                                         * Secondary rate applies only for
                                     Current Yr.         Budget Yr.                                                    Current          Estimated        voter-approved overrides and
                                     2009 ADM            2010 ADM                                                        FY             Budget FY        bonded indebtedness per A.R.S.
                                                                                                                                                         §15-101.22 and Joint Technical
             Resident                    11,961.046         11,686.255                Primary Rate                         2.1407              2.2100
                                                                                                                                                         Education Districts per A.R.S. § 15
             Attending                   12,055.903         11,779.047               Secondary Rate*                       1.1409              1.3010 393.F.


3. The Maintenance and Operation, Classroom Site, Unrestricted Capital Outlay,
   and Soft Capital Allocation budgets cannot exceed their respective budget limits.
     Maintenance & Operation             79,280,820                                   GBL          79,280,820
                 Classroom Site            2,552,233                                CSFBL           2,538,637
    Unrestricted Capital Outlay          10,359,025                                  UCBL          10,359,025
         Soft Capital Allocation           3,402,061                                 SCAL           3,402,061


                                                           MAINTENANCE AND OPERATION EXPENDITURES
                                                                                                                                                                            % Inc./(Decr.)
                                                             Salaries and Benefits                            Other                                TOTAL                        from
                                                         Current FY            Budget FY         Current FY           Budget FY         Current FY          Budget FY        Current FY

100 Regular Education
 1000 Classroom Instruction                                 29,780,039           28,174,621            507,354            503,201          30,287,393         28,677,822             -5.3%
 2000 Support Services
   2100 Students                                             1,598,208             1,607,052            66,827             64,339           1,665,035          1,671,391               0.4%
   2200 Instructional Staff                                  1,969,706             2,049,346           351,684            371,137           2,321,390          2,420,483               4.3%
   2300, 2400, 2500 Administration                           6,593,562             6,394,589           527,844            480,458           7,121,406          6,875,047             -3.5%
   2600 Oper./Maint. of Plant                                5,494,838             5,375,782        4,081,017           4,140,322           9,575,855          9,516,104             -0.6%
   2900 Other                                                            0                   0                0                   0                  0                  0              0.0%
 3000 Oper. of Noninstructional Services                                 0                   0                0                   0                  0                  0              0.0%
 5000 Debt Service                                                                                            0                   0                  0                  0              0.0%
610 School-Sponsored Cocurric. Activities                       13,458               12,803              6,500                    0            19,958             12,803            -35.9%
620 School-Sponsored Athletics                                 129,562              120,000              3,400                    0           132,962            120,000             -9.7%
630, 700, 800, 900 Other Programs                                        0                   0                0                   0                  0                  0              0.0%
 Regular Education Subsection Subtotal                      45,579,373           43,734,193         5,544,626           5,559,457          51,123,999         49,293,650             -3.6%
200 Special Education
 1000 Classroom Instruction                                  8,765,850             8,281,763           575,435            574,112           9,341,285          8,855,875             -5.2%
 2000 Support Services
   2100 Students                                             3,003,340             2,799,222           378,627            368,502           3,381,967          3,167,724             -6.3%
   2200 Instructional Staff                                    468,659              571,835             44,137             32,258             512,796            604,093            17.8%
   2300, 2400, 2500 Administration                             245,220              220,179               325                325              245,545            220,504            -10.2%
   2600 Oper./Maint. of Plant                                   68,922               33,366            342,370            341,890             411,292            375,256             -8.8%
   2900 Other                                                            0                   0                0                   0                  0                  0              0.0%
 3000 Oper. of Noninstructional Services                                 0                   0                0                   0                  0                  0              0.0%
 Special Education Subsection Subtotal                      12,551,991           11,906,365         1,340,894           1,317,087          13,892,885         13,223,452             -4.8%
300 Spec. Ed. ESEA, Title VIII                                           0                   0                0                   0                  0                  0              0.0%
400 Pupil Transportation                                     2,336,307             2,350,481           334,990            334,990           2,671,297          2,685,471               0.5%
510 Desegregation                                           12,812,062           13,228,313            866,185            849,934          13,678,247         14,078,247               2.9%
520 Special K-3 Program Override                             2,822,624                       0          71,036                    0         2,893,660                   0          -100.0%
530 Dropout Prevention Programs                                          0                   0                0                   0                  0                  0              0.0%
540 Joint Career and Technical Education
    and Vocational Education Center                                      0                   0                0                   0                  0                  0              0.0%
 TOTAL EXPENDITURES                                         76,102,357           71,219,352         8,157,731           8,061,468          84,260,088         79,280,820             -5.9%


          Rev. 6/10-FY 2011                                                      4/12/2011 1:56 PM                                                                 Page 1 of 2
SUMMARY OF SCHOOL DISTRICT PROPOSED EXPENDITURE BUDGET (Concl'd)                                                               CTD NUMBER         070403000
                                                                                                                                  VERSION         Revised #1


                                    TOTAL EXPENDITURES BY FUND
                                                                      $ Increase/       % Increase/
                                        Budgeted Expenditures         (Decrease)        (Decrease)
                   Fund                                                  from              from
                                    Current FY        Budget FY       Current FY        Current FY
Maintenance & Operation               84,260,089        79,280,820       (4,979,269)            -5.9%
Instructional Improvement                 650,000          500,000        (150,000)            -23.1%
Full-Day Kindergarten                            0                0                 0            0.0%
Full-Day K Capital                               0                0                 0            0.0%
Structured English Immersion                     0                0                 0            0.0%
Compensatory Instruction                   75,881                 0         (75,881)          -100.0%
Classroom Site                           4,841,248       2,552,233       (2,289,015)           -47.3%
Federal Projects                      17,555,000        17,230,000        (325,000)             -1.9%
State Projects                            584,000          350,000        (234,000)            -40.1%
Unrestricted Capital Outlay           11,225,138        10,359,025        (866,113)             -7.7%
Soft Capital Allocation                  4,288,473       3,402,061        (886,412)            -20.7%
Building Renewal                         1,000,000         715,000        (285,000)            -28.5%
New School Facilities                            0                0                 0            0.0%
Adjacent Ways                            2,000,000       2,300,000         300,000             15.0%
Debt Service                          13,000,000        14,500,000       1,500,000             11.5%
School Plant Funds                        475,000          385,000          (90,000)           -18.9%
Auxiliary Operations                             0                0                 0            0.0%
Bond Building                         10,000,000        28,390,332      18,390,332            183.9%
Food Service                             6,000,000       6,000,000                  0            0.0%
Other                                    3,063,000       2,482,500        (580,500)            -19.0%

              M&O FUND SPECIAL EDUCATION PROGRAMS BY TYPE
             Program (A.R.S. §15-761)                Current FY       Budget FY
Autism                                                   1,027,992         995,081                             PROPOSED STAFFING SUMMARY
Emotional Disability                                     1,195,922       1,157,635                                                No. of          Staff-Pupil
Hearing Impairment                                         100,866          97,636                          Staff Type          Employees               Ratio
Other Health Impairments                                   539,197         521,935          Certified --
Specific Learning Disability                             4,126,676       3,994,563          Superintendent, Principals,
Mild, Moderate or Severe Mental Retardation              1,004,765         972,598             Other Administrators                         45   1 to       261.8
Multiple Disabilities                                      169,891         164,452          Teachers                                       924   1 to           12.7
Multiple Disabilities with S.S.I.                          269,151         260,534          Other                                          115   1 to       102.4
Orthopedic Impairment                                      110,836         107,287                      Subtotal                      1,084      1 to           10.9
Developmental Delay                                        384,848         372,527          Classified --
Preschool Severe Delay                                     364,776         353,098          Managers, Supervisors, Directors                16   1 to       736.2
Speech/Language Impairment                               2,688,312       2,602,248          Teachers Aides                                 244   1 to           48.3
Traumatic Brain Injury                                      16,612          16,080          Other                                          601   1 to           19.6
Visual Impairment                                          152,833         147,941                      Subtotal                           861   1 to           13.7
        Subtotal                                        12,152,677      11,763,615                                 TOTAL              1,945      1 to            6.1
Gifted Education                                           687,137         674,174          Special Education --
Remedial Education                                                0                 0
ELL Incremental Costs                                    1,053,071         785,663          Teacher                                        136   1 to           12.0
ELL Compensatory Instruction                                      0                 0       Staff                                          168   1 to           10.0
Vocational and Technological Education                            0                 0
Career Education                                                  0                 0
           TOTAL                                        13,892,885      13,223,452


           Rev. 6/10-FY 2011                                          4/12/2011 1:56 PM                                                    Page 2 of 2

Weitere ähnliche Inhalte

Was ist angesagt? (6)

Measurement of performance of bharti airtel by using different ratios
Measurement of performance of bharti airtel by using different ratiosMeasurement of performance of bharti airtel by using different ratios
Measurement of performance of bharti airtel by using different ratios
 
Occupational stats --recent
Occupational stats --recentOccupational stats --recent
Occupational stats --recent
 
FY11 School Committee Approved Budget
FY11 School Committee Approved BudgetFY11 School Committee Approved Budget
FY11 School Committee Approved Budget
 
Ibtada Annual report 2009-10
Ibtada Annual report 2009-10Ibtada Annual report 2009-10
Ibtada Annual report 2009-10
 
Anuul report report 2010
Anuul report report 2010Anuul report report 2010
Anuul report report 2010
 
Passa
PassaPassa
Passa
 

Ähnlich wie 2010-2011 Adopted Budget Revision #1

Mayo%202010 presupuesto centro
Mayo%202010 presupuesto centroMayo%202010 presupuesto centro
Mayo%202010 presupuesto centro
winstonrivera
 
Mayo de 2010 presupuesto centro
Mayo de 2010 presupuesto centroMayo de 2010 presupuesto centro
Mayo de 2010 presupuesto centro
winstonrivera
 
MURSD FY12 Foundation Budget
MURSD FY12 Foundation BudgetMURSD FY12 Foundation Budget
MURSD FY12 Foundation Budget
jpm66
 
09 10 Budget Adoption 4 18 09
09 10  Budget Adoption 4 18 0909 10  Budget Adoption 4 18 09
09 10 Budget Adoption 4 18 09
Sandra Kolbo
 
Northampton Budget FY2012 as of 31 March 2011
Northampton Budget FY2012 as of 31 March 2011Northampton Budget FY2012 as of 31 March 2011
Northampton Budget FY2012 as of 31 March 2011
Adam Cohen
 
Realisasi dipa mar jun 2011
Realisasi dipa mar jun 2011Realisasi dipa mar jun 2011
Realisasi dipa mar jun 2011
pamedan
 
2011 introduced budget expenses by agency
2011 introduced budget   expenses by agency2011 introduced budget   expenses by agency
2011 introduced budget expenses by agency
Abdul-Hakim Shabazz
 
BKW Budget Presentation 2012-13
BKW Budget Presentation 2012-13BKW Budget Presentation 2012-13
BKW Budget Presentation 2012-13
bkwschools
 
Battle Ground Public Schools Levy Presentation February 25, 2013
Battle Ground Public Schools Levy Presentation February 25, 2013Battle Ground Public Schools Levy Presentation February 25, 2013
Battle Ground Public Schools Levy Presentation February 25, 2013
scottmcd
 
Ptcl budget 2011
Ptcl budget 2011Ptcl budget 2011
Ptcl budget 2011
guest323131
 

Ähnlich wie 2010-2011 Adopted Budget Revision #1 (20)

Mayo%202010 presupuesto centro
Mayo%202010 presupuesto centroMayo%202010 presupuesto centro
Mayo%202010 presupuesto centro
 
Mayo de 2010 presupuesto centro
Mayo de 2010 presupuesto centroMayo de 2010 presupuesto centro
Mayo de 2010 presupuesto centro
 
Overall of 2012
Overall of 2012Overall of 2012
Overall of 2012
 
MURSD FY12 Foundation Budget
MURSD FY12 Foundation BudgetMURSD FY12 Foundation Budget
MURSD FY12 Foundation Budget
 
09 10 Budget Adoption 4 18 09
09 10  Budget Adoption 4 18 0909 10  Budget Adoption 4 18 09
09 10 Budget Adoption 4 18 09
 
Teachers Training
Teachers TrainingTeachers Training
Teachers Training
 
Tax Hearing
Tax HearingTax Hearing
Tax Hearing
 
Northampton Budget FY2012 as of 31 March 2011
Northampton Budget FY2012 as of 31 March 2011Northampton Budget FY2012 as of 31 March 2011
Northampton Budget FY2012 as of 31 March 2011
 
Realisasi dipa mar jun 2011
Realisasi dipa mar jun 2011Realisasi dipa mar jun 2011
Realisasi dipa mar jun 2011
 
Ch 10 financial management notes
Ch 10 financial management notesCh 10 financial management notes
Ch 10 financial management notes
 
2011 introduced budget expenses by agency
2011 introduced budget   expenses by agency2011 introduced budget   expenses by agency
2011 introduced budget expenses by agency
 
BKW Budget Presentation 2012-13
BKW Budget Presentation 2012-13BKW Budget Presentation 2012-13
BKW Budget Presentation 2012-13
 
Battle Ground Public Schools Levy Presentation February 25, 2013
Battle Ground Public Schools Levy Presentation February 25, 2013Battle Ground Public Schools Levy Presentation February 25, 2013
Battle Ground Public Schools Levy Presentation February 25, 2013
 
2011 Fhrboc Presentation T&T
2011 Fhrboc Presentation T&T2011 Fhrboc Presentation T&T
2011 Fhrboc Presentation T&T
 
Operational budgeting
Operational budgetingOperational budgeting
Operational budgeting
 
Gvsd Budget Pres Apr 19 2010 B
Gvsd Budget Pres Apr 19 2010 BGvsd Budget Pres Apr 19 2010 B
Gvsd Budget Pres Apr 19 2010 B
 
Ejecucion de gastos a junio 2016
Ejecucion de gastos a junio 2016Ejecucion de gastos a junio 2016
Ejecucion de gastos a junio 2016
 
Honolulu Police Department FY2013 Presentation
Honolulu Police Department FY2013 PresentationHonolulu Police Department FY2013 Presentation
Honolulu Police Department FY2013 Presentation
 
PTCL Budget
PTCL BudgetPTCL Budget
PTCL Budget
 
Ptcl budget 2011
Ptcl budget 2011Ptcl budget 2011
Ptcl budget 2011
 

Mehr von Tempe Elementary Schools

Arredondo Elementary School, Regional Design Team Presentation
Arredondo Elementary School, Regional Design Team PresentationArredondo Elementary School, Regional Design Team Presentation
Arredondo Elementary School, Regional Design Team Presentation
Tempe Elementary Schools
 
Fees Middle School 5th Grade Parent Orientation 2010
Fees Middle School 5th Grade Parent Orientation 2010Fees Middle School 5th Grade Parent Orientation 2010
Fees Middle School 5th Grade Parent Orientation 2010
Tempe Elementary Schools
 

Mehr von Tempe Elementary Schools (9)

2011-2012 Adopted Budget
2011-2012 Adopted Budget2011-2012 Adopted Budget
2011-2012 Adopted Budget
 
2010-2011 Adopted Budget Revision #2
2010-2011 Adopted Budget Revision #22010-2011 Adopted Budget Revision #2
2010-2011 Adopted Budget Revision #2
 
Connolly Regional Design Team Presentation
Connolly Regional Design Team PresentationConnolly Regional Design Team Presentation
Connolly Regional Design Team Presentation
 
Fees Regional Design Team Presentation
Fees Regional Design Team PresentationFees Regional Design Team Presentation
Fees Regional Design Team Presentation
 
Gililland Regional Design Team Presentation
Gililland Regional Design Team PresentationGililland Regional Design Team Presentation
Gililland Regional Design Team Presentation
 
McKemy Regional Design Team Presentation
McKemy Regional Design Team PresentationMcKemy Regional Design Team Presentation
McKemy Regional Design Team Presentation
 
Arredondo Elementary School, Regional Design Team Presentation
Arredondo Elementary School, Regional Design Team PresentationArredondo Elementary School, Regional Design Team Presentation
Arredondo Elementary School, Regional Design Team Presentation
 
Community Forum - Fees College Preparatory Middle School
Community Forum - Fees College Preparatory Middle SchoolCommunity Forum - Fees College Preparatory Middle School
Community Forum - Fees College Preparatory Middle School
 
Fees Middle School 5th Grade Parent Orientation 2010
Fees Middle School 5th Grade Parent Orientation 2010Fees Middle School 5th Grade Parent Orientation 2010
Fees Middle School 5th Grade Parent Orientation 2010
 

Kürzlich hochgeladen

Russian Escort Service in Delhi 11k Hotel Foreigner Russian Call Girls in Delhi
Russian Escort Service in Delhi 11k Hotel Foreigner Russian Call Girls in DelhiRussian Escort Service in Delhi 11k Hotel Foreigner Russian Call Girls in Delhi
Russian Escort Service in Delhi 11k Hotel Foreigner Russian Call Girls in Delhi
kauryashika82
 
Beyond the EU: DORA and NIS 2 Directive's Global Impact
Beyond the EU: DORA and NIS 2 Directive's Global ImpactBeyond the EU: DORA and NIS 2 Directive's Global Impact
Beyond the EU: DORA and NIS 2 Directive's Global Impact
PECB
 
Ecosystem Interactions Class Discussion Presentation in Blue Green Lined Styl...
Ecosystem Interactions Class Discussion Presentation in Blue Green Lined Styl...Ecosystem Interactions Class Discussion Presentation in Blue Green Lined Styl...
Ecosystem Interactions Class Discussion Presentation in Blue Green Lined Styl...
fonyou31
 
1029 - Danh muc Sach Giao Khoa 10 . pdf
1029 -  Danh muc Sach Giao Khoa 10 . pdf1029 -  Danh muc Sach Giao Khoa 10 . pdf
1029 - Danh muc Sach Giao Khoa 10 . pdf
QucHHunhnh
 

Kürzlich hochgeladen (20)

Key note speaker Neum_Admir Softic_ENG.pdf
Key note speaker Neum_Admir Softic_ENG.pdfKey note speaker Neum_Admir Softic_ENG.pdf
Key note speaker Neum_Admir Softic_ENG.pdf
 
Russian Escort Service in Delhi 11k Hotel Foreigner Russian Call Girls in Delhi
Russian Escort Service in Delhi 11k Hotel Foreigner Russian Call Girls in DelhiRussian Escort Service in Delhi 11k Hotel Foreigner Russian Call Girls in Delhi
Russian Escort Service in Delhi 11k Hotel Foreigner Russian Call Girls in Delhi
 
Arihant handbook biology for class 11 .pdf
Arihant handbook biology for class 11 .pdfArihant handbook biology for class 11 .pdf
Arihant handbook biology for class 11 .pdf
 
Disha NEET Physics Guide for classes 11 and 12.pdf
Disha NEET Physics Guide for classes 11 and 12.pdfDisha NEET Physics Guide for classes 11 and 12.pdf
Disha NEET Physics Guide for classes 11 and 12.pdf
 
Advance Mobile Application Development class 07
Advance Mobile Application Development class 07Advance Mobile Application Development class 07
Advance Mobile Application Development class 07
 
Advanced Views - Calendar View in Odoo 17
Advanced Views - Calendar View in Odoo 17Advanced Views - Calendar View in Odoo 17
Advanced Views - Calendar View in Odoo 17
 
Paris 2024 Olympic Geographies - an activity
Paris 2024 Olympic Geographies - an activityParis 2024 Olympic Geographies - an activity
Paris 2024 Olympic Geographies - an activity
 
Measures of Central Tendency: Mean, Median and Mode
Measures of Central Tendency: Mean, Median and ModeMeasures of Central Tendency: Mean, Median and Mode
Measures of Central Tendency: Mean, Median and Mode
 
Software Engineering Methodologies (overview)
Software Engineering Methodologies (overview)Software Engineering Methodologies (overview)
Software Engineering Methodologies (overview)
 
Presentation by Andreas Schleicher Tackling the School Absenteeism Crisis 30 ...
Presentation by Andreas Schleicher Tackling the School Absenteeism Crisis 30 ...Presentation by Andreas Schleicher Tackling the School Absenteeism Crisis 30 ...
Presentation by Andreas Schleicher Tackling the School Absenteeism Crisis 30 ...
 
9548086042 for call girls in Indira Nagar with room service
9548086042  for call girls in Indira Nagar  with room service9548086042  for call girls in Indira Nagar  with room service
9548086042 for call girls in Indira Nagar with room service
 
Call Girls in Dwarka Mor Delhi Contact Us 9654467111
Call Girls in Dwarka Mor Delhi Contact Us 9654467111Call Girls in Dwarka Mor Delhi Contact Us 9654467111
Call Girls in Dwarka Mor Delhi Contact Us 9654467111
 
Beyond the EU: DORA and NIS 2 Directive's Global Impact
Beyond the EU: DORA and NIS 2 Directive's Global ImpactBeyond the EU: DORA and NIS 2 Directive's Global Impact
Beyond the EU: DORA and NIS 2 Directive's Global Impact
 
Web & Social Media Analytics Previous Year Question Paper.pdf
Web & Social Media Analytics Previous Year Question Paper.pdfWeb & Social Media Analytics Previous Year Question Paper.pdf
Web & Social Media Analytics Previous Year Question Paper.pdf
 
Nutritional Needs Presentation - HLTH 104
Nutritional Needs Presentation - HLTH 104Nutritional Needs Presentation - HLTH 104
Nutritional Needs Presentation - HLTH 104
 
Ecosystem Interactions Class Discussion Presentation in Blue Green Lined Styl...
Ecosystem Interactions Class Discussion Presentation in Blue Green Lined Styl...Ecosystem Interactions Class Discussion Presentation in Blue Green Lined Styl...
Ecosystem Interactions Class Discussion Presentation in Blue Green Lined Styl...
 
Holdier Curriculum Vitae (April 2024).pdf
Holdier Curriculum Vitae (April 2024).pdfHoldier Curriculum Vitae (April 2024).pdf
Holdier Curriculum Vitae (April 2024).pdf
 
1029 - Danh muc Sach Giao Khoa 10 . pdf
1029 -  Danh muc Sach Giao Khoa 10 . pdf1029 -  Danh muc Sach Giao Khoa 10 . pdf
1029 - Danh muc Sach Giao Khoa 10 . pdf
 
social pharmacy d-pharm 1st year by Pragati K. Mahajan
social pharmacy d-pharm 1st year by Pragati K. Mahajansocial pharmacy d-pharm 1st year by Pragati K. Mahajan
social pharmacy d-pharm 1st year by Pragati K. Mahajan
 
fourth grading exam for kindergarten in writing
fourth grading exam for kindergarten in writingfourth grading exam for kindergarten in writing
fourth grading exam for kindergarten in writing
 

2010-2011 Adopted Budget Revision #1

  • 1. SUMMARY OF SCHOOL DISTRICT PROPOSED EXPENDITURE BUDGET CTD NUMBER 070403000 VERSION Revised #1 I certify that the Budget of Tempe Elementary School District, Maricopa County for fiscal year 2011 was officially proposed by the Governing Board on June 23 , 2010, and that the complete Proposed Expenditure Budget may be reviewed by contacting Liz Yeskey at the District Office, telephone (480) 730-7131 during normal business hours. President of the Governing Board 1. Student Count 2. Tax Rates: FY 2010 FY 2011 * Secondary rate applies only for Current Yr. Budget Yr. Current Estimated voter-approved overrides and 2009 ADM 2010 ADM FY Budget FY bonded indebtedness per A.R.S. §15-101.22 and Joint Technical Resident 11,961.046 11,686.255 Primary Rate 2.1407 2.2100 Education Districts per A.R.S. § 15 Attending 12,055.903 11,779.047 Secondary Rate* 1.1409 1.3010 393.F. 3. The Maintenance and Operation, Classroom Site, Unrestricted Capital Outlay, and Soft Capital Allocation budgets cannot exceed their respective budget limits. Maintenance & Operation 79,280,820 GBL 79,280,820 Classroom Site 2,552,233 CSFBL 2,538,637 Unrestricted Capital Outlay 10,359,025 UCBL 10,359,025 Soft Capital Allocation 3,402,061 SCAL 3,402,061 MAINTENANCE AND OPERATION EXPENDITURES % Inc./(Decr.) Salaries and Benefits Other TOTAL from Current FY Budget FY Current FY Budget FY Current FY Budget FY Current FY 100 Regular Education 1000 Classroom Instruction 29,780,039 28,174,621 507,354 503,201 30,287,393 28,677,822 -5.3% 2000 Support Services 2100 Students 1,598,208 1,607,052 66,827 64,339 1,665,035 1,671,391 0.4% 2200 Instructional Staff 1,969,706 2,049,346 351,684 371,137 2,321,390 2,420,483 4.3% 2300, 2400, 2500 Administration 6,593,562 6,394,589 527,844 480,458 7,121,406 6,875,047 -3.5% 2600 Oper./Maint. of Plant 5,494,838 5,375,782 4,081,017 4,140,322 9,575,855 9,516,104 -0.6% 2900 Other 0 0 0 0 0 0 0.0% 3000 Oper. of Noninstructional Services 0 0 0 0 0 0 0.0% 5000 Debt Service 0 0 0 0 0.0% 610 School-Sponsored Cocurric. Activities 13,458 12,803 6,500 0 19,958 12,803 -35.9% 620 School-Sponsored Athletics 129,562 120,000 3,400 0 132,962 120,000 -9.7% 630, 700, 800, 900 Other Programs 0 0 0 0 0 0 0.0% Regular Education Subsection Subtotal 45,579,373 43,734,193 5,544,626 5,559,457 51,123,999 49,293,650 -3.6% 200 Special Education 1000 Classroom Instruction 8,765,850 8,281,763 575,435 574,112 9,341,285 8,855,875 -5.2% 2000 Support Services 2100 Students 3,003,340 2,799,222 378,627 368,502 3,381,967 3,167,724 -6.3% 2200 Instructional Staff 468,659 571,835 44,137 32,258 512,796 604,093 17.8% 2300, 2400, 2500 Administration 245,220 220,179 325 325 245,545 220,504 -10.2% 2600 Oper./Maint. of Plant 68,922 33,366 342,370 341,890 411,292 375,256 -8.8% 2900 Other 0 0 0 0 0 0 0.0% 3000 Oper. of Noninstructional Services 0 0 0 0 0 0 0.0% Special Education Subsection Subtotal 12,551,991 11,906,365 1,340,894 1,317,087 13,892,885 13,223,452 -4.8% 300 Spec. Ed. ESEA, Title VIII 0 0 0 0 0 0 0.0% 400 Pupil Transportation 2,336,307 2,350,481 334,990 334,990 2,671,297 2,685,471 0.5% 510 Desegregation 12,812,062 13,228,313 866,185 849,934 13,678,247 14,078,247 2.9% 520 Special K-3 Program Override 2,822,624 0 71,036 0 2,893,660 0 -100.0% 530 Dropout Prevention Programs 0 0 0 0 0 0 0.0% 540 Joint Career and Technical Education and Vocational Education Center 0 0 0 0 0 0 0.0% TOTAL EXPENDITURES 76,102,357 71,219,352 8,157,731 8,061,468 84,260,088 79,280,820 -5.9% Rev. 6/10-FY 2011 4/12/2011 1:56 PM Page 1 of 2
  • 2. SUMMARY OF SCHOOL DISTRICT PROPOSED EXPENDITURE BUDGET (Concl'd) CTD NUMBER 070403000 VERSION Revised #1 TOTAL EXPENDITURES BY FUND $ Increase/ % Increase/ Budgeted Expenditures (Decrease) (Decrease) Fund from from Current FY Budget FY Current FY Current FY Maintenance & Operation 84,260,089 79,280,820 (4,979,269) -5.9% Instructional Improvement 650,000 500,000 (150,000) -23.1% Full-Day Kindergarten 0 0 0 0.0% Full-Day K Capital 0 0 0 0.0% Structured English Immersion 0 0 0 0.0% Compensatory Instruction 75,881 0 (75,881) -100.0% Classroom Site 4,841,248 2,552,233 (2,289,015) -47.3% Federal Projects 17,555,000 17,230,000 (325,000) -1.9% State Projects 584,000 350,000 (234,000) -40.1% Unrestricted Capital Outlay 11,225,138 10,359,025 (866,113) -7.7% Soft Capital Allocation 4,288,473 3,402,061 (886,412) -20.7% Building Renewal 1,000,000 715,000 (285,000) -28.5% New School Facilities 0 0 0 0.0% Adjacent Ways 2,000,000 2,300,000 300,000 15.0% Debt Service 13,000,000 14,500,000 1,500,000 11.5% School Plant Funds 475,000 385,000 (90,000) -18.9% Auxiliary Operations 0 0 0 0.0% Bond Building 10,000,000 28,390,332 18,390,332 183.9% Food Service 6,000,000 6,000,000 0 0.0% Other 3,063,000 2,482,500 (580,500) -19.0% M&O FUND SPECIAL EDUCATION PROGRAMS BY TYPE Program (A.R.S. §15-761) Current FY Budget FY Autism 1,027,992 995,081 PROPOSED STAFFING SUMMARY Emotional Disability 1,195,922 1,157,635 No. of Staff-Pupil Hearing Impairment 100,866 97,636 Staff Type Employees Ratio Other Health Impairments 539,197 521,935 Certified -- Specific Learning Disability 4,126,676 3,994,563 Superintendent, Principals, Mild, Moderate or Severe Mental Retardation 1,004,765 972,598 Other Administrators 45 1 to 261.8 Multiple Disabilities 169,891 164,452 Teachers 924 1 to 12.7 Multiple Disabilities with S.S.I. 269,151 260,534 Other 115 1 to 102.4 Orthopedic Impairment 110,836 107,287 Subtotal 1,084 1 to 10.9 Developmental Delay 384,848 372,527 Classified -- Preschool Severe Delay 364,776 353,098 Managers, Supervisors, Directors 16 1 to 736.2 Speech/Language Impairment 2,688,312 2,602,248 Teachers Aides 244 1 to 48.3 Traumatic Brain Injury 16,612 16,080 Other 601 1 to 19.6 Visual Impairment 152,833 147,941 Subtotal 861 1 to 13.7 Subtotal 12,152,677 11,763,615 TOTAL 1,945 1 to 6.1 Gifted Education 687,137 674,174 Special Education -- Remedial Education 0 0 ELL Incremental Costs 1,053,071 785,663 Teacher 136 1 to 12.0 ELL Compensatory Instruction 0 0 Staff 168 1 to 10.0 Vocational and Technological Education 0 0 Career Education 0 0 TOTAL 13,892,885 13,223,452 Rev. 6/10-FY 2011 4/12/2011 1:56 PM Page 2 of 2