"RetailMetrics" Measure newsletter
•
1 like•340 views

Sample of monthly newsletter Tom Dowdy pioneered at National In-Store. The "Measure" newsletter set NIS apart as a "thought leader" in the retail services sector.

Recommended
Recommended
More Related Content
Similar to "RetailMetrics" Measure newsletter
Similar to "RetailMetrics" Measure newsletter (20)
Recently uploaded
Recently uploaded (20)
"RetailMetrics" Measure newsletter
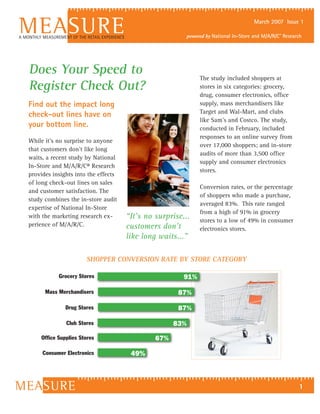
- 1. MEASURE A MONTHLY MEASUREMENT OF THE RETAIL EXPERIENCE March 2007 Issue 1 powered by National In-Store and M/A/R/C ® Research Does Your Speed to The study included shoppers at Register Check Out? stores in six categories: grocery, drug, consumer electronics, office Find out the impact long supply, mass merchandisers like Target and Wal-Mart, and clubs check-out lines have on like Sam’s and Costco. The study, your bottom line. conducted in February, included responses to an online survey from While it’s no surprise to anyone over 17,000 shoppers; and in-store that customers don’t like long audits of more than 3,500 office waits, a recent study by National supply and consumer electronics In-Store and M/A/R/C® Research stores. provides insights into the effects of long check-out lines on sales Conversion rates, or the percentage and customer satisfaction. The of shoppers who made a purchase, study combines the in-store audit averaged 83%. This rate ranged expertise of National In-Store from a high of 91% in grocery with the marketing research ex- “It’s no surprise... stores to a low of 49% in consumer perience of M/A/R/C. customers don’t electronics stores. like long waits...” SHOPPER CONVERSION RATE BY STORE CATEGORY Grocery Stores 91% Mass Merchandisers 87% Drug Stores 87% Club Stores 83% Office Supplies Stores 67% Consumer Electronics 49% MEASURE 1
- 2. MEASURE A MONTHLY MEASUREMENT OF THE RETAIL EXPERIENCE powered by National In-Store and M/A/R/C ® Research Among shoppers who left the store without SHOPPERS REPORTING CHECK-OUT making a purchase, one in ten cited the wait TIMES INFLUENCED THEM TO LEAVE to check out as a factor in their decision to not WITHOUT MAKING A PURCHASE make a purchase. This figure ranged from 6% in office supply stores to 11% for grocery stores. Grocery Stores 11% Mass Merchandisers 9% “We have reconfirmed one important fac- tor influencing conversion rates. Retailers Club Stores 8% wishing to win must continually identify the other factors that have the greatest relation- Consumer Electronics 7% ship towards improving results.” Drug Stores 7% Steve Greenstein, NIS RetailMetrics Office Supplies Stores 6% Customer satisfaction declines sharply as tion levels fall below 80% for all but club check-out times grow. More than 90% of stores, where shoppers are slightly more shoppers were extremely or very satisfied with tolerant of the longer check-out times. a quick check-out of 1 to 3 minutes. When Satisfaction declines sharply for waits the process takes 4 or 5 minutes, satisfac- longer than five minutes. SATISFACTION WITH CHECK-OUT TIME 100% Club Stores (% Extremely or Very Satisfied) 80% Consumer Electronics Office Supplies Stores SATISFACTION 60% Drug Stores Mass Merchandisers 40% Grocery Stores All Stores 20% 0% 1 2 to 3 4 to 5 6+ CHECK-OUT TIME (minutes) MEASURE 2
- 3. MEASURE A MONTHLY MEASUREMENT OF THE RETAIL EXPERIENCE powered by National In-Store and M/A/R/C ® Research Men are more likely to forego a purchase CHECK-OUT WAIT INFLUENCED because of long check-out times, as are DECISION NOT TO BUY adults in the 35–54 age group. Male 10% Field audits show the average number of Female 7% customers in line to check out varies by day of week and time of day. In office supply 18-24 8% stores, lines are shortest in the morning and 25-34 8% longest during lunch hours. In consumer 35-44 9% electronics stores the lines grow during eve- nings and weekends. Overall, stores in both 45-54 10% categories tend to keep average line lengths 55-64 7% to about two customers. 65+ 7% CUSTOMERS PER LINE Monday Tuesday Wednesday Thursday Friday Saturday Sunday 3.9 3.9 2.4 2.5 2.7 2.0 2.0 2.3 2.2 1.9 2.1 1.8 1.8 2.0 CONSUMER ELECTRONICS OFFICE SUPPLY “The variability we are seeing by day of week is a great indicator of opportunity for most retailers. Identified variability in performance should be subject to root cause analysis, starting with the question “Why”.” Steve Greenstein, NIS RetailMetrics MEASURE 3
- 4. MEASURE A MONTHLY MEASUREMENT OF THE RETAIL EXPERIENCE powered by National In-Store and M/A/R/C ® Research National In-Store M/A/R/C Research Kathy Hartman Tony Amador Business Development VP, Client Development 2 North Tamiami Trail, 9th Floor 1660 North Westridge Circle Sarasota, FL 34236 Irving, TX 75038 tel 941.554.2666 tel 972.983.0436 khartman@nis-retail.com tony.amador@marcresearch.com www.nis-retail.com www.marcresearch.com ® M/A/R/C® Research is a full-service marketing research Retail Metrics, a division of National In-Store, is built and consulting firm that uses innovative qualitative around the philosophy, “What gets measured, gets done.” and quantitative methodologies to help clients launch We provide retailers in-store Inspections, Measurement, better products and services, find new and valuable and Score-Carding services to correct and achieve strategic customers, and build stronger brands. goals, as well as determine areas of opportunity or success at a total chain or individual store level. The overall goal Our proven marketing issues platforms support clients’ is to improve sales and profits through improved in-store brand building efforts. execution. Our subject matter expertise in retail audit - Assessor® – a new product development and opti- and operations along with our national presence ensures mization platform – helps clients “green light” ideas, coverage to your entire footprint. evaluate concepts, forecast the sales and market po- tential of developed offerings, or optimize marketplace National In-Store is the fastest-growing U.S. retail re- strategy. sources provider, serving more than three million retail - MarketLink – a brand (BrandLink) and customer sites annually with more than 10,000 field associates. NIS (CustomerLink) development platform – identifies and offers a wide range of merchandising support services and quantifies actions driving brand health and customer is a partner of the Omnicom Group, a leading global adver- loyalty. tising, marketing and corporate communications company. - Custom Portfolio – a collection of structured, yet flexible research offerings – designed to meet clients’ diverse needs. Since 1965, M/A/R/C has delivered high-quality, objec- tive driven research. Our teams design and execute traditional and online solutions while adhering to a client-service ethic built on being easy to work with, and delivering what is promised. MEASURE 4