Economic Indicators June 2014 (dc)
•
0 gefällt mir•415 views

Highlights • The total number of jobs in the District increased by 3,700 (0.5%) compared to the previous year • The federal government sector lost 6,000 jobs (a decline of 2.9%) compared to a year ago; while the leisure and hospitality sector gained 1,000 jobs (an increase of 1.4%) over the previous year • The unemployment rate for the District was 7.5% in April; the same as the previous month • The number of new unemployment claims fell by 4.4% compared to the previous year • 438 condos were sold in April 2014; a 0.9% increase from one year ago • In April the median price for a single family home increased by 8.5%, while the median price of a condo declined negligibly (0.02%) over the previous year

Empfohlen
Empfohlen
Weitere ähnliche Inhalte
Was ist angesagt?
Was ist angesagt? (19)
Ähnlich wie Economic Indicators June 2014 (dc)
Ähnlich wie Economic Indicators June 2014 (dc) (20)
Mehr von Susie Cambria
Mehr von Susie Cambria (19)
Economic Indicators June 2014 (dc)
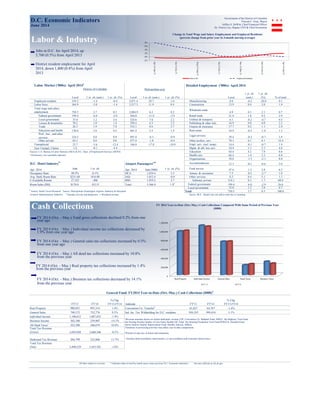
- 1. Labor Market ('000s): April 2014a Detailed Employment ('000s): April 2014 Metropolitan area Level 1 yr. ch. (amt.) 1 yr. ch. (%) Level 1 yr ch. (amt.) 1 yr. ch. (%) Level 1 yr. ch. (amt.) 1 yr. ch. (%) % of total Employed residents 339.2 -1.4 -0.4 3,071.4 29.7 1.0 Manufacturing 0.8 -0.2 -20.0 0.1 Labor force 364.9 -5.0 -1.4 3,217.3 11.9 0.4 Construction 13.9 0.4 3.0 1.9 Total wage and salary employment 750.5 3.7 0.5 3,084.9 6.3 0.2 Wholesale trade 4.9 0.1 2.1 0.7 Federal government 199.4 -6.0 -2.9 364.0 -11.0 -2.9 Retail trade 21.4 1.8 9.2 2.9 Local government 35.0 1.2 3.6 324.6 7.0 2.2 Utilities & transport. 4.1 -0.2 -4.7 0.5 Leisure & hospitality 70.2 1.0 1.4 294.4 6.3 2.2 Publishing & other info. 16.9 0.0 0.0 2.3 Trade 26.3 1.9 7.8 332.1 8.6 2.7 Finance & insurance 17.7 0.2 1.1 2.4 Education and health 130.8 5.6 4.5 401.4 5.5 1.4 Real estate 10.9 -0.2 -1.8 1.5 Prof., bus., and other services 224.5 0.0 0.0 891.0 -8.3 -0.9 Legal services 29.4 -0.2 -0.7 3.9 Other private 64.3 0.0 0.0 477.4 -1.8 -0.4 Other profess. serv. 78.3 0.1 0.1 10.4 Unemployed 25.7 -3.6 -12.4 146.0 -17.8 -10.9 Empl. serv. (incl. temp) 14.4 -0.1 -0.7 1.9 New Unempl. Claims 1.6 -0.1 -4.4 Mgmt. & oth. bus serv. 34.4 1.1 3.3 4.6 Sources: U.S. Bureau of Labor Statistics (BLS) & D.C. Dept. of Employment Services (DOES) Education 64.4 4.2 7.0 8.6 a Preliminary, not seasonally adjusted Health care 66.4 1.4 2.2 8.8 Organizations 59.8 -1.3 -2.1 8.0 D.C. Hotel Industry b Airport Passengers c,d Accommodations 15.3 -0.1 -0.6 2.0 Apr. 2014 Amt. 1 yr. ch. Apr. 2014 Amt.('000) 1 yr. ch. (%) Food service 47.6 1.3 2.8 6.3 Occupancy Rate 89.5% -0.1% DCA 1,834.4 3.3 Amuse. & recreation 7.3 -0.2 -2.7 1.0 Avg. Daily Room Rate $231.68 -$16.88 IAD 1,812.4 -0.6 Other services 8.2 0.4 5.1 1.1 # Available Rooms 27,323 -496 BWI 1,919.2 2.7 Subtotal, private 516.1 8.5 1.7 68.8 Room Sales ($M) $170.0 -$15.9 Total 5,566.0 1.8e Federal government 199.4 -6.0 -2.9 26.6 Local government 35.0 1.2 3.6 4.7 b Source: Smith Travel Research c Source: Metropolitan Washington Airports Authority & Maryland Total 750.5 3.7 0.5 100.0 Aviation Administration Authority d Includes arrivals and departures e Weighted average Source: BLS. Details may not add to total due to rounding. FY'13 FY'14 % Chg. FY13-FY14 FY'13 FY'14 % Chg. FY13-FY14 Real Property 980,053 993,314 1.4% 65,827 64,767 -1.6% General Sales 749,372 752,774 0.5% 950,593 999,454 5.1% Individual Income 1,108,012 1,087,032 -1.9% Business Income 302,540 259,907 -14.1% All Deed Taxesc 222,590 246,679 10.8% Total Tax Revenue (Gross) 3,695,038 3,688,346 -0.2% Dedicated Tax Revenue 204,799 232,804 13.7% Total Tax Revenue (Net) 3,490,239 3,455,542 -1.0% All data subject to revision. † Indicates data revised by stated source since previous D.C. Economic Indicators. See past editions at cfo.dc.gov Addenda: Convention Ctr. Transfer b Ind. Inc. Tax Withholding for D.C. residents District of Columbia General Fund: FY2014 Year-to-Date (Oct.-May.) Cash Collections ($000) a Jobs in D.C. for April 2014, up 3,700 (0.5%) from April 2013 District resident employment for April 2014, down 1,400 (0.4%) from April 2013 Labor & Industry FY 2014 (Oct. - May.) Total gross collections declined 0.2% from one year ago FY 2014 (Oct. - May.) Individual income tax collections decreased by 1.9% from one year ago FY 2014 (Oct. - May.) General sales tax collections increased by 0.5% from one year ago FY 2014 (Oct. - May.) All deed tax collections increased by 10.8% from the previous year FY 2014 (Oct. - May.) Real property tax collections increased by 1.4% from the previous year FY 2014 (Oct. - May.) Business tax collections decreased by 14.1% from the previous year Cash Collections D.C. Economic Indicators June 2014 Change in Total Wage and Salary Employment and Employed Residents (percent change from prior year in 3-month moving average) FY 2014 Year-to-Date (Oct.-May.) Cash Collections Compared With Same Period of Previous Year ($000) aRevenue amounts shown are before dedicated revenue (TIF, Convention Ctr, Ballpark Fund, DDOT , the Highway Trust Fund, the Nursing Facility Quality of Care Fund, Healthy DC Fund, the Housing Production Trust Fund,WMATA, Hospital Fund, Stevie Sellows Quality Improvement Fund, Healthy Schools, ABRA). Variations in processing activities may affect year-to-date comparisons. bPortion of sales tax on hotels and restaurants c Includes deed recordation, deed transfer, co-op recordation and economic interest taxes June 2014 Government of the District of Columbia Vincent C. Gray, Mayor Jeffrey S. DeWitt, Chief Financial Officer Dr. Fitzroy Lee, Deputy CFO & Chief Economist -2% 0% 2% 4% 6% 8% Apr.12-Apr.13 Jun.12-Jun.13 Aug.12-Aug.13 Oct.12-Oct.13 Dec.12-Dec.13 Feb.13-Feb.14 Apr.13-Apr.14 Jobs in DC Employed Residents 0 200,000 400,000 600,000 800,000 1,000,000 1,200,000 Real Property Individual Income General Sales Deed Taxes Business Taxes FY 13 FY14
- 2. U.S. GDP CPI Source: BEA 1st Q 2014 4th Q 2013 Mar. 2014 Jan. 2014 Source: Census Nominal 3.4† 4.1 1.5 1.6 *Estimate for: Level % chg. Real 2.0† 2.6 1.6 1.9 2000 572,059 2003 577,844 1.0 2004 579,890 0.4 Personal Income a Unemployment Rate c 2005 582,049 0.4 Source: BEA Apr. 2014 Mar. 2014 2006 583,841 0.3 Total Personal Income 4th Q 2013 3rd Q 2013 6.3 6.7 2007 585,916 0.4 U.S. 1.4 3.6 7.5 7.5 2008 589,929 0.7 D.C. 1.1 2.4 2009 599,975 1.7 Wage & Salary Portion of Personal Income 2010 605,125 0.9 U.S. 2.1 3.8 Interest Rates 2011 619,624 2.4 Earned in D.C. 0.6 1.3 Source: Federal Reserve Apr. 2014 Mar. 2014 2012 633,427 2.2 Earned by D.C. residents b 0.7 1.6 0.11 0.13 2013 646,449 2.1 4.34 4.34 * July 1, except for 2000 a Nominal b Estimated c Seasonally adjusted Distribution of Individual Income Tax Filers † Indicates data revised by stated source since previous D.C. Economic Indicators. by Income Category Source: D.C. Office of Tax and Revenue 2010 2011 2012† Less than $30,000 42.7% 42.0% 41.4% $30,000-$50,000 19.3% 19.0% 18.6% $50,000-$75,000 13.9% 14.0% 14.3% $75,000-$100,000 7.8% 8.0% 8.3% $100,000-$200,000 11.0% 11.3% 11.5% $200,000-$500,000 4.3% 4.5% 4.7% $500,000 and Over 1.1% 1.2% 1.3% Housing Sales D.C. Housing Permits Issued D.C. Commercial Office Space Source: MRISa Source: U.S. Census Bureau Source: Delta Associates 4 Qs ending Completed contracts Apr. 2014 1 yr. % ch. 1st Q 2014 1 yr. ch. 1st Q 2014 1 qtr. ch. Single family 462 2.0 Total housing units 4,137 -58 Inventory Status (in million sq. ft.) Condo/Co-op 438 0.9 Single family 349 18 Total inventory 140.2 3.6 Multifamily (units) 3,788 -76 Leased spacee 129.6 4.9 Vacant 10.7 -2.0 Prices ($000) Class A Apt. d and Condominium Units New Construction 1.1 NA Single family Apr. 2014 1 yr. % ch. Source: Delta Associates Averageb $749.1 15.0 Direct Vacancy Rate 7.6 0.6 Medianc $573.0 8.5 Units under construction and/or marketing 1st Q 2014 1 yr. ch. Rental apartments 12,022 1,637 Condo/Co-op Condominiumsf 653 -278 Averageb $469.5 3.0 Other units likely to deliver over the next 36 monthsg Median c $399.9 -0.02 Rental apartments 7,735 1,445 Condominiums 1,461 225 a Metropolitan Regional Information System as reported by the Greater Capital Area Association of Realtors b Average prices are calculated for the month from year-to-date information c Median prices are year- to-date d Investment grade units, as defined by Delta e Calculated from direct vac. rate f Includes sold units g Only a portion will materialize For additional information contact: Betty Alleyne, Editor; Office of Revenue Analysis ~ 1101 4th St., SW ~ Suite W770 ~ Washington, DC 20024 ~ (202) 727-7775 % change for yr. ending Source: BLS U.S. D.C. Population% change for yr. ending % change for yr. ending National Average Conv. Home Mortgage 1-yr. Treasury D.C./Balt. metro area Source: BLS U.S. D.C. D.C. unemployment rate for Apr.: 7.5%, same as the previous month & 1.0% lower than 1 year ago The conventional home mortgage rate was 4.34% in April, same as the previous month The share of filers with income less than $30,000 declined in TY2012 compared to TY2011; while the shares of those filers in the $200,000 to $500,000 and $500,000 and over income categories increased relative to the previous tax year People & Economy There were 438 condos sold in April 2014, a 0.9% increase from 1 year ago The year to date median price increased 8.5% from 1 year ago for single family homes, and condos experienced a negligible decrease of 0.02% in the year to date median price In the 1st quarter of 2014 the direct vacancy rate increased by 0.6% from the 4th quarter of 2013 Housing & Office Space D.C. Economic Indicators Year Over Year Percent Change in the Median Price for a Single Family Home and Condominium in Washington, D.C. One-Year Treasury and Conventional Home Mortgage Interest Rates April 2012 to April 2014 June 2014 0% 1% 2% 3% 4% 5% 1-Year Treasury Conventional Home Mortgage -30% -20% -10% 0% 10% 20% Apr.09-Apr.10 Apr.10-Apr.11 Apr.11-Apr.12 Apr.12-Apr.13 Apr.13-Apr.14 Median Price_Single Family Home Median Price_Condominium