SlideShare ist ein Scribd-Unternehmen logo
1 von 13
Downloaden Sie, um offline zu lesen
Page 1 of 13
THE 2016 KENYA CERTIFICATE OF SECONDARY EDUCATION
(KCSE) EXAMINATION ESSENTIAL STATISTICS
1.0 TABLE 1: NUMBER OF EXAMINATION CENTRES AND CANDIDATURE
FOR THE KCSE EXAMINATION FROM 2010 TO 2016
YEAR NUMBER OF
CENTRES
CANDIDATURE
TOTAL INCREASE/
DECREASE (%)
MALE FEMALE
TOTAL
(%)
INCREASE/
DECREASE (%)
TOTAL
(%)
INCREASE/
DECREASE (%)
2016 9,154 574,125 51,255
(9.80%)
300,995
(52.43%)
21,706
(7.77%)
273,130
(47.57%)
29,549
(12.13%)
2015 8,646 522,870 39,240
(8.11%)
279,289
(53.41%)
19,543
(7.52%)
243,581
(46.59%)
19,697
(8.80%)
2014 8,057 483,630 36,934
(8.27%)
259,746
(53.71%)
16,078
(6.60%)
223,884
(46.29%)
20,856
(10.27%)
2013 7,608 446,696 10,347
(2.37%)
243,668
(54.55%)
2,529
(1.05%)
203,028
(45.45%)
7,818
(4.00%)
2012 6,968 436,349 24,566
(5.97%)
241,139
(55.26%)
11,968
(5.22%)
195,210
(44.74%)
12,598
(6.90%)
2011 6,448 411,783 54,295
(15.19%)
229,171
(55.65%)
31,071
(15.68%)
182,612
(44.35%)
23,224
(14.57%)
2010 6,004 357,488 20,084
(5.95%)
198,100
(55.41%)
13,537
(7.33%)
159,388
(44.59%)
6,547
(4.28%)
FIGURE 1: KCSE Candidature Trends for the Last Seven years
2.0 TABLE 2: 2016 AND 2015 KCSE EXAMINATION CANDIDATURE
DISTRIBUTION BY COUNTY
_______________________________________________________________________________________________________________________________________________________________________________________
The 2016 Kenya Certificate of Secondary Education (KCSE) Examination Essential Statistics
Page 2 of 13
COUNTY CODE & NAME
2016 2015
FEMALE MALE TOTAL FEMALE MALE TOTAL
CAND.
(%)
CAND.
(%)
CAND.
(%)
CAND.
(%)
CAND.
(%)
CAND.
(%)
1. 01
Taita Taveta
2,767
(0.482 %)
2,470
(0.430 %)
5,237
(0.912 %)
2,307
(0.441%)
2,305
(0.441%)
4,612
(0.882 %)
2. 02
Kwale
3,015
(0.525 %)
2,964
(0.516 %)
5,979
(1.041 %)
2,723
(0.521%)
2,919
(0.558%)
5,642
(1.079%)
3. 03
Mombasa
3,761
(0.655 %)
4,412
(0.768 %)
8,173
(1.424 %)
3,283
(0.628%)
4,067
(0.778%)
7,350
(1.406%)
4. 04
Kilifi
5,038
(0.878 %)
6,515
(1.135 %)
11,553
(2.012 %)
4,515
(0.864%)
6,071
(1.161%)
10,586
(2.025%)
5. 05
Tana River
500
(0.087 %)
888
(0.155 %)
1,388
(0.242 %)
399
(0.076%)
756
(0.145%)
1,155
(0.221%)
6. 06
Lamu
533
(0.093 %)
746
(0.130 %)
1,279
(0.223 %)
507
(0.097%)
781
(0.149%)
1,288
(0.246%)
7. 07
Nyandarua
6,351
(1.106 %)
6,257
(1.090 %)
12,608
(2.196 %)
5,786
(1.107%)
5,736
(1.097%)
11,522
(2.204%)
8. 08
Nyeri
8,409
(1.465 %)
8,104
(1.412 %)
16,513
(2.876 %)
7,947
(1.520%)
7,943
(1.519%)
15,890
(3.039%)
9. 09
Kirinyaga
5,403
(0.941 %)
4,998
(0.871 %)
10,401
(1.812 %)
4,676
(0.894%)
4,409
(0.843%)
9,085
(1.738%)
10. 10
Murang'a
11,814
(2.058 %)
11,728
(2.043 %)
23,542
(4.101 %)
11,629
(2.224%)
11,457
(2.191%)
23,086
(4.415%)
11. 11
Kiambu
14,575
(2.539 %)
13,700
(2.386 %)
28,275
(4.925 %)
14,251
(2.726%)
13,738
(2.627%)
27,989
(5.353%)
12. 12
Machakos
11,319
(1.972 %)
11,487
(2.001 %)
22,806
(3.972 %)
10,271
(1.964%)
10,886
(2.082%)
21,157
(4.046%)
13. 13
Kitui
8,508
(1.482 %)
8,540
(1.487 %)
17,048
(2.969 %)
7,160
(1.369%)
7,827
(1.497%)
14,987
(2.866%)
14. 14
Embu
4,930
(0.859 %)
5,347
(0.931 %)
10,277
(1.790 %)
4,439
(0.849%)
4,682
(0.895%)
9,121
(1.744%)
15. 15
Meru
10,565
(1.840 %)
9,932
(1.730 %)
20,497
(3.570 %)
9,552
(1.827%)
9,193
(1.758%)
18,745
(3.585%)
16. 16
Marsabit
625
(0.109 %)
794
(0.138 %)
1,419
(0.247 %)
548
(0.105%)
719
(0.138%)
1,267
(0.242%)
17. 17
Isiolo
467
(0.081 %)
670
(0.117 %)
1,137
(0.198 %)
438
(0.084%)
563
(0.108%)
1,001
(0.191%)
18. 18
Makueni
10,462
(1.822 %)
10,850
(1.890 %)
21,312
(3.712 %)
9,385
(1.795%)
9,728
(1.861%)
19,113
(3.655%)
19. 19
Tharaka Nithi
4,329
(0.754 %)
4,138
(0.721 %)
8,467
(1.475 %)
4,233
(0.810%)
3,986
(0.762%)
8,219
(1.572%)
20. 20
Nairobi
12,302
(2.143 %)
13,388
(2.332 %)
25,690
(4.475 %)
11,466
(2.193%)
12,577
(2.405%)
24,043
(4.598%)
21. 21
Turkana
1,218
(0.212 %)
2,325
(0.405 %)
3,543
(0.617 %)
881
(0.168%)
1,887
(0.361%)
2,768
(0.529%)
22. 22
Samburu
604
(0.105 %)
1,071
(0.187 %)
1,675
(0.292 %)
543
(0.104%)
947
(0.181%)
1,490
(0.285%)
23. 23
Trans Nzoia
5,636
(0.982 %)
6,814
(1.187 %)
12,450
(2.169 %)
4,900
(0.937%)
6,006
(1.149%)
10,906
(2.086%)
24. 24
West Pokot
2,343
(0.408 %)
2,808
(0.489 %)
5,151
(0.897 %)
1,774
(0.339%)
2,466
(0.472%)
4,240
(0.811%)
25. 25
Bomet
6,501
(1.132 %)
7,524
(1.311 %)
14,025
(2.443 %)
4,977
(0.952%)
6,448
(1.233%)
11,425
(2.185%)
26. 26
Uasin Gishu
6,762
(1.178 %)
6,533
(1.138 %)
13,295
(2.316 %)
5,758
(1.101%)
5,894
(1.127%)
11,652
(2.228%)
27. 27
Nakuru
15,363
(2.676 %)
16,249
(2.830 %)
31,612
(5.506 %)
13,753
(2.630%)
15,053
(2.879%)
28,806
(5.509%)
28. 28
Kericho
6,247
(1.088 %)
7,351
(1.280 %)
13,598
(2.368 %)
5,367
(1.026%)
6,541
(1.251%)
11,908
(2.277%)
29. 29
Nandi
6,136
(1.069 %)
6,454
(1.124 %)
12,590
(2.193 %)
5,002
(0.957%)
5,448
(1.042%)
10,450
(1.999%)
30. 30 3,505 3,691 7,196 3,054 3,481 6,535
_______________________________________________________________________________________________________________________________________________________________________________________
The 2016 Kenya Certificate of Secondary Education (KCSE) Examination Essential Statistics
Page 3 of 13
COUNTY CODE & NAME
2016 2015
FEMALE MALE TOTAL FEMALE MALE TOTAL
CAND.
(%)
CAND.
(%)
CAND.
(%)
CAND.
(%)
CAND.
(%)
CAND.
(%)
Laikipia (0.610 %) (0.643 %) (1.253 %) (0.584%) (0.666%) (1.250%)
31. 31
Kajiado
3,489
(0.608 %)
4,021
(0.700 %)
7,510
(1.308 %)
3,156
(0.604%)
3,472
(0.664%)
6,628
(1.268%)
32. 32
Narok
2,449
(0.427 %)
3,456
(0.602 %)
5,905
(1.029 %)
2,272
(0.435%)
3,269
(0.625%)
5,541
(1.060%)
33. 33
Baringo
4,254
(0.741 %)
4,457
(0.776 %)
8,711
(1.517 %)
3,532
(0.676%)
4,069
(0.778%)
7,601
(1.454%)
34. 34
Elgeyo Marakwet
3,664
(0.638 %)
3,759
(0.655 %)
7,423
(1.293 %)
2,973
(0.569%)
3,096
(0.592 %)
6,069
(1.161%)
35. 35
Busia
4,474
(0.779 %)
5,669
(0.987 %)
10,143
(1.767 %)
3,847
(0.736%)
4,957
(0.948%)
8,804
(1.684%)
36. 36
Bungoma
10,927
(1.903 %)
12,440
(2.167 %)
23,367
(4.070 %)
9,786
(1.872%)
11,776
(2.252%)
21,562
(4.124%)
37. 37
Kakamega
12,831
(2.235 %)
13,763
(2.397 %)
26,594
(4.632 %)
11,379
(2.176%)
12,747
(2.438%)
24,126
(4.614%)
38. 38
Vihiga
6,417
(1.118 %)
5,928
(1.033 %)
12,345
(2.150 %)
5,687
(1.088%)
5,760
(1.102%)
11,447
(2.189%)
39. 39
Kisumu
7,765
(1.352 %)
8,335
(1.452 %)
16,100
(2.804 %)
6,628
(1.268%)
7,683
(1.469%)
14,311
(2.737%)
40. 40
Kisii
9,473
(1.650 %)
12,255
(2.135 %)
21,728
(3.785 %)
9,010
(1.723%)
12,490
(2.389%)
21,500
(4.112%)
41. 41
Homa Bay
6,973
(1.215 %)
9,541
(1.662 %)
16,514
(2.876 %)
5,956
(1.139%)
8,716
(1.667%)
14,672
(2.806%)
42. 42
Siaya
7,000
(1.219 %)
8,349
(1.454 %)
15,349
(2.673 %)
5,790
(1.107%)
7,486
(1.432%)
13,276
(2.539%)
43. 43
Nyamira
4,511
(0.786 %)
5,258
(0.916 %)
9,769
(1.702 %)
4,243
(0.811%)
5,269
(1.008%)
9,512
(1.819%)
44. 44
Migori
5,840
(1.017 %)
8,066
(1.405 %)
13,906
(2.422 %)
5,092
(0.974%)
7,275
(1.391%)
12,367
(2.365%)
45. 45
Garissa
1,126
(0.196 %)
2,834
(0.494 %)
3,960
(0.690 %)
1,109
(0.212%)
2,708
(0.518%)
3,817
(0.730%)
46. 46
Wajir
831
(0.145 %)
1,758
(0.306 %)
2,589
(0.451 %)
669
(0.128%)
1,709
(0.327%)
2,378
(0.455%)
47. 47
Mandera
1,118
(0.195 %)
2,358
(0.411 %)
3,476
(0.605 %)
928
(0.177%)
2,293
(0.439%)
3,221
(0.616%)
TOTAL 273,130
(47.57%)
300,995
(52.43%)
574,125
(100.00%)
243,581
(46.59%)
279,289
(53.41%)
522,870
(100.00%)
_______________________________________________________________________________________________________________________________________________________________________________________
The 2016 Kenya Certificate of Secondary Education (KCSE) Examination Essential Statistics
Page 4 of 13
TABLE 3: 2016 AND 2015 KCSE EXAMINATION CANDIDATURE DISTRIBUTION BY AGE
County Code &
Name
CANDIDATES’ AGE
2016 2015 2016 2015 2016 2015 2016 2015 2016 2015 2016 2015 2016
TOTAL
(%)
2015
TOTAL
(%)
<=16
(%)
17 & 18
(%)
19 & 20
(%)
21 & 22
(%)
>=23
(%)
UNSPECIFIED
(%)
01 Taita
Taveta
42
0.007 %
38
(0.007%)
1869
0.324 %
1542
(0.293%)
2414
0.418 %
2043
(0.389%)
751
0.130 %
793
(0.151%)
189
0.033 %
214
(0.041%) 0.000 %
2
(0.000%)
5265
0.912 %
4632
(0.881%)
02 Kwale 25
0.004 %
31
(0.006%)
1097
0.190 %
1026
(0.195%)
2625
0.455 %
2374
(0.452 )
1719
0.298 %
1764
(0.335%)
529
0.092 %
463
(0.088%)
2
0.000 %
4
(0.001%)
5997
1.039 %
5662
(1.077%)
03 Mombasa 45
0.008 %
51
(0.010%)
2547
0.441 %
2267
(0.431%)
3760
0.651 %
3224
(0.613 )
1320
0.229 %
1363
(0.259%)
542
0.094 %
485
(0.092%)
3
0.001 %
11
(0.002%)
8217
1.423 %
7401
(1.408%)
04 Kilifi 32
0.006 %
45
(0.009%)
1887
0.327 %
1754
(0.334%)
4852
0.841 %
4230
(0.805 )
3418
0.592 %
3450
(0.656%)
1403
0.243 %
1151
(0.219%)
2
0.000 %
8
(0.002%)
11594
2.008 %
10638
(2.023%)
05 Tana River 24
0.004 %
16
(0.003%)
420
0.073 %
350
(0.067%)
610
0.106 %
552
(0.105 )
269
0.047 %
186
(0.035%)
75
0.013 %
63
(0.012%) 0.000 % (0.000%)
1398
0.242 %
1167
(0.222%)
06 Lamu 5
0.001 %
12
(0.002%)
260
0.045 %
248
(0.047%)
588
0.102 %
562
(0.107 )
326
0.056 %
365
(0.069%)
100
0.017 %
108
(0.021%) 0.000 %
2
(0.000%)
1279
0.222 %
1297
(0.247%)
07 Nyandarua 171
0.030 %
146
(0.028%)
5341
0.925 %
4623
(0.879%)
5666
0.982 %
5341
(1.016%)
1356
0.235 %
1301
(0.247%)
170
0.029 %
189
(0.036%)
8
0.001 %
11
(0.002%)
12712
2.202 %
11611
(2.208%)
08 Nyeri 185
0.032 %
165
(0.031%)
7836
1.357 %
7205
(1.370%)
6977
1.209 %
6939
(1.320%)
1308
0.227 %
1358
(0.258%)
289
0.050 %
302
(0.057%)
9
0.002 %
25
(0.005%)
16604
2.876 %
15994
(3.042%)
09 Kirinyaga 220
0.038 %
189
(0.036%)
4580
0.793 %
3814
(0.725%)
4219
0.731 %
3707
(0.705%)
1163
0.201 %
1106
(0.210%)
291
0.050 %
316
(0.060%)
2
0.000 %
11
(0.002%)
10475
1.815 %
9143
(1.739%)
10 Murang'a 395
0.068 %
372
(0.071%)
11796
2.043 %
10831
(2.060%)
9292
1.610 %
9361
(1.780%)
1905
0.330 %
2257
(0.429%)
303
0.052 %
410
(0.078%)
7
0.001 %
31
(0.006%)
23698
4.105 %
23262
(4.424%)
11 Kiambu 423
0.073 %
391
(0.074%)
16487
2.856 %
15440
(2.937%)
9504
1.646 %
10103
(1.922%)
1530
0.265 %
1676
(0.319%)
502
0.087 %
533
(0.101%)
22
0.004 %
61
(0.012%)
28468
4.932 %
28204
(5.364%)
12 Machakos 239
0.041 %
216
(0.041%)
7951
1.377 %
6630
(1.261%)
10405
1.802 %
10018
(1.905%)
3615
0.626 %
3673
(0.699%)
675
0.117 %
676
(0.129%)
27
0.005 %
64
(0.012%)
22912
3.969 %
21277
(4.047%)
13 Kitui 252
0.044 %
235
(0.045%)
4994
0.865 %
3935
(0.748%)
7848
1.360 %
6880
(1.309%)
3356
0.581 %
3381
(0.643%)
651
0.113 %
596
(0.113%)
4
0.001 %
26
(0.005%)
17105
2.963 %
15053
(2.863%)
14 Embu 167
0.029 %
131
(0.025%)
4062
0.704 %
3532
(0.672%)
4165
0.722 %
3763
(0.716%)
1566
0.271 %
1367
(0.260%)
357
0.062 %
384
(0.073%)
4
0.001 %
13
(0.002%)
10321
1.788 %
9190
(1.748%)
15 Meru 278
0.048 %
223
(0.042%)
6702
1.161 %
5609
(1.067%)
9037
1.566 %
8433
(1.604%)
3540
0.613 %
3456
(0.657%)
1017
0.176 %
1062
(0.202%)
27
0.005 %
82
(0.016%)
20601
3.569 %
18865
(3.588%)
16 Marsabit 14
0.002 %
16
(0.003%)
622
0.108 %
528
(0.100%)
589
0.102 %
542
(0.103%)
153
0.027 %
145
(0.028%)
43
0.007 %
44
(0.008%) 0.000 %
0
(0.000%)
1421
0.246 %
1275
(0.242%)
17 Isiolo 12
0.002 %
13
(0.003%
383
0.066 %
290
(0.055%)
527
0.091 %
503
(0.096%)
165
0.029 %
161
(0.031%)
58
0.010 %
40
(0.008%) 0.000 %
0
(0.000%)
1145
0.198 %
1011
(0.192%)
18 Makueni 383
0.066 %
202
(0.042%)
7139
1.237 %
5700
(1.084%)
9782
1.695 %
9195
(1.749%)
3608
0.625 %
3521
(0.670%)
502
0.087 %
493
(0.094%)
3
0.001 %
28
(0.005%)
21417
3.710 %
19215
(3.655%)
19 Tharaka
Nithi
116
0.020 %
113
(0.021%)
3121
0.541 %
2904
(0.552%)
3526
0.611 %
3515
(0.669%)
1367
0.237 %
1296
(0.246%)
394
0.068 %
461
(0.088%)
5
0.001 %
8
(0.002%)
8529
1.478 %
8297
(1.578%)
20 Nairobi 366
0.063 %
322
(0.061%)
12006
2.080 %
10818
(2.057%)
9136
1.583 %
8852
(1.684%)
2544
0.441 %
2449
(0.466%)
1888
0.327 %
1804
(0.343%)
19
0.003 %
46
(0.009%)
25959
4.497 %
24291
(4.620%)
21 Turkana 16
0.003 %
32
(0.006%)
690
0.120 %
579
(0.110%)
1316
0.228 %
1040
(0.198%)
818
0.142 %
620
(0.118%)
730
0.126 %
519
(0.099%)
5
0.001 %
4
(0.001%)
3575
0.619 %
2794
(0.531%)
22 Samburu 31 24 623 484 680 637 251 242 91 111 1 1677 1498
__________________________________________________________________________________________________________________________________________________________________________________________
The 2016 Kenya Certificate of Secondary Education (KCSE) Examination Essential Statistics
Page 5 of 13
County Code &
Name
CANDIDATES’ AGE
2016 2015 2016 2015 2016 2015 2016 2015 2016 2015 2016 2015 2016
TOTAL
(%)
2015
TOTAL
(%)
<=16
(%)
17 & 18
(%)
19 & 20
(%)
21 & 22
(%)
>=23
(%)
UNSPECIFIED
(%)
0.005 % (0.005%) 0.108 % (0.092%) 0.118 % (0.121%) 0.043 % (0.046%) 0.016 % (0.021%) 0.000 % (0.000%) 0.291 % (0.285%)
23 Trans
Nzoia
281
0.049 %
189
(0.036%)
4070
0.705 %
3182
(0.605%)
5163
0.894 %
4703
(0.894%)
2313
0.401 %
2247
(0.427%)
675
0.117 %
612
(0.116%)
6
0.001 %
18
(0.003%)
12508
2.167 %
10951
(2.083%)
24 West Pokot 70
0.012 %
38
(0.007%)
1530
0.265 %
799
(0.152%)
2063
0.357 %
1941
(0.369%)
1089
0.189 %
1112
(0.211%)
430
0.074 %
380
(0.072%) 0.000 %
5
(0.001%)
5182
0.898 %
4275
(0.813%)
25 Bomet 925
0.160 %
697
(0.133%)
7325
1.269 %
5394
(1.026%)
4404
0.763 %
4134
(0.786%)
1153
0.200 %
1010
(0.192%)
258
0.045 %
221
(0.042%)
7
0.001 %
8
(0.002%)
14072
2.438 %
11464
(2.180%)
26 Uasin
Gishu
280
0.049 %
180
(0.034%)
5210
0.903 %
4058
(0.772%)
5318
0.921 %
4983
(0.948%)
2012
0.349 %
1995
(0.379%)
526
0.091 %
469
(0.089%)
3
0.001 %
15
(0.003%)
13349
2.313 %
11700
(2.22 %)
27 Nakuru 504
0.087 %
369
(0.070%)
13959
2.418 %
11912
(2.266%)
13038
2.259 %
12335
(2.346%)
3468
0.601 %
3497
(0.665%)
786
0.136 %
800
(0.152%)
20
0.003 %
43
(0.008%)
31775
5.505 %
28956
(5.507%)
28 Kericho 838
0.145 %
499
(0.095%)
6551
1.135 %
5257
(1.000%)
4585
0.794 %
4583
(0.872%)
1321
0.229 %
1287
(0.245%)
340
0.059 %
315
(0.060%)
4
0.001 %
11
(0.002%)
13639
2.363 %
11952
(2.273%)
29 Nandi 226
0.039 %
160
(0.030%)
4034
0.699 %
3121
(0.594%)
5257
0.911 %
4572
(0.870%)
2493
0.432 %
2105
(0.400%)
639
0.111 %
521
(0.099%)
3
0.001 %
38
(0.007%)
12652
2.192 %
10517
(2.000%)
30 Laikipia 68
0.012 %
84
(0.016%)
2823
0.489 %
2425
(0.461%)
3234
0.560 %
2980
(0.567%)
933
0.162 %
865
(0.165%)
175
0.030 %
201
(0.038%)
4
0.001 %
21
(0.004%)
7237
1.254 %
6576
(1.251%)
31 Kajiado 152
0.026 %
119
(0.023%)
2838
0.492 %
2423
(0.461%)
3021
0.523 %
2713
(0.516%)
1097
0.190 %
966
(0.184%)
456
0.079 %
433
(0.082%)
5
0.001 %
19
(0.004%)
7569
1.311 %
6673
(1.269%)
32 Narok 212
0.037 %
180
(0.034%)
2583
0.447 %
2218
(0.422%)
2244
0.389 %
2280
(0.434%)
737
0.128 %
708
(0.135%)
166
0.029 %
179
(0.034%)
4
0.001 %
8
(0.002%)
5946
1.030 %
5573
(1.060%)
33 Baringo 397
0.069 %
301
(0.057%)
4798
0.831 %
3884
(0.739%)
2753
0.477 %
2719
(0.517%)
606
0.105 %
570
(0.108%)
193
0.033 %
148
(0.028%)
3
0.001 %
8
(0.002%)
8750
1.516 %
7630
(1.451%)
34 Elgeyo
Marakwet
165
0.029 %
183
(0.035%)
3569
0.618 %
2740
(0.521%)
2780
0.482 %
2317
(0.441%)
763
0.132 %
707
(0.134%)
151
0.026 %
140
(0.027%)
12
0.002 %
5
(0.001%)
7440
1.289 %
6092
(1.159%)
35 Busia 161
0.028 %
174
(0.033%)
2735
0.474 %
2078
(0.395%)
4154
0.720 %
3798
(0.722%)
2429
0.421 %
2171
(0.413%)
692
0.120 %
600
(0.114%)
3
0.001 %
9
(0.00 %)
10174
1.762 %
8830
(1.679%)
36 Bungoma 796
0.138 %
590
(0.112%)
8345
1.446 %
6473
(1.231%)
9105
1.577 %
8937
(1.700%)
4084
0.707 %
4480
(0.852%)
1094
0.190 %
1099
(0.209%)
13
0.002 %
25
(0.005%)
23437
4.060 %
21604
(4.109%)
37 Kakamega 495
0.086 %
376
(0.072%)
8068
1.398 %
6527
(1.241%)
11310
1.959 %
10678
(2.031%)
5566
0.964 %
5406
(1.028%)
1240
0.215 %
1189
(0.226%)
8
0.001 %
17
(0.003%)
26687
4.623 %
24193
(4.601%)
38 Vihiga 182
0.032 %
130
(0.025%)
4358
0.755 %
3737
(0.711%)
5406
0.937 %
5112
(0.972%)
2040
0.353 %
2092
(0.398%)
394
0.068 %
400
(0.076%)
3
0.001 %
11
(0.002%)
12383
2.145 %
11482
(2.184%)
39 Kisumu 291
0.050 %
245
(0.047%)
5557
0.963 %
4601
(0.875%)
6899
1.195 %
6261
(1.191%)
2628
0.455 %
2565
(0.488%)
742
0.129 %
659
(0.125%)
50
0.009 %
27
(0.005%)
16167
2.801 %
14358
(2.731%)
40 Kisii 1194
0.207 %
689
(0.131%)
9310
1.613 %
8249
(1.569%)
7832
1.357 %
8744
(1.663%)
2775
0.481 %
3075
(0.585%)
811
0.140 %
802
(0.153%)
22
0.004 %
57
(0.011%)
21944
3.801 %
21616
(4.111%)
41 Homa Bay 589
0.102 %
428
(0.081%)
6394
1.108 %
4969
(0.945%)
6380
1.105 %
6145
(1.169%)
2525
0.437 %
2489
(0.473%)
706
0.122 %
682
(0.130%)
10
0.002 %
26
(0.005%)
16604
2.876 %
14739
(2.803%)
42 Siaya 233
0.040 %
162
(0.031%)
5108
0.885 %
4104
(0.781%)
6616
1.146 %
5860
(1.115%)
2790
0.483 %
2630
(0.500%)
682
0.118 %
558
(0.106%) 0.000 %
9
(0.002%)
15429
2.673 %
13323
(2.534%)
43 Nyamira 521
0.090 %
373
(0.071%)
4386
0.760 %
3658
(0.696%)
3477
0.602 %
3990
(0.759%)
1159
0.201 %
1285
(0.244%)
262
0.045 %
216
(0.041%)
10
0.002 %
34
(0.006%)
9815
1.700 %
9556
(1.817%)
44 Migori 573
0.099 %
410
(0.078%)
5549
0.961 %
4349
(0.827%)
5154
0.893 %
5037
(0.958%)
2036
0.353 %
2065
(0.393%)
668
0.116 %
590
(0.112%)
8
0.001 %
12
(0.002%)
13988
2.423 %
12463
(2.370%)
45 Garissa 36 33 937 889 1262 1358 800 745 996 835 1 2 4032 3862
_______________________________________________________________________________________________________________________________________________________________________________________
The 2016 Kenya Certificate of Secondary Education (KCSE) Examination Essential Statistics
Page 6 of 13
County Code &
Name
CANDIDATES’ AGE
2016 2015 2016 2015 2016 2015 2016 2015 2016 2015 2016 2015 2016
TOTAL
(%)
2015
TOTAL
(%)
<=16
(%)
17 & 18
(%)
19 & 20
(%)
21 & 22
(%)
>=23
(%)
UNSPECIFIED
(%)
0.006 % (0.006%) 0.162 % (0.169%) 0.219 % (0.258%) 0.139 % (0.142%) 0.173 % (0.159%) 0.000 % (0.000%) 0.698 % (0.735%)
46 Wajir 79
0.014 %
58
(0.011%)
1081
0.187 %
897
(0.171%)
1058
0.183 %
1008
(0.192%)
258
0.045 %
297
(0.056%)
138
0.024 %
132
(0.025%)
1
0.000 % (0.000%)
2615
0.453 %
2392
(0.455%)
47 Mandera 58
0.010 %
59
(0.011%)
1193
0.207 %
1057
(0.201%)
1371
0.238 %
1331
(0.253%)
654
0.113 %
623
(0.118%)
214
0.037 %
160
(0.030%)
1
0.000 %
3
(0.001%)
3491
0.605 %
3233
(0.615%)
Totals 12,767
2.21 %
9,789
(1.86%)
224,724
38.93 %
189,110
(35.97%)
231,402
40.09%
220,333
(41.91%)
83,777
14.51 %
82,922
(15.77%)
24,233
4.20%
22,765
(4.33%)
351
0.06%
868
(0.16%)
577,254
100.00 %
525,787
(100.00%)
_______________________________________________________________________________________________________________________________________________________________________________________
The 2016 Kenya Certificate of Secondary Education (KCSE) Examination Essential Statistics
Page 7 of 13
TABLE 4: 2016 KCSE EXAMINATION CENTRES BY COUNTY AND CATEGORY OF
SCHOOLS
County Code
& Name
National County Extra
County
Sub County Private All
01 Taita
Taveta
2
(0.022 %)
8
(0.087 %)
6
(0.066 %)
57
(0.623 %)
12
(0.131 %)
85
0.929 %
02 Kwale 2
(0.022 %)
11
(0.120 %)
2
(0.022 %)
56
(0.612 %)
12
(0.131 %)
83
0.907 %
03 Mombasa 2
(0.022 %)
30
(0.328 %) (0.000 %)
9
(0.098 %)
85
(0.929 %)
126
1.376 %
04 Kilifi 3
(0.033 %)
14
(0.153 %)
3
(0.033 %)
112
(1.224 %)
54
(0.590 %)
186
2.032 %
05 Tana River 2
(0.022 %)
5
(0.055 %)
1
(0.011 %)
9
(0.098 %)
5
(0.055 %)
22
0.240 %
06 Lamu 2
(0.022 %)
1
(0.011 %) (0.000 %)
18
(0.197 %)
5
(0.055 %)
26
0.284 %
07 Nyandarua 2
(0.022 %)
10
(0.109 %)
6
(0.066 %)
137
(1.497 %)
50
(0.546 %)
205
2.239 %
08 Nyeri 3
(0.033 %)
11
(0.120 %)
16
(0.175 %)
184
(2.010 %)
27
(0.295 %)
241
2.633 %
09 Kirinyaga 2
(0.022 %)
23
(0.251 %)
6
(0.066 %)
101
(1.103 %)
18
(0.197 %)
150
1.639 %
10 Murang'a 3
(0.033 %)
16
(0.175 %)
18
(0.197 %)
263
(2.873 %)
28
(0.306 %)
328
3.583 %
11 Kiambu 9
(0.098 %)
16
(0.175 %)
13
(0.142 %)
235
(2.567 %)
108
(1.180 %)
381
4.162 %
12 Machakos 3
(0.033 %)
27
(0.295 %)
13
(0.142 %)
291
(3.179 %)
81
(0.885 %)
415
4.534 %
13 Kitui 2
(0.022 %)
65
(0.710 %)
7
(0.076 %)
281
(3.070 %)
13
(0.142 %)
368
4.020 %
14 Embu 2
(0.022 %)
20
(0.218 %)
17
(0.186 %)
141
(1.540 %)
18
(0.197 %)
198
2.163 %
15 Meru 3
(0.033 %)
76
(0.830 %)
14
(0.153 %)
257
(2.808 %)
27
(0.295 %)
377
4.118 %
16 Marsabit 2
(0.022 %)
9
(0.098 %) (0.000 %)
16
(0.175 %)
6
(0.066 %)
33
0.360 %
17 Isiolo 2
(0.022 %) (0.000 %)
2
(0.022 %)
11
(0.120 %)
7
(0.076 %)
22
0.240 %
18 Makueni 2
(0.022 %)
39
(0.426 %)
4
(0.044 %)
310
(3.386 %)
21
(0.229 %)
376
4.107 %
19 Tharakanithi 2
(0.022 %)
34
(0.371 %)
14
(0.153 %)
87
(0.950 %)
12
(0.131 %)
149
1.628 %
20 Nairobi 7
(0.076 %)
61
(0.666 %)
9
(0.098 %)
13
(0.142 %)
246
(2.687 %)
337
3.681 %
21 Turkana 2
(0.022 %)
6
(0.066 %) (0.000 %)
24
(0.262 %)
9
(0.098 %)
41
0.448 %
22 Samburu 2
(0.022 %)
6
(0.066 %)
1
(0.011 %)
10
(0.109 %)
6
(0.066 %)
25
0.273 %
23 Trans Nzoia 2
(0.022 %)
22
(0.240 %)
8
(0.087 %)
145
(1.584 %)
27
(0.295 %)
204
2.229 %
24 West Pokot 2
(0.022 %)
33
(0.360 %)
3
(0.033 %)
37
(0.404 %)
5
(0.055 %)
80
0.874 %
25 Bomet 3
(0.033 %)
26
(0.284 %)
6
(0.066 %)
176
(1.923 %)
9
(0.098 %)
220
2.403 %
26 Uasin Gishu 1
(0.011 %)
13
(0.142 %)
10
(0.109 %)
148
(1.617 %)
50
(0.546 %)
222
2.425 %
27 Nakuru 5
(0.055 %)
7
(0.076 %)
16
(0.175 %)
266
(2.906 %)
169
(1.846 %)
463
5.058 %
__________________________________________________________________________________________________________________________________________________________________________________________
The 2016 Kenya Certificate of Secondary Education (KCSE) Examination Essential Statistics
Page 8 of 13
County Code
& Name
National County Extra
County
Sub County Private All
28 Kericho 3
(0.033 %)
27
(0.295 %)
11
(0.120 %)
143
(1.562 %)
12
(0.131 %)
197
2.152 %
29 Nandi 3
(0.033 %)
28
(0.306 %)
4
(0.044 %)
174
(1.901 %)
10
(0.109 %)
219
2.392 %
30 Laikipia 2
(0.022 %)
12
(0.131 %)
1
(0.011 %)
82
(0.896 %)
19
(0.208 %)
116
1.267 %
31 Kajiado 2
(0.022 %)
7
(0.076 %)
1
(0.011 %)
58
(0.634 %)
82
(0.896 %)
150
1.639 %
32 Narok 2
(0.022 %)
7
(0.076 %)
2
(0.022 %)
91
(0.994 %)
11
(0.120 %)
113
1.234 %
33 Baringo 1
(0.011 %)
37
(0.404 %)
8
(0.087 %)
97
(1.060 %)
11
(0.120 %)
154
1.682 %
34 Elgeyo
Marakwet
2
(0.022 %)
23
(0.251 %)
9
(0.098 %)
71
(0.776 %)
4
(0.044 %)
109
1.191 %
35 Busia 3
(0.033 %)
13
(0.142 %)
7
(0.076 %)
116
(1.267 %)
8
(0.087 %)
147
1.606 %
36 Bungoma 3
(0.033 %)
30
(0.328 %)
8
(0.087 %)
257
(2.808 %)
20
(0.218 %)
318
3.474 %
37 Kakamega 4
(0.044 %)
25
(0.273 %)
14
(0.153 %)
318
(3.474 %)
29
(0.317 %)
390
4.260 %
38 Vihiga 2
(0.022 %)
14
(0.153 %)
7
(0.076 %)
123
(1.344 %)
7
(0.076 %)
153
1.671 %
39 Kisumu 3
(0.033 %)
18
(0.197 %)
13
(0.142 %)
178
(1.945 %)
29
(0.317 %)
241
2.633 %
40 Kisii 3
(0.033 %)
38
(0.415 %)
18
(0.197 %)
286
(3.124 %)
27
(0.295 %)
372
4.064 %
41 Homa Bay 2
(0.022 %)
25
(0.273 %)
11
(0.120 %)
259
(2.829 %)
28
(0.306 %)
325
3.550 %
42 Siaya 4
(0.044 %)
24
(0.262 %)
10
(0.109 %)
170
(1.857 %)
6
(0.066 %)
214
2.338 %
43 Nyamira 2
(0.022 %)
19
(0.208 %)
3
(0.033 %)
163
(1.781 %)
10
(0.109 %)
197
2.152 %
44 Migori 3
(0.033 %)
21
(0.229 %)
9
(0.098 %)
175
(1.912 %)
24
(0.262 %)
232
2.534 %
45 Garissa 2
(0.022 %)
11
(0.120 %) (0.000 %)
11
(0.120 %)
29
(0.317 %)
53
0.579 %
46 Wajir 2
(0.022 %)
7
(0.076 %) (0.000 %)
30
(0.328 %)
5
(0.055 %)
44
0.481 %
47 Mandera 2
(0.022 %)
13
(0.142 %) (0.000 %)
20
(0.218 %)
12
(0.131 %)
47
0.513 %
Total 124
(1.35%)
988
(10.79%)
331
(3.61 %)
6,216
(67.91%)
1,495
(16.33%)
9,154
(100%)
TABLE 5: SUMMARY OF SUBJECTS WITH SIGNIFICANT IMPROVED PERFORMANCE
(YEARS 2012 – 2016)
_______________________________________________________________________________________________________________________________________________________________________________________
The 2016 Kenya Certificate of Secondary Education (KCSE) Examination Essential Statistics
Page 9 of 13
CANDIDATES’ PERFORMANCE BY SUBJECT
2016 2015 2014 2013 2012
1. Art & Design 442 English 101 English 101 Kiswahili 102 Chemistry 233
2. Woodwork 444 Kiswahili 102 Kiswahili 102 Biology 231 Mathematics
Alternative A
121
3. Drawing &
Design
449 Mathematics
Alternative A
121 Mathematics
Alternative B
122 Physics 232 Geography 312
4. Computer
Studies
451 Biology 231 Biology 231 History &
Govt.
311 English 101
5. Kenya Sign
Language
504 Physics 232 Chemistry 233 CRE 313 Home Science 441
6. Chemistry 233 History & Govt. 311 IRE 314 Physics 232
7. Biology for the
Blind
236 Geography 312 Home
Science
441 Woodwork 444
8. Home Science 441 CRE 313 Woodwork 444 Power
Mechanics
447
9. Agriculture 443 IRE 314 Building
Construction
446 Drawing &
Design
449
10. Woodwork 444 Agriculture 443 Drawing &
Design
449 Music 511
11. Aviation
Technology
450 Woodwork 445 French 501 Woodwork 446
12. French 501 Power
Mechanics
447 Arabic 503 Art & Design 442
13. Music 511 Electricity 448 Music 511
14. Drawing &
Design
449 Business
Studies
565
15. Computer
Studies
451
05 13 15 14 12
TABLE 6: SUMMARY OF SUBJECTS WITH NO SIGNIFICANT CHANGE IN
PERFORMANCE (YEARS 2012– 2016)
CANDIDATES’ PERFORMANCE BY SUBJECT
2016 2015 2014 2013 2012
1. Mathematics
Alternative B
122 General
Science
237 Biology for
the Blind
236 Biology for
the blind
236 Metalwork 445
2. Biology for the Blind 236 Geography 312 General
Science
237 Metalwork 445 General
Science
237
3. Building
Construction
446 Art & Design 442 Building
Construction
446 Power
Mechanics
447 German 502
4. Electricity 448 Metalwork 445 French 501 Electricity 448 Computer
Studies
451
5. German 502 Building
Construction
446 German 502 Aviation
Technology
450 Aviation
Technology
450
6. Power
Mechanics
447 Kenyan Sign
Language
504
7. German 502
05 07 05 06 05
TABLE 7 SUMMARY OF SUBJECTS WITH A SIGNIFICANT DECLINE IN
PERFORMANCE (YEARS 2012– 2016)
_______________________________________________________________________________________________________________________________________________________________________________________
The 2016 Kenya Certificate of Secondary Education (KCSE) Examination Essential Statistics
Page 10 of 13
CANDIDATES’ PERFORMANCE BY SUBJECT
2016 2015 2014 2013 2012
1. English 101 Alternative
Mathematics B
122 Mathematics
Alternative A
121 English 101 Kiswahili 102
2. Kiswahili 102 History and
Government
311 Physics 232 Mathematics 121 Biology 231
3. Mathematics
Alternative A
121 CRE 313 Home Science 441 Alternative
Mathematics B
122 CRE 313
4. Biology 231 IRE 314 Art & Design 442 Chemistry 233 IRE 314
5. Physics 232 Electricity 448 Wood Work 444 General
Science
237 Agriculture 443
6. Chemistry 233 Drawing &
Design
449 Aviation
Technology
450 Geography 312 Arabic 503
7. General
Science
237 Computer
Studies
451 Arabic 503 Art & Design 442 Business
Studies
565
8. History & Govt. 311 Arabic 503 Kenya Sign
Language
504 Agriculture 443 History and
Government
311
9. Geography 312 Kenyan Sign
Language
504 Music 511 Computer
Studies
451 Mathematics
Alternative B
122
10. CRE 313 Business
Studies
565 Business
Studies
565 German 502 Electricity 448
11. IRE 314 French 501
12. Home Science 441 Kenya Sign
Language
504
13. Agriculture 443 Biology for
the Blind
236
14. Woodwork 445
15. Power
Mechanics
447
16. Aviation
Technology
450
17. French 501
18. Arabic 503
19. Music 511
20. Business
Studies
565
20 10 10 10 13
_______________________________________________________________________________________________________________________________________________________________________________________
The 2016 Kenya Certificate of Secondary Education (KCSE) Examination Essential Statistics
Page 11 of 13
TABLE 8: OVERALL NATIONAL GRADE SUMMARY FOR 2016
GENDER A A- B+ B B- C+ C C- D+ D D- E
FEMALE
58 2,685 6,581 10,204 13,649 17,238 22,960 30,979 41,632 57,487 77,718 18,077
MALE 83 1,960 4,394 7,012 10,096 14,969 21,832 30,047 39,319 54,648 72,211 15,322
ALL 141 4,645 10,975 17,216 23,745 32,207 44,792 61,026 80,951 112,135 149,929 33,399
CUM % AGE 0.02 0.83 2.73 5.71 9.83 15.41 23.17 33.74 47.76 67.19 93.16 98.95
CUM. TOTAL 141 4,786 15,761 32,977 56,722 88,929 133,721 194,747 275,698 387,833 537,762 571,161
% AGE 0.02 0.80 1.90 2.98 4.11 5.58 7.76 10.57 14.02 19.43 25.97 5.79
TABLE 9 OVERALL NATIONAL GRADE SUMMARY FOR 2015
GENDER A A- B+ B B- C+ C C- D+ D D- E
MALE
2024 7952 13517 19826 25312 29556 33437 37482 40181 40442 25531 3127
FEMALE 661 4117 8410 13634 19269 25214 31476 36633 38976 39113 23127 2223
ALL 2685 12069 21927 33460 44581 54770 64913 74115 79157 79555 48658 5350
CUM % AGE 0.51 2.81 6.98 13.34 21.82 32.23 44.58 58.67 73.73 88.86 98.11 99.13
CUM. TOTAL 2685 14754 36681 70141 114722 169492 234405 308520 387677 467232 515890 521240
% AGE 0.51 2.30 4.17 6.36 8.48 10.42 12.35 14.10 15.05 15.13 9.25 1.02
__________________________________________________________________________________________________________________________________________________________________________________________
The 2016 Kenya Certificate of Secondary Education (KCSE) Examination Essential Statistics
Page 12 of 13
TABLE 10: SPECIAL NEEDS CANDIDATES WHO SAT THE YEAR 2016 AND 2015 KCSE
EXAMINATIONS
SPECIAL NEED CATEGORY
COUNTY NAMES AND CODES BLIND LOW VISION PHYSICALLY IMPAIRED HEARING IMPAIRED
2016 2015 2016 2015 2016 2015 2016 2015
Taita Taveta
(01)
00 00 01 03 01 04 00 00
Kwale
(02)
00 00 04 04 03 03 00 00
Mombasa
(03)
01 00 11 07 15 27 00 01
Kilifi
(04)
01 00 05 09 04 06 23 17
Tana River
(05)
00 00 00 01 00 00 00 00
Lamu
(06)
00 00 01 00 02 01 00 00
Nyandarua
(07)
00 00 01 07 02 03 00 00
Nyeri
(08)
00 00 03 05 03 07 44 52
Kirinyaga
(09)
00 00 03 03 03 06 00 00
Muranga
(10)
00 00 04 04 07 10 24 25
Kiambu
(11)
50 42 23 27 51 43 00 10
Machakos
(12)
00 02 07 07 05 02 10 32
Kitui
(13)
00 00 04 06 08 09 32 00
Embu
(14)
00 00 05 06 06 03 00 00
Meru
(15)
09 16 06 07 04 09 00 00
Marsabit
(16)
00 00 00 00 01 00 00 00
Isiolo
(17)
00 00 00 02 02 02 00 00
Makueni
(18)
00 00 09 06 12 07 00 00
Tharaka Nithi
(19)
00 00 04 01 02 01 00 00
Nairobi
(20)
04 00 09 27 19 09 09 03
Turkana
(21)
01 01 01 01 04 02 00 00
Samburu
(22)
00 00 01 00 03 01 00 00
Trans Nzoia
(23)
03 00 16 11 08 07 00 01
West Pokot
(24)
08 04 06 03 08 03 00 00
Bomet
(25)
01 01 01 01 06 07 11 19
Uasin Gishu
(26)
00 00 11 04 05 04 00 00
Nakuru 01 01 15 05 15 13 24 21
__________________________________________________________________________________________________________________________________________________________________________________________
The 2016 Kenya Certificate of Secondary Education (KCSE) Examination Essential Statistics
Page 13 of 13
SPECIAL NEED CATEGORY
COUNTY NAMES AND CODES BLIND LOW VISION PHYSICALLY IMPAIRED HEARING IMPAIRED
2016 2015 2016 2015 2016 2015 2016 2015
(27)
Kericho
(28)
00 00 08 07 07 08 23 14
Nandi
(29)
00 00 08 09 12 05 20 15
Laikipia
(30)
00 00 03 02 04 04 00 00
Kajiado
(31)
00 00 06 02 06 08 00 00
Narok
(32)
00 01 04 03 02 06 00 00
Baringo
(33)
00 00 02 02 04 03 00 01
Elgeyo Marakwet
(34)
01 00 02 03 04 03 00 00
Busia
(35)
00 00 02 02 09 07 10 05
Bungoma
(36)
00 00 14 11 35 20 00 01
Kakamega
(37)
00 00 04 07 13 06 53 35
Vihiga
(38)
00 00 09 05 04 06 02 02
Kisumu
(39)
10 16 17 16 58 43 20 03
Kisii
(40)
00 00 06 09 09 13 00 28
Homa Bay
(41)
00 00 14 14 12 13 00 00
Siaya
(42)
11 07 10 14 04 08 29 34
Nyamira
(43)
00 00 05 01 02 01 01 00
Migori
(44)
00 00 11 00 11 05 51 56
Garissa
(45)
00 00 05 03 10 05 01 02
Wajir
(46)
00 00 01 02 04 07 00 00
Mandera
(47)
00 00 04 00 03 03 00 00
TOTAL 101 91 286 269 412 363 387 377
TABLE 11: CANDIDATES WHO SAT THE YEAR 2016 AND 2015 KCSE EXAMINATION UNDER
SPECIAL CIRCUMSTANCES
CATEGORY 2016 2015
Candidates who sat their examination in hospitals 237 257
Candidates who sat their examination in prisons 10 08
_______________________________________________________________________________________________________________________________________________________________________________________
The 2016 Kenya Certificate of Secondary Education (KCSE) Examination Essential Statistics

Weitere ähnliche Inhalte

Andere mochten auch

2013 KCSE Exam Top 100 Schools Nationally
2013 KCSE Exam Top 100 Schools Nationally2013 KCSE Exam Top 100 Schools Nationally
2013 KCSE Exam Top 100 Schools NationallyKenyaSchoolReport.com
 
2013 KCPE Examination Top and Bottom 5 Schools in each county - Kenya
2013 KCPE Examination Top and Bottom 5 Schools in each county  - Kenya 2013 KCPE Examination Top and Bottom 5 Schools in each county  - Kenya
2013 KCPE Examination Top and Bottom 5 Schools in each county - Kenya KenyaSchoolReport.com
 
2013 KCPE Examination Top and Bottom 50 Districts by County Nationally - Kenya
2013 KCPE Examination Top and Bottom 50 Districts by County Nationally - Kenya2013 KCPE Examination Top and Bottom 50 Districts by County Nationally - Kenya
2013 KCPE Examination Top and Bottom 50 Districts by County Nationally - KenyaKenyaSchoolReport.com
 
Kenya national music festiva 2012 catalogue at kicd(kie archives)a
Kenya national music festiva 2012 catalogue at kicd(kie archives)aKenya national music festiva 2012 catalogue at kicd(kie archives)a
Kenya national music festiva 2012 catalogue at kicd(kie archives)aJoseph Mwanzo
 
Return to work formual signed by KMPDU, Governors and State
Return to work formual signed by KMPDU, Governors and StateReturn to work formual signed by KMPDU, Governors and State
Return to work formual signed by KMPDU, Governors and StateThe Star Newspaper
 
Corruption in Education in Eastern Europe and Central Asia impact on social i...
Corruption in Education in Eastern Europe and Central Asia impact on social i...Corruption in Education in Eastern Europe and Central Asia impact on social i...
Corruption in Education in Eastern Europe and Central Asia impact on social i...UNDP Eurasia
 
2013 KCPE Examination Essential Statistics - Kenya
2013 KCPE Examination Essential Statistics - Kenya 2013 KCPE Examination Essential Statistics - Kenya
2013 KCPE Examination Essential Statistics - Kenya KenyaSchoolReport.com
 
2013 KCPE Top Ten Candidates - position by County - Kenya
2013 KCPE Top Ten Candidates - position by County - Kenya 2013 KCPE Top Ten Candidates - position by County - Kenya
2013 KCPE Top Ten Candidates - position by County - Kenya KenyaSchoolReport.com
 
2013 KCPE Examination Orders of Merit - Kenya
2013 KCPE Examination Orders of Merit - Kenya2013 KCPE Examination Orders of Merit - Kenya
2013 KCPE Examination Orders of Merit - KenyaKenyaSchoolReport.com
 
Madame Yevonde - My interpretation
Madame Yevonde - My interpretationMadame Yevonde - My interpretation
Madame Yevonde - My interpretationbretkath07
 
Leveraging social media for health meeting 2 7.31.12
Leveraging social media for health meeting 2 7.31.12Leveraging social media for health meeting 2 7.31.12
Leveraging social media for health meeting 2 7.31.12Viable Synergy LLC
 
Pico ISMB 2012 WikiPathways
Pico ISMB 2012 WikiPathwaysPico ISMB 2012 WikiPathways
Pico ISMB 2012 WikiPathwaysAlexander Pico
 
Evolucion de la imformatica
Evolucion de la imformaticaEvolucion de la imformatica
Evolucion de la imformatica1991077
 
Daily Newsletter: 11th April, 2011
Daily Newsletter: 11th April, 2011Daily Newsletter: 11th April, 2011
Daily Newsletter: 11th April, 2011Fullerton Securities
 
Κάνω ένα βήμα για να ΣΩΣΩ ΤΟΝ ΠΛΑΝΗΤΗ
Κάνω ένα βήμα   για να ΣΩΣΩ ΤΟΝ ΠΛΑΝΗΤΗΚάνω ένα βήμα   για να ΣΩΣΩ ΤΟΝ ΠΛΑΝΗΤΗ
Κάνω ένα βήμα για να ΣΩΣΩ ΤΟΝ ΠΛΑΝΗΤΗ93dimath
 
Oχι στην σπατάλη φαγητού!
Oχι στην σπατάλη φαγητού!Oχι στην σπατάλη φαγητού!
Oχι στην σπατάλη φαγητού!93dimath
 
Daily Newsletter: 11th August, 2011
Daily Newsletter: 11th August, 2011Daily Newsletter: 11th August, 2011
Daily Newsletter: 11th August, 2011Fullerton Securities
 

Andere mochten auch (20)

2013 KCSE Exam Top 100 Schools Nationally
2013 KCSE Exam Top 100 Schools Nationally2013 KCSE Exam Top 100 Schools Nationally
2013 KCSE Exam Top 100 Schools Nationally
 
2013 KCPE Examination Top and Bottom 5 Schools in each county - Kenya
2013 KCPE Examination Top and Bottom 5 Schools in each county  - Kenya 2013 KCPE Examination Top and Bottom 5 Schools in each county  - Kenya
2013 KCPE Examination Top and Bottom 5 Schools in each county - Kenya
 
2013 KCPE Examination Top and Bottom 50 Districts by County Nationally - Kenya
2013 KCPE Examination Top and Bottom 50 Districts by County Nationally - Kenya2013 KCPE Examination Top and Bottom 50 Districts by County Nationally - Kenya
2013 KCPE Examination Top and Bottom 50 Districts by County Nationally - Kenya
 
Kenya national music festiva 2012 catalogue at kicd(kie archives)a
Kenya national music festiva 2012 catalogue at kicd(kie archives)aKenya national music festiva 2012 catalogue at kicd(kie archives)a
Kenya national music festiva 2012 catalogue at kicd(kie archives)a
 
Return to work formual signed by KMPDU, Governors and State
Return to work formual signed by KMPDU, Governors and StateReturn to work formual signed by KMPDU, Governors and State
Return to work formual signed by KMPDU, Governors and State
 
Corruption in Education in Eastern Europe and Central Asia impact on social i...
Corruption in Education in Eastern Europe and Central Asia impact on social i...Corruption in Education in Eastern Europe and Central Asia impact on social i...
Corruption in Education in Eastern Europe and Central Asia impact on social i...
 
2013 KCPE Examination Essential Statistics - Kenya
2013 KCPE Examination Essential Statistics - Kenya 2013 KCPE Examination Essential Statistics - Kenya
2013 KCPE Examination Essential Statistics - Kenya
 
Top+candidates
Top+candidatesTop+candidates
Top+candidates
 
2013 KCPE Top Ten Candidates - position by County - Kenya
2013 KCPE Top Ten Candidates - position by County - Kenya 2013 KCPE Top Ten Candidates - position by County - Kenya
2013 KCPE Top Ten Candidates - position by County - Kenya
 
2013 KCPE Examination Orders of Merit - Kenya
2013 KCPE Examination Orders of Merit - Kenya2013 KCPE Examination Orders of Merit - Kenya
2013 KCPE Examination Orders of Merit - Kenya
 
Rankers List
Rankers ListRankers List
Rankers List
 
Madame Yevonde - My interpretation
Madame Yevonde - My interpretationMadame Yevonde - My interpretation
Madame Yevonde - My interpretation
 
Leveraging social media for health meeting 2 7.31.12
Leveraging social media for health meeting 2 7.31.12Leveraging social media for health meeting 2 7.31.12
Leveraging social media for health meeting 2 7.31.12
 
Pico ISMB 2012 WikiPathways
Pico ISMB 2012 WikiPathwaysPico ISMB 2012 WikiPathways
Pico ISMB 2012 WikiPathways
 
Evolucion de la imformatica
Evolucion de la imformaticaEvolucion de la imformatica
Evolucion de la imformatica
 
Daily Newsletter: 11th April, 2011
Daily Newsletter: 11th April, 2011Daily Newsletter: 11th April, 2011
Daily Newsletter: 11th April, 2011
 
Κάνω ένα βήμα για να ΣΩΣΩ ΤΟΝ ΠΛΑΝΗΤΗ
Κάνω ένα βήμα   για να ΣΩΣΩ ΤΟΝ ΠΛΑΝΗΤΗΚάνω ένα βήμα   για να ΣΩΣΩ ΤΟΝ ΠΛΑΝΗΤΗ
Κάνω ένα βήμα για να ΣΩΣΩ ΤΟΝ ΠΛΑΝΗΤΗ
 
Oχι στην σπατάλη φαγητού!
Oχι στην σπατάλη φαγητού!Oχι στην σπατάλη φαγητού!
Oχι στην σπατάλη φαγητού!
 
A game of thrones #03
A game of thrones #03A game of thrones #03
A game of thrones #03
 
Daily Newsletter: 11th August, 2011
Daily Newsletter: 11th August, 2011Daily Newsletter: 11th August, 2011
Daily Newsletter: 11th August, 2011
 

Ähnlich wie 2016 KCSE Examination Essential Statistics

Foundation admissions 2017_eng(2)
Foundation admissions 2017_eng(2)Foundation admissions 2017_eng(2)
Foundation admissions 2017_eng(2)Indira Tolendiyeva
 
Foundation admissions 2017_eng
Foundation admissions 2017_engFoundation admissions 2017_eng
Foundation admissions 2017_engIndira Tolendiyeva
 
BOS-BOF MONTHLY REPORT -MARCH 2016
BOS-BOF MONTHLY REPORT -MARCH 2016BOS-BOF MONTHLY REPORT -MARCH 2016
BOS-BOF MONTHLY REPORT -MARCH 2016Bill Leverence
 
Alfredo R. Galassi - The Euro CTO Club: The Registry
Alfredo R. Galassi - The Euro CTO Club: The RegistryAlfredo R. Galassi - The Euro CTO Club: The Registry
Alfredo R. Galassi - The Euro CTO Club: The RegistryEuro CTO Club
 
Valuation Of ASHOK LEYLAND
Valuation Of ASHOK LEYLANDValuation Of ASHOK LEYLAND
Valuation Of ASHOK LEYLANDAakash Singh
 
Evolução dos valores programados - meio tv - Governo Federal
Evolução dos valores programados - meio tv -  Governo FederalEvolução dos valores programados - meio tv -  Governo Federal
Evolução dos valores programados - meio tv - Governo FederalIvson Alves
 
Food borne disease outbreak analysis by Cenacle Research
Food borne disease outbreak analysis by Cenacle ResearchFood borne disease outbreak analysis by Cenacle Research
Food borne disease outbreak analysis by Cenacle ResearchGopalakrishna Palem
 
Analisis Horta Guinardo 2008 03 10
Analisis Horta Guinardo 2008 03 10Analisis Horta Guinardo 2008 03 10
Analisis Horta Guinardo 2008 03 101977bcn
 
1803 blue book
1803 blue book1803 blue book
1803 blue bookAlan Prest
 
Does medical travel pay? Measuring return on investment
Does medical travel pay? Measuring return on investmentDoes medical travel pay? Measuring return on investment
Does medical travel pay? Measuring return on investmentKi Nam Jin
 
Abc 401k plan grader
Abc 401k plan grader Abc 401k plan grader
Abc 401k plan grader James Holland
 
Foundation admissions 2018_eng
Foundation admissions 2018_engFoundation admissions 2018_eng
Foundation admissions 2018_engArman_Assetov
 

Ähnlich wie 2016 KCSE Examination Essential Statistics (20)

Foundation admissions 2017_eng(2)
Foundation admissions 2017_eng(2)Foundation admissions 2017_eng(2)
Foundation admissions 2017_eng(2)
 
Foundation admissions 2017_eng
Foundation admissions 2017_engFoundation admissions 2017_eng
Foundation admissions 2017_eng
 
BOS-BOF MONTHLY REPORT -MARCH 2016
BOS-BOF MONTHLY REPORT -MARCH 2016BOS-BOF MONTHLY REPORT -MARCH 2016
BOS-BOF MONTHLY REPORT -MARCH 2016
 
Alfredo R. Galassi - The Euro CTO Club: The Registry
Alfredo R. Galassi - The Euro CTO Club: The RegistryAlfredo R. Galassi - The Euro CTO Club: The Registry
Alfredo R. Galassi - The Euro CTO Club: The Registry
 
P&L FORECAST
P&L FORECASTP&L FORECAST
P&L FORECAST
 
Valuation Of ASHOK LEYLAND
Valuation Of ASHOK LEYLANDValuation Of ASHOK LEYLAND
Valuation Of ASHOK LEYLAND
 
Excel Model for Banking
Excel Model for Banking Excel Model for Banking
Excel Model for Banking
 
Cassidy Sugimoto - Open Access Mandates: Compliance by funders
Cassidy Sugimoto - Open Access Mandates: Compliance by fundersCassidy Sugimoto - Open Access Mandates: Compliance by funders
Cassidy Sugimoto - Open Access Mandates: Compliance by funders
 
Evolução dos valores programados - meio tv - Governo Federal
Evolução dos valores programados - meio tv -  Governo FederalEvolução dos valores programados - meio tv -  Governo Federal
Evolução dos valores programados - meio tv - Governo Federal
 
Food borne disease outbreak analysis by Cenacle Research
Food borne disease outbreak analysis by Cenacle ResearchFood borne disease outbreak analysis by Cenacle Research
Food borne disease outbreak analysis by Cenacle Research
 
Analisis Horta Guinardo 2008 03 10
Analisis Horta Guinardo 2008 03 10Analisis Horta Guinardo 2008 03 10
Analisis Horta Guinardo 2008 03 10
 
1803 blue book
1803 blue book1803 blue book
1803 blue book
 
Foradmissions foundation_en
Foradmissions foundation_enForadmissions foundation_en
Foradmissions foundation_en
 
Does medical travel pay? Measuring return on investment
Does medical travel pay? Measuring return on investmentDoes medical travel pay? Measuring return on investment
Does medical travel pay? Measuring return on investment
 
Active quotas spring2011
Active quotas spring2011Active quotas spring2011
Active quotas spring2011
 
Active duty quotas 2011
Active duty quotas 2011Active duty quotas 2011
Active duty quotas 2011
 
Sample Financial Reports
Sample Financial ReportsSample Financial Reports
Sample Financial Reports
 
Abc 401k plan grader
Abc 401k plan grader Abc 401k plan grader
Abc 401k plan grader
 
Foundation admissions 2018_eng
Foundation admissions 2018_engFoundation admissions 2018_eng
Foundation admissions 2018_eng
 
18 dec 2019
18 dec 201918 dec 2019
18 dec 2019
 

Mehr von The Star Newspaper

CS Rotich speaks on Arror and Kimwarer dams
CS Rotich speaks on Arror and Kimwarer damsCS Rotich speaks on Arror and Kimwarer dams
CS Rotich speaks on Arror and Kimwarer damsThe Star Newspaper
 
Personal statement on implementation of arror and kimwarer dams in emc
Personal statement on implementation of arror and kimwarer dams in emcPersonal statement on implementation of arror and kimwarer dams in emc
Personal statement on implementation of arror and kimwarer dams in emcThe Star Newspaper
 
Gazette vol. 17 8 2-19 special (appointments)
Gazette vol. 17 8 2-19 special (appointments)Gazette vol. 17 8 2-19 special (appointments)
Gazette vol. 17 8 2-19 special (appointments)The Star Newspaper
 
Impending strike by clinical officers
Impending strike by clinical officersImpending strike by clinical officers
Impending strike by clinical officersThe Star Newspaper
 
Impending strike by clinical officers
Impending strike by clinical officersImpending strike by clinical officers
Impending strike by clinical officersThe Star Newspaper
 
Cj milimani statement 1 2-19 -judiciary
Cj milimani statement 1 2-19 -judiciaryCj milimani statement 1 2-19 -judiciary
Cj milimani statement 1 2-19 -judiciaryThe Star Newspaper
 
2018 kcse examination top 100 overall
2018 kcse examination top 100 overall2018 kcse examination top 100 overall
2018 kcse examination top 100 overallThe Star Newspaper
 
Promoted magistrates and kadhis
Promoted magistrates and kadhisPromoted magistrates and kadhis
Promoted magistrates and kadhisThe Star Newspaper
 
Gazette Vol. 117 21 9-18 Special (Awards)
Gazette Vol. 117 21 9-18 Special (Awards)Gazette Vol. 117 21 9-18 Special (Awards)
Gazette Vol. 117 21 9-18 Special (Awards)The Star Newspaper
 
Police Statement on Bobi Wine's reception
Police Statement on Bobi Wine's reception Police Statement on Bobi Wine's reception
Police Statement on Bobi Wine's reception The Star Newspaper
 
Summary report on operations at pmh
Summary report on operations at pmhSummary report on operations at pmh
Summary report on operations at pmhThe Star Newspaper
 
President Uhuru Kenyatta Speech on fuel tax
President Uhuru Kenyatta Speech on fuel taxPresident Uhuru Kenyatta Speech on fuel tax
President Uhuru Kenyatta Speech on fuel taxThe Star Newspaper
 
Deputy Chief Justice Philomena Mwilu
Deputy Chief Justice Philomena MwiluDeputy Chief Justice Philomena Mwilu
Deputy Chief Justice Philomena MwiluThe Star Newspaper
 

Mehr von The Star Newspaper (20)

Kenya Rural Roads Authority
Kenya Rural Roads AuthorityKenya Rural Roads Authority
Kenya Rural Roads Authority
 
CS Rotich speaks on Arror and Kimwarer dams
CS Rotich speaks on Arror and Kimwarer damsCS Rotich speaks on Arror and Kimwarer dams
CS Rotich speaks on Arror and Kimwarer dams
 
Personal statement on implementation of arror and kimwarer dams in emc
Personal statement on implementation of arror and kimwarer dams in emcPersonal statement on implementation of arror and kimwarer dams in emc
Personal statement on implementation of arror and kimwarer dams in emc
 
Gazette vol. 17 8 2-19 special (appointments)
Gazette vol. 17 8 2-19 special (appointments)Gazette vol. 17 8 2-19 special (appointments)
Gazette vol. 17 8 2-19 special (appointments)
 
Impending strike by clinical officers
Impending strike by clinical officersImpending strike by clinical officers
Impending strike by clinical officers
 
Impending strike by clinical officers
Impending strike by clinical officersImpending strike by clinical officers
Impending strike by clinical officers
 
Cj milimani statement 1 2-19 -judiciary
Cj milimani statement 1 2-19 -judiciaryCj milimani statement 1 2-19 -judiciary
Cj milimani statement 1 2-19 -judiciary
 
2018 kcse examination top 100 overall
2018 kcse examination top 100 overall2018 kcse examination top 100 overall
2018 kcse examination top 100 overall
 
Petition no. 451 of 2018
Petition no. 451 of 2018Petition no. 451 of 2018
Petition no. 451 of 2018
 
Promoted magistrates and kadhis
Promoted magistrates and kadhisPromoted magistrates and kadhis
Promoted magistrates and kadhis
 
Jpg2pdf (1)
Jpg2pdf (1)Jpg2pdf (1)
Jpg2pdf (1)
 
Gazette Vol. 117 21 9-18 Special (Awards)
Gazette Vol. 117 21 9-18 Special (Awards)Gazette Vol. 117 21 9-18 Special (Awards)
Gazette Vol. 117 21 9-18 Special (Awards)
 
Police Statement on Bobi Wine's reception
Police Statement on Bobi Wine's reception Police Statement on Bobi Wine's reception
Police Statement on Bobi Wine's reception
 
Summary report on operations at pmh
Summary report on operations at pmhSummary report on operations at pmh
Summary report on operations at pmh
 
Reviewed Fuel Prices
Reviewed Fuel Prices Reviewed Fuel Prices
Reviewed Fuel Prices
 
President Uhuru Kenyatta Speech on fuel tax
President Uhuru Kenyatta Speech on fuel taxPresident Uhuru Kenyatta Speech on fuel tax
President Uhuru Kenyatta Speech on fuel tax
 
Npsc Exit report
Npsc Exit reportNpsc Exit report
Npsc Exit report
 
Deputy Chief Justice Philomena Mwilu
Deputy Chief Justice Philomena MwiluDeputy Chief Justice Philomena Mwilu
Deputy Chief Justice Philomena Mwilu
 
Letter prof.swazuri
Letter prof.swazuriLetter prof.swazuri
Letter prof.swazuri
 
Kiba
KibaKiba
Kiba
 

Kürzlich hochgeladen

ICT Role in 21st Century Education & its Challenges.pptx
ICT Role in 21st Century Education & its Challenges.pptxICT Role in 21st Century Education & its Challenges.pptx
ICT Role in 21st Century Education & its Challenges.pptxAreebaZafar22
 
SOC 101 Demonstration of Learning Presentation
SOC 101 Demonstration of Learning PresentationSOC 101 Demonstration of Learning Presentation
SOC 101 Demonstration of Learning Presentationcamerronhm
 
psychiatric nursing HISTORY COLLECTION .docx
psychiatric  nursing HISTORY  COLLECTION  .docxpsychiatric  nursing HISTORY  COLLECTION  .docx
psychiatric nursing HISTORY COLLECTION .docxPoojaSen20
 
How to Manage Global Discount in Odoo 17 POS
How to Manage Global Discount in Odoo 17 POSHow to Manage Global Discount in Odoo 17 POS
How to Manage Global Discount in Odoo 17 POSCeline George
 
Unit-IV; Professional Sales Representative (PSR).pptx
Unit-IV; Professional Sales Representative (PSR).pptxUnit-IV; Professional Sales Representative (PSR).pptx
Unit-IV; Professional Sales Representative (PSR).pptxVishalSingh1417
 
Understanding Accommodations and Modifications
Understanding  Accommodations and ModificationsUnderstanding  Accommodations and Modifications
Understanding Accommodations and ModificationsMJDuyan
 
Micro-Scholarship, What it is, How can it help me.pdf
Micro-Scholarship, What it is, How can it help me.pdfMicro-Scholarship, What it is, How can it help me.pdf
Micro-Scholarship, What it is, How can it help me.pdfPoh-Sun Goh
 
On National Teacher Day, meet the 2024-25 Kenan Fellows
On National Teacher Day, meet the 2024-25 Kenan FellowsOn National Teacher Day, meet the 2024-25 Kenan Fellows
On National Teacher Day, meet the 2024-25 Kenan FellowsMebane Rash
 
Python Notes for mca i year students osmania university.docx
Python Notes for mca i year students osmania university.docxPython Notes for mca i year students osmania university.docx
Python Notes for mca i year students osmania university.docxRamakrishna Reddy Bijjam
 
Kodo Millet PPT made by Ghanshyam bairwa college of Agriculture kumher bhara...
Kodo Millet  PPT made by Ghanshyam bairwa college of Agriculture kumher bhara...Kodo Millet  PPT made by Ghanshyam bairwa college of Agriculture kumher bhara...
Kodo Millet PPT made by Ghanshyam bairwa college of Agriculture kumher bhara...pradhanghanshyam7136
 
Seal of Good Local Governance (SGLG) 2024Final.pptx
Seal of Good Local Governance (SGLG) 2024Final.pptxSeal of Good Local Governance (SGLG) 2024Final.pptx
Seal of Good Local Governance (SGLG) 2024Final.pptxnegromaestrong
 
Application orientated numerical on hev.ppt
Application orientated numerical on hev.pptApplication orientated numerical on hev.ppt
Application orientated numerical on hev.pptRamjanShidvankar
 
2024-NATIONAL-LEARNING-CAMP-AND-OTHER.pptx
2024-NATIONAL-LEARNING-CAMP-AND-OTHER.pptx2024-NATIONAL-LEARNING-CAMP-AND-OTHER.pptx
2024-NATIONAL-LEARNING-CAMP-AND-OTHER.pptxMaritesTamaniVerdade
 
Key note speaker Neum_Admir Softic_ENG.pdf
Key note speaker Neum_Admir Softic_ENG.pdfKey note speaker Neum_Admir Softic_ENG.pdf
Key note speaker Neum_Admir Softic_ENG.pdfAdmir Softic
 
SKILL OF INTRODUCING THE LESSON MICRO SKILLS.pptx
SKILL OF INTRODUCING THE LESSON MICRO SKILLS.pptxSKILL OF INTRODUCING THE LESSON MICRO SKILLS.pptx
SKILL OF INTRODUCING THE LESSON MICRO SKILLS.pptxAmanpreet Kaur
 
How to Give a Domain for a Field in Odoo 17
How to Give a Domain for a Field in Odoo 17How to Give a Domain for a Field in Odoo 17
How to Give a Domain for a Field in Odoo 17Celine George
 
Third Battle of Panipat detailed notes.pptx
Third Battle of Panipat detailed notes.pptxThird Battle of Panipat detailed notes.pptx
Third Battle of Panipat detailed notes.pptxAmita Gupta
 
Explore beautiful and ugly buildings. Mathematics helps us create beautiful d...
Explore beautiful and ugly buildings. Mathematics helps us create beautiful d...Explore beautiful and ugly buildings. Mathematics helps us create beautiful d...
Explore beautiful and ugly buildings. Mathematics helps us create beautiful d...christianmathematics
 
Russian Escort Service in Delhi 11k Hotel Foreigner Russian Call Girls in Delhi
Russian Escort Service in Delhi 11k Hotel Foreigner Russian Call Girls in DelhiRussian Escort Service in Delhi 11k Hotel Foreigner Russian Call Girls in Delhi
Russian Escort Service in Delhi 11k Hotel Foreigner Russian Call Girls in Delhikauryashika82
 

Kürzlich hochgeladen (20)

ICT Role in 21st Century Education & its Challenges.pptx
ICT Role in 21st Century Education & its Challenges.pptxICT Role in 21st Century Education & its Challenges.pptx
ICT Role in 21st Century Education & its Challenges.pptx
 
SOC 101 Demonstration of Learning Presentation
SOC 101 Demonstration of Learning PresentationSOC 101 Demonstration of Learning Presentation
SOC 101 Demonstration of Learning Presentation
 
psychiatric nursing HISTORY COLLECTION .docx
psychiatric  nursing HISTORY  COLLECTION  .docxpsychiatric  nursing HISTORY  COLLECTION  .docx
psychiatric nursing HISTORY COLLECTION .docx
 
Asian American Pacific Islander Month DDSD 2024.pptx
Asian American Pacific Islander Month DDSD 2024.pptxAsian American Pacific Islander Month DDSD 2024.pptx
Asian American Pacific Islander Month DDSD 2024.pptx
 
How to Manage Global Discount in Odoo 17 POS
How to Manage Global Discount in Odoo 17 POSHow to Manage Global Discount in Odoo 17 POS
How to Manage Global Discount in Odoo 17 POS
 
Unit-IV; Professional Sales Representative (PSR).pptx
Unit-IV; Professional Sales Representative (PSR).pptxUnit-IV; Professional Sales Representative (PSR).pptx
Unit-IV; Professional Sales Representative (PSR).pptx
 
Understanding Accommodations and Modifications
Understanding  Accommodations and ModificationsUnderstanding  Accommodations and Modifications
Understanding Accommodations and Modifications
 
Micro-Scholarship, What it is, How can it help me.pdf
Micro-Scholarship, What it is, How can it help me.pdfMicro-Scholarship, What it is, How can it help me.pdf
Micro-Scholarship, What it is, How can it help me.pdf
 
On National Teacher Day, meet the 2024-25 Kenan Fellows
On National Teacher Day, meet the 2024-25 Kenan FellowsOn National Teacher Day, meet the 2024-25 Kenan Fellows
On National Teacher Day, meet the 2024-25 Kenan Fellows
 
Python Notes for mca i year students osmania university.docx
Python Notes for mca i year students osmania university.docxPython Notes for mca i year students osmania university.docx
Python Notes for mca i year students osmania university.docx
 
Kodo Millet PPT made by Ghanshyam bairwa college of Agriculture kumher bhara...
Kodo Millet  PPT made by Ghanshyam bairwa college of Agriculture kumher bhara...Kodo Millet  PPT made by Ghanshyam bairwa college of Agriculture kumher bhara...
Kodo Millet PPT made by Ghanshyam bairwa college of Agriculture kumher bhara...
 
Seal of Good Local Governance (SGLG) 2024Final.pptx
Seal of Good Local Governance (SGLG) 2024Final.pptxSeal of Good Local Governance (SGLG) 2024Final.pptx
Seal of Good Local Governance (SGLG) 2024Final.pptx
 
Application orientated numerical on hev.ppt
Application orientated numerical on hev.pptApplication orientated numerical on hev.ppt
Application orientated numerical on hev.ppt
 
2024-NATIONAL-LEARNING-CAMP-AND-OTHER.pptx
2024-NATIONAL-LEARNING-CAMP-AND-OTHER.pptx2024-NATIONAL-LEARNING-CAMP-AND-OTHER.pptx
2024-NATIONAL-LEARNING-CAMP-AND-OTHER.pptx
 
Key note speaker Neum_Admir Softic_ENG.pdf
Key note speaker Neum_Admir Softic_ENG.pdfKey note speaker Neum_Admir Softic_ENG.pdf
Key note speaker Neum_Admir Softic_ENG.pdf
 
SKILL OF INTRODUCING THE LESSON MICRO SKILLS.pptx
SKILL OF INTRODUCING THE LESSON MICRO SKILLS.pptxSKILL OF INTRODUCING THE LESSON MICRO SKILLS.pptx
SKILL OF INTRODUCING THE LESSON MICRO SKILLS.pptx
 
How to Give a Domain for a Field in Odoo 17
How to Give a Domain for a Field in Odoo 17How to Give a Domain for a Field in Odoo 17
How to Give a Domain for a Field in Odoo 17
 
Third Battle of Panipat detailed notes.pptx
Third Battle of Panipat detailed notes.pptxThird Battle of Panipat detailed notes.pptx
Third Battle of Panipat detailed notes.pptx
 
Explore beautiful and ugly buildings. Mathematics helps us create beautiful d...
Explore beautiful and ugly buildings. Mathematics helps us create beautiful d...Explore beautiful and ugly buildings. Mathematics helps us create beautiful d...
Explore beautiful and ugly buildings. Mathematics helps us create beautiful d...
 
Russian Escort Service in Delhi 11k Hotel Foreigner Russian Call Girls in Delhi
Russian Escort Service in Delhi 11k Hotel Foreigner Russian Call Girls in DelhiRussian Escort Service in Delhi 11k Hotel Foreigner Russian Call Girls in Delhi
Russian Escort Service in Delhi 11k Hotel Foreigner Russian Call Girls in Delhi
 

2016 KCSE Examination Essential Statistics

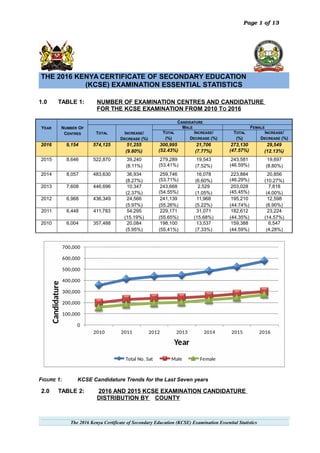
  • 1. Page 1 of 13 THE 2016 KENYA CERTIFICATE OF SECONDARY EDUCATION (KCSE) EXAMINATION ESSENTIAL STATISTICS 1.0 TABLE 1: NUMBER OF EXAMINATION CENTRES AND CANDIDATURE FOR THE KCSE EXAMINATION FROM 2010 TO 2016 YEAR NUMBER OF CENTRES CANDIDATURE TOTAL INCREASE/ DECREASE (%) MALE FEMALE TOTAL (%) INCREASE/ DECREASE (%) TOTAL (%) INCREASE/ DECREASE (%) 2016 9,154 574,125 51,255 (9.80%) 300,995 (52.43%) 21,706 (7.77%) 273,130 (47.57%) 29,549 (12.13%) 2015 8,646 522,870 39,240 (8.11%) 279,289 (53.41%) 19,543 (7.52%) 243,581 (46.59%) 19,697 (8.80%) 2014 8,057 483,630 36,934 (8.27%) 259,746 (53.71%) 16,078 (6.60%) 223,884 (46.29%) 20,856 (10.27%) 2013 7,608 446,696 10,347 (2.37%) 243,668 (54.55%) 2,529 (1.05%) 203,028 (45.45%) 7,818 (4.00%) 2012 6,968 436,349 24,566 (5.97%) 241,139 (55.26%) 11,968 (5.22%) 195,210 (44.74%) 12,598 (6.90%) 2011 6,448 411,783 54,295 (15.19%) 229,171 (55.65%) 31,071 (15.68%) 182,612 (44.35%) 23,224 (14.57%) 2010 6,004 357,488 20,084 (5.95%) 198,100 (55.41%) 13,537 (7.33%) 159,388 (44.59%) 6,547 (4.28%) FIGURE 1: KCSE Candidature Trends for the Last Seven years 2.0 TABLE 2: 2016 AND 2015 KCSE EXAMINATION CANDIDATURE DISTRIBUTION BY COUNTY _______________________________________________________________________________________________________________________________________________________________________________________ The 2016 Kenya Certificate of Secondary Education (KCSE) Examination Essential Statistics
  • 2. Page 2 of 13 COUNTY CODE & NAME 2016 2015 FEMALE MALE TOTAL FEMALE MALE TOTAL CAND. (%) CAND. (%) CAND. (%) CAND. (%) CAND. (%) CAND. (%) 1. 01 Taita Taveta 2,767 (0.482 %) 2,470 (0.430 %) 5,237 (0.912 %) 2,307 (0.441%) 2,305 (0.441%) 4,612 (0.882 %) 2. 02 Kwale 3,015 (0.525 %) 2,964 (0.516 %) 5,979 (1.041 %) 2,723 (0.521%) 2,919 (0.558%) 5,642 (1.079%) 3. 03 Mombasa 3,761 (0.655 %) 4,412 (0.768 %) 8,173 (1.424 %) 3,283 (0.628%) 4,067 (0.778%) 7,350 (1.406%) 4. 04 Kilifi 5,038 (0.878 %) 6,515 (1.135 %) 11,553 (2.012 %) 4,515 (0.864%) 6,071 (1.161%) 10,586 (2.025%) 5. 05 Tana River 500 (0.087 %) 888 (0.155 %) 1,388 (0.242 %) 399 (0.076%) 756 (0.145%) 1,155 (0.221%) 6. 06 Lamu 533 (0.093 %) 746 (0.130 %) 1,279 (0.223 %) 507 (0.097%) 781 (0.149%) 1,288 (0.246%) 7. 07 Nyandarua 6,351 (1.106 %) 6,257 (1.090 %) 12,608 (2.196 %) 5,786 (1.107%) 5,736 (1.097%) 11,522 (2.204%) 8. 08 Nyeri 8,409 (1.465 %) 8,104 (1.412 %) 16,513 (2.876 %) 7,947 (1.520%) 7,943 (1.519%) 15,890 (3.039%) 9. 09 Kirinyaga 5,403 (0.941 %) 4,998 (0.871 %) 10,401 (1.812 %) 4,676 (0.894%) 4,409 (0.843%) 9,085 (1.738%) 10. 10 Murang'a 11,814 (2.058 %) 11,728 (2.043 %) 23,542 (4.101 %) 11,629 (2.224%) 11,457 (2.191%) 23,086 (4.415%) 11. 11 Kiambu 14,575 (2.539 %) 13,700 (2.386 %) 28,275 (4.925 %) 14,251 (2.726%) 13,738 (2.627%) 27,989 (5.353%) 12. 12 Machakos 11,319 (1.972 %) 11,487 (2.001 %) 22,806 (3.972 %) 10,271 (1.964%) 10,886 (2.082%) 21,157 (4.046%) 13. 13 Kitui 8,508 (1.482 %) 8,540 (1.487 %) 17,048 (2.969 %) 7,160 (1.369%) 7,827 (1.497%) 14,987 (2.866%) 14. 14 Embu 4,930 (0.859 %) 5,347 (0.931 %) 10,277 (1.790 %) 4,439 (0.849%) 4,682 (0.895%) 9,121 (1.744%) 15. 15 Meru 10,565 (1.840 %) 9,932 (1.730 %) 20,497 (3.570 %) 9,552 (1.827%) 9,193 (1.758%) 18,745 (3.585%) 16. 16 Marsabit 625 (0.109 %) 794 (0.138 %) 1,419 (0.247 %) 548 (0.105%) 719 (0.138%) 1,267 (0.242%) 17. 17 Isiolo 467 (0.081 %) 670 (0.117 %) 1,137 (0.198 %) 438 (0.084%) 563 (0.108%) 1,001 (0.191%) 18. 18 Makueni 10,462 (1.822 %) 10,850 (1.890 %) 21,312 (3.712 %) 9,385 (1.795%) 9,728 (1.861%) 19,113 (3.655%) 19. 19 Tharaka Nithi 4,329 (0.754 %) 4,138 (0.721 %) 8,467 (1.475 %) 4,233 (0.810%) 3,986 (0.762%) 8,219 (1.572%) 20. 20 Nairobi 12,302 (2.143 %) 13,388 (2.332 %) 25,690 (4.475 %) 11,466 (2.193%) 12,577 (2.405%) 24,043 (4.598%) 21. 21 Turkana 1,218 (0.212 %) 2,325 (0.405 %) 3,543 (0.617 %) 881 (0.168%) 1,887 (0.361%) 2,768 (0.529%) 22. 22 Samburu 604 (0.105 %) 1,071 (0.187 %) 1,675 (0.292 %) 543 (0.104%) 947 (0.181%) 1,490 (0.285%) 23. 23 Trans Nzoia 5,636 (0.982 %) 6,814 (1.187 %) 12,450 (2.169 %) 4,900 (0.937%) 6,006 (1.149%) 10,906 (2.086%) 24. 24 West Pokot 2,343 (0.408 %) 2,808 (0.489 %) 5,151 (0.897 %) 1,774 (0.339%) 2,466 (0.472%) 4,240 (0.811%) 25. 25 Bomet 6,501 (1.132 %) 7,524 (1.311 %) 14,025 (2.443 %) 4,977 (0.952%) 6,448 (1.233%) 11,425 (2.185%) 26. 26 Uasin Gishu 6,762 (1.178 %) 6,533 (1.138 %) 13,295 (2.316 %) 5,758 (1.101%) 5,894 (1.127%) 11,652 (2.228%) 27. 27 Nakuru 15,363 (2.676 %) 16,249 (2.830 %) 31,612 (5.506 %) 13,753 (2.630%) 15,053 (2.879%) 28,806 (5.509%) 28. 28 Kericho 6,247 (1.088 %) 7,351 (1.280 %) 13,598 (2.368 %) 5,367 (1.026%) 6,541 (1.251%) 11,908 (2.277%) 29. 29 Nandi 6,136 (1.069 %) 6,454 (1.124 %) 12,590 (2.193 %) 5,002 (0.957%) 5,448 (1.042%) 10,450 (1.999%) 30. 30 3,505 3,691 7,196 3,054 3,481 6,535 _______________________________________________________________________________________________________________________________________________________________________________________ The 2016 Kenya Certificate of Secondary Education (KCSE) Examination Essential Statistics
  • 3. Page 3 of 13 COUNTY CODE & NAME 2016 2015 FEMALE MALE TOTAL FEMALE MALE TOTAL CAND. (%) CAND. (%) CAND. (%) CAND. (%) CAND. (%) CAND. (%) Laikipia (0.610 %) (0.643 %) (1.253 %) (0.584%) (0.666%) (1.250%) 31. 31 Kajiado 3,489 (0.608 %) 4,021 (0.700 %) 7,510 (1.308 %) 3,156 (0.604%) 3,472 (0.664%) 6,628 (1.268%) 32. 32 Narok 2,449 (0.427 %) 3,456 (0.602 %) 5,905 (1.029 %) 2,272 (0.435%) 3,269 (0.625%) 5,541 (1.060%) 33. 33 Baringo 4,254 (0.741 %) 4,457 (0.776 %) 8,711 (1.517 %) 3,532 (0.676%) 4,069 (0.778%) 7,601 (1.454%) 34. 34 Elgeyo Marakwet 3,664 (0.638 %) 3,759 (0.655 %) 7,423 (1.293 %) 2,973 (0.569%) 3,096 (0.592 %) 6,069 (1.161%) 35. 35 Busia 4,474 (0.779 %) 5,669 (0.987 %) 10,143 (1.767 %) 3,847 (0.736%) 4,957 (0.948%) 8,804 (1.684%) 36. 36 Bungoma 10,927 (1.903 %) 12,440 (2.167 %) 23,367 (4.070 %) 9,786 (1.872%) 11,776 (2.252%) 21,562 (4.124%) 37. 37 Kakamega 12,831 (2.235 %) 13,763 (2.397 %) 26,594 (4.632 %) 11,379 (2.176%) 12,747 (2.438%) 24,126 (4.614%) 38. 38 Vihiga 6,417 (1.118 %) 5,928 (1.033 %) 12,345 (2.150 %) 5,687 (1.088%) 5,760 (1.102%) 11,447 (2.189%) 39. 39 Kisumu 7,765 (1.352 %) 8,335 (1.452 %) 16,100 (2.804 %) 6,628 (1.268%) 7,683 (1.469%) 14,311 (2.737%) 40. 40 Kisii 9,473 (1.650 %) 12,255 (2.135 %) 21,728 (3.785 %) 9,010 (1.723%) 12,490 (2.389%) 21,500 (4.112%) 41. 41 Homa Bay 6,973 (1.215 %) 9,541 (1.662 %) 16,514 (2.876 %) 5,956 (1.139%) 8,716 (1.667%) 14,672 (2.806%) 42. 42 Siaya 7,000 (1.219 %) 8,349 (1.454 %) 15,349 (2.673 %) 5,790 (1.107%) 7,486 (1.432%) 13,276 (2.539%) 43. 43 Nyamira 4,511 (0.786 %) 5,258 (0.916 %) 9,769 (1.702 %) 4,243 (0.811%) 5,269 (1.008%) 9,512 (1.819%) 44. 44 Migori 5,840 (1.017 %) 8,066 (1.405 %) 13,906 (2.422 %) 5,092 (0.974%) 7,275 (1.391%) 12,367 (2.365%) 45. 45 Garissa 1,126 (0.196 %) 2,834 (0.494 %) 3,960 (0.690 %) 1,109 (0.212%) 2,708 (0.518%) 3,817 (0.730%) 46. 46 Wajir 831 (0.145 %) 1,758 (0.306 %) 2,589 (0.451 %) 669 (0.128%) 1,709 (0.327%) 2,378 (0.455%) 47. 47 Mandera 1,118 (0.195 %) 2,358 (0.411 %) 3,476 (0.605 %) 928 (0.177%) 2,293 (0.439%) 3,221 (0.616%) TOTAL 273,130 (47.57%) 300,995 (52.43%) 574,125 (100.00%) 243,581 (46.59%) 279,289 (53.41%) 522,870 (100.00%) _______________________________________________________________________________________________________________________________________________________________________________________ The 2016 Kenya Certificate of Secondary Education (KCSE) Examination Essential Statistics
  • 4. Page 4 of 13 TABLE 3: 2016 AND 2015 KCSE EXAMINATION CANDIDATURE DISTRIBUTION BY AGE County Code & Name CANDIDATES’ AGE 2016 2015 2016 2015 2016 2015 2016 2015 2016 2015 2016 2015 2016 TOTAL (%) 2015 TOTAL (%) <=16 (%) 17 & 18 (%) 19 & 20 (%) 21 & 22 (%) >=23 (%) UNSPECIFIED (%) 01 Taita Taveta 42 0.007 % 38 (0.007%) 1869 0.324 % 1542 (0.293%) 2414 0.418 % 2043 (0.389%) 751 0.130 % 793 (0.151%) 189 0.033 % 214 (0.041%) 0.000 % 2 (0.000%) 5265 0.912 % 4632 (0.881%) 02 Kwale 25 0.004 % 31 (0.006%) 1097 0.190 % 1026 (0.195%) 2625 0.455 % 2374 (0.452 ) 1719 0.298 % 1764 (0.335%) 529 0.092 % 463 (0.088%) 2 0.000 % 4 (0.001%) 5997 1.039 % 5662 (1.077%) 03 Mombasa 45 0.008 % 51 (0.010%) 2547 0.441 % 2267 (0.431%) 3760 0.651 % 3224 (0.613 ) 1320 0.229 % 1363 (0.259%) 542 0.094 % 485 (0.092%) 3 0.001 % 11 (0.002%) 8217 1.423 % 7401 (1.408%) 04 Kilifi 32 0.006 % 45 (0.009%) 1887 0.327 % 1754 (0.334%) 4852 0.841 % 4230 (0.805 ) 3418 0.592 % 3450 (0.656%) 1403 0.243 % 1151 (0.219%) 2 0.000 % 8 (0.002%) 11594 2.008 % 10638 (2.023%) 05 Tana River 24 0.004 % 16 (0.003%) 420 0.073 % 350 (0.067%) 610 0.106 % 552 (0.105 ) 269 0.047 % 186 (0.035%) 75 0.013 % 63 (0.012%) 0.000 % (0.000%) 1398 0.242 % 1167 (0.222%) 06 Lamu 5 0.001 % 12 (0.002%) 260 0.045 % 248 (0.047%) 588 0.102 % 562 (0.107 ) 326 0.056 % 365 (0.069%) 100 0.017 % 108 (0.021%) 0.000 % 2 (0.000%) 1279 0.222 % 1297 (0.247%) 07 Nyandarua 171 0.030 % 146 (0.028%) 5341 0.925 % 4623 (0.879%) 5666 0.982 % 5341 (1.016%) 1356 0.235 % 1301 (0.247%) 170 0.029 % 189 (0.036%) 8 0.001 % 11 (0.002%) 12712 2.202 % 11611 (2.208%) 08 Nyeri 185 0.032 % 165 (0.031%) 7836 1.357 % 7205 (1.370%) 6977 1.209 % 6939 (1.320%) 1308 0.227 % 1358 (0.258%) 289 0.050 % 302 (0.057%) 9 0.002 % 25 (0.005%) 16604 2.876 % 15994 (3.042%) 09 Kirinyaga 220 0.038 % 189 (0.036%) 4580 0.793 % 3814 (0.725%) 4219 0.731 % 3707 (0.705%) 1163 0.201 % 1106 (0.210%) 291 0.050 % 316 (0.060%) 2 0.000 % 11 (0.002%) 10475 1.815 % 9143 (1.739%) 10 Murang'a 395 0.068 % 372 (0.071%) 11796 2.043 % 10831 (2.060%) 9292 1.610 % 9361 (1.780%) 1905 0.330 % 2257 (0.429%) 303 0.052 % 410 (0.078%) 7 0.001 % 31 (0.006%) 23698 4.105 % 23262 (4.424%) 11 Kiambu 423 0.073 % 391 (0.074%) 16487 2.856 % 15440 (2.937%) 9504 1.646 % 10103 (1.922%) 1530 0.265 % 1676 (0.319%) 502 0.087 % 533 (0.101%) 22 0.004 % 61 (0.012%) 28468 4.932 % 28204 (5.364%) 12 Machakos 239 0.041 % 216 (0.041%) 7951 1.377 % 6630 (1.261%) 10405 1.802 % 10018 (1.905%) 3615 0.626 % 3673 (0.699%) 675 0.117 % 676 (0.129%) 27 0.005 % 64 (0.012%) 22912 3.969 % 21277 (4.047%) 13 Kitui 252 0.044 % 235 (0.045%) 4994 0.865 % 3935 (0.748%) 7848 1.360 % 6880 (1.309%) 3356 0.581 % 3381 (0.643%) 651 0.113 % 596 (0.113%) 4 0.001 % 26 (0.005%) 17105 2.963 % 15053 (2.863%) 14 Embu 167 0.029 % 131 (0.025%) 4062 0.704 % 3532 (0.672%) 4165 0.722 % 3763 (0.716%) 1566 0.271 % 1367 (0.260%) 357 0.062 % 384 (0.073%) 4 0.001 % 13 (0.002%) 10321 1.788 % 9190 (1.748%) 15 Meru 278 0.048 % 223 (0.042%) 6702 1.161 % 5609 (1.067%) 9037 1.566 % 8433 (1.604%) 3540 0.613 % 3456 (0.657%) 1017 0.176 % 1062 (0.202%) 27 0.005 % 82 (0.016%) 20601 3.569 % 18865 (3.588%) 16 Marsabit 14 0.002 % 16 (0.003%) 622 0.108 % 528 (0.100%) 589 0.102 % 542 (0.103%) 153 0.027 % 145 (0.028%) 43 0.007 % 44 (0.008%) 0.000 % 0 (0.000%) 1421 0.246 % 1275 (0.242%) 17 Isiolo 12 0.002 % 13 (0.003% 383 0.066 % 290 (0.055%) 527 0.091 % 503 (0.096%) 165 0.029 % 161 (0.031%) 58 0.010 % 40 (0.008%) 0.000 % 0 (0.000%) 1145 0.198 % 1011 (0.192%) 18 Makueni 383 0.066 % 202 (0.042%) 7139 1.237 % 5700 (1.084%) 9782 1.695 % 9195 (1.749%) 3608 0.625 % 3521 (0.670%) 502 0.087 % 493 (0.094%) 3 0.001 % 28 (0.005%) 21417 3.710 % 19215 (3.655%) 19 Tharaka Nithi 116 0.020 % 113 (0.021%) 3121 0.541 % 2904 (0.552%) 3526 0.611 % 3515 (0.669%) 1367 0.237 % 1296 (0.246%) 394 0.068 % 461 (0.088%) 5 0.001 % 8 (0.002%) 8529 1.478 % 8297 (1.578%) 20 Nairobi 366 0.063 % 322 (0.061%) 12006 2.080 % 10818 (2.057%) 9136 1.583 % 8852 (1.684%) 2544 0.441 % 2449 (0.466%) 1888 0.327 % 1804 (0.343%) 19 0.003 % 46 (0.009%) 25959 4.497 % 24291 (4.620%) 21 Turkana 16 0.003 % 32 (0.006%) 690 0.120 % 579 (0.110%) 1316 0.228 % 1040 (0.198%) 818 0.142 % 620 (0.118%) 730 0.126 % 519 (0.099%) 5 0.001 % 4 (0.001%) 3575 0.619 % 2794 (0.531%) 22 Samburu 31 24 623 484 680 637 251 242 91 111 1 1677 1498 __________________________________________________________________________________________________________________________________________________________________________________________ The 2016 Kenya Certificate of Secondary Education (KCSE) Examination Essential Statistics
  • 5. Page 5 of 13 County Code & Name CANDIDATES’ AGE 2016 2015 2016 2015 2016 2015 2016 2015 2016 2015 2016 2015 2016 TOTAL (%) 2015 TOTAL (%) <=16 (%) 17 & 18 (%) 19 & 20 (%) 21 & 22 (%) >=23 (%) UNSPECIFIED (%) 0.005 % (0.005%) 0.108 % (0.092%) 0.118 % (0.121%) 0.043 % (0.046%) 0.016 % (0.021%) 0.000 % (0.000%) 0.291 % (0.285%) 23 Trans Nzoia 281 0.049 % 189 (0.036%) 4070 0.705 % 3182 (0.605%) 5163 0.894 % 4703 (0.894%) 2313 0.401 % 2247 (0.427%) 675 0.117 % 612 (0.116%) 6 0.001 % 18 (0.003%) 12508 2.167 % 10951 (2.083%) 24 West Pokot 70 0.012 % 38 (0.007%) 1530 0.265 % 799 (0.152%) 2063 0.357 % 1941 (0.369%) 1089 0.189 % 1112 (0.211%) 430 0.074 % 380 (0.072%) 0.000 % 5 (0.001%) 5182 0.898 % 4275 (0.813%) 25 Bomet 925 0.160 % 697 (0.133%) 7325 1.269 % 5394 (1.026%) 4404 0.763 % 4134 (0.786%) 1153 0.200 % 1010 (0.192%) 258 0.045 % 221 (0.042%) 7 0.001 % 8 (0.002%) 14072 2.438 % 11464 (2.180%) 26 Uasin Gishu 280 0.049 % 180 (0.034%) 5210 0.903 % 4058 (0.772%) 5318 0.921 % 4983 (0.948%) 2012 0.349 % 1995 (0.379%) 526 0.091 % 469 (0.089%) 3 0.001 % 15 (0.003%) 13349 2.313 % 11700 (2.22 %) 27 Nakuru 504 0.087 % 369 (0.070%) 13959 2.418 % 11912 (2.266%) 13038 2.259 % 12335 (2.346%) 3468 0.601 % 3497 (0.665%) 786 0.136 % 800 (0.152%) 20 0.003 % 43 (0.008%) 31775 5.505 % 28956 (5.507%) 28 Kericho 838 0.145 % 499 (0.095%) 6551 1.135 % 5257 (1.000%) 4585 0.794 % 4583 (0.872%) 1321 0.229 % 1287 (0.245%) 340 0.059 % 315 (0.060%) 4 0.001 % 11 (0.002%) 13639 2.363 % 11952 (2.273%) 29 Nandi 226 0.039 % 160 (0.030%) 4034 0.699 % 3121 (0.594%) 5257 0.911 % 4572 (0.870%) 2493 0.432 % 2105 (0.400%) 639 0.111 % 521 (0.099%) 3 0.001 % 38 (0.007%) 12652 2.192 % 10517 (2.000%) 30 Laikipia 68 0.012 % 84 (0.016%) 2823 0.489 % 2425 (0.461%) 3234 0.560 % 2980 (0.567%) 933 0.162 % 865 (0.165%) 175 0.030 % 201 (0.038%) 4 0.001 % 21 (0.004%) 7237 1.254 % 6576 (1.251%) 31 Kajiado 152 0.026 % 119 (0.023%) 2838 0.492 % 2423 (0.461%) 3021 0.523 % 2713 (0.516%) 1097 0.190 % 966 (0.184%) 456 0.079 % 433 (0.082%) 5 0.001 % 19 (0.004%) 7569 1.311 % 6673 (1.269%) 32 Narok 212 0.037 % 180 (0.034%) 2583 0.447 % 2218 (0.422%) 2244 0.389 % 2280 (0.434%) 737 0.128 % 708 (0.135%) 166 0.029 % 179 (0.034%) 4 0.001 % 8 (0.002%) 5946 1.030 % 5573 (1.060%) 33 Baringo 397 0.069 % 301 (0.057%) 4798 0.831 % 3884 (0.739%) 2753 0.477 % 2719 (0.517%) 606 0.105 % 570 (0.108%) 193 0.033 % 148 (0.028%) 3 0.001 % 8 (0.002%) 8750 1.516 % 7630 (1.451%) 34 Elgeyo Marakwet 165 0.029 % 183 (0.035%) 3569 0.618 % 2740 (0.521%) 2780 0.482 % 2317 (0.441%) 763 0.132 % 707 (0.134%) 151 0.026 % 140 (0.027%) 12 0.002 % 5 (0.001%) 7440 1.289 % 6092 (1.159%) 35 Busia 161 0.028 % 174 (0.033%) 2735 0.474 % 2078 (0.395%) 4154 0.720 % 3798 (0.722%) 2429 0.421 % 2171 (0.413%) 692 0.120 % 600 (0.114%) 3 0.001 % 9 (0.00 %) 10174 1.762 % 8830 (1.679%) 36 Bungoma 796 0.138 % 590 (0.112%) 8345 1.446 % 6473 (1.231%) 9105 1.577 % 8937 (1.700%) 4084 0.707 % 4480 (0.852%) 1094 0.190 % 1099 (0.209%) 13 0.002 % 25 (0.005%) 23437 4.060 % 21604 (4.109%) 37 Kakamega 495 0.086 % 376 (0.072%) 8068 1.398 % 6527 (1.241%) 11310 1.959 % 10678 (2.031%) 5566 0.964 % 5406 (1.028%) 1240 0.215 % 1189 (0.226%) 8 0.001 % 17 (0.003%) 26687 4.623 % 24193 (4.601%) 38 Vihiga 182 0.032 % 130 (0.025%) 4358 0.755 % 3737 (0.711%) 5406 0.937 % 5112 (0.972%) 2040 0.353 % 2092 (0.398%) 394 0.068 % 400 (0.076%) 3 0.001 % 11 (0.002%) 12383 2.145 % 11482 (2.184%) 39 Kisumu 291 0.050 % 245 (0.047%) 5557 0.963 % 4601 (0.875%) 6899 1.195 % 6261 (1.191%) 2628 0.455 % 2565 (0.488%) 742 0.129 % 659 (0.125%) 50 0.009 % 27 (0.005%) 16167 2.801 % 14358 (2.731%) 40 Kisii 1194 0.207 % 689 (0.131%) 9310 1.613 % 8249 (1.569%) 7832 1.357 % 8744 (1.663%) 2775 0.481 % 3075 (0.585%) 811 0.140 % 802 (0.153%) 22 0.004 % 57 (0.011%) 21944 3.801 % 21616 (4.111%) 41 Homa Bay 589 0.102 % 428 (0.081%) 6394 1.108 % 4969 (0.945%) 6380 1.105 % 6145 (1.169%) 2525 0.437 % 2489 (0.473%) 706 0.122 % 682 (0.130%) 10 0.002 % 26 (0.005%) 16604 2.876 % 14739 (2.803%) 42 Siaya 233 0.040 % 162 (0.031%) 5108 0.885 % 4104 (0.781%) 6616 1.146 % 5860 (1.115%) 2790 0.483 % 2630 (0.500%) 682 0.118 % 558 (0.106%) 0.000 % 9 (0.002%) 15429 2.673 % 13323 (2.534%) 43 Nyamira 521 0.090 % 373 (0.071%) 4386 0.760 % 3658 (0.696%) 3477 0.602 % 3990 (0.759%) 1159 0.201 % 1285 (0.244%) 262 0.045 % 216 (0.041%) 10 0.002 % 34 (0.006%) 9815 1.700 % 9556 (1.817%) 44 Migori 573 0.099 % 410 (0.078%) 5549 0.961 % 4349 (0.827%) 5154 0.893 % 5037 (0.958%) 2036 0.353 % 2065 (0.393%) 668 0.116 % 590 (0.112%) 8 0.001 % 12 (0.002%) 13988 2.423 % 12463 (2.370%) 45 Garissa 36 33 937 889 1262 1358 800 745 996 835 1 2 4032 3862 _______________________________________________________________________________________________________________________________________________________________________________________ The 2016 Kenya Certificate of Secondary Education (KCSE) Examination Essential Statistics
  • 6. Page 6 of 13 County Code & Name CANDIDATES’ AGE 2016 2015 2016 2015 2016 2015 2016 2015 2016 2015 2016 2015 2016 TOTAL (%) 2015 TOTAL (%) <=16 (%) 17 & 18 (%) 19 & 20 (%) 21 & 22 (%) >=23 (%) UNSPECIFIED (%) 0.006 % (0.006%) 0.162 % (0.169%) 0.219 % (0.258%) 0.139 % (0.142%) 0.173 % (0.159%) 0.000 % (0.000%) 0.698 % (0.735%) 46 Wajir 79 0.014 % 58 (0.011%) 1081 0.187 % 897 (0.171%) 1058 0.183 % 1008 (0.192%) 258 0.045 % 297 (0.056%) 138 0.024 % 132 (0.025%) 1 0.000 % (0.000%) 2615 0.453 % 2392 (0.455%) 47 Mandera 58 0.010 % 59 (0.011%) 1193 0.207 % 1057 (0.201%) 1371 0.238 % 1331 (0.253%) 654 0.113 % 623 (0.118%) 214 0.037 % 160 (0.030%) 1 0.000 % 3 (0.001%) 3491 0.605 % 3233 (0.615%) Totals 12,767 2.21 % 9,789 (1.86%) 224,724 38.93 % 189,110 (35.97%) 231,402 40.09% 220,333 (41.91%) 83,777 14.51 % 82,922 (15.77%) 24,233 4.20% 22,765 (4.33%) 351 0.06% 868 (0.16%) 577,254 100.00 % 525,787 (100.00%) _______________________________________________________________________________________________________________________________________________________________________________________ The 2016 Kenya Certificate of Secondary Education (KCSE) Examination Essential Statistics
  • 7. Page 7 of 13 TABLE 4: 2016 KCSE EXAMINATION CENTRES BY COUNTY AND CATEGORY OF SCHOOLS County Code & Name National County Extra County Sub County Private All 01 Taita Taveta 2 (0.022 %) 8 (0.087 %) 6 (0.066 %) 57 (0.623 %) 12 (0.131 %) 85 0.929 % 02 Kwale 2 (0.022 %) 11 (0.120 %) 2 (0.022 %) 56 (0.612 %) 12 (0.131 %) 83 0.907 % 03 Mombasa 2 (0.022 %) 30 (0.328 %) (0.000 %) 9 (0.098 %) 85 (0.929 %) 126 1.376 % 04 Kilifi 3 (0.033 %) 14 (0.153 %) 3 (0.033 %) 112 (1.224 %) 54 (0.590 %) 186 2.032 % 05 Tana River 2 (0.022 %) 5 (0.055 %) 1 (0.011 %) 9 (0.098 %) 5 (0.055 %) 22 0.240 % 06 Lamu 2 (0.022 %) 1 (0.011 %) (0.000 %) 18 (0.197 %) 5 (0.055 %) 26 0.284 % 07 Nyandarua 2 (0.022 %) 10 (0.109 %) 6 (0.066 %) 137 (1.497 %) 50 (0.546 %) 205 2.239 % 08 Nyeri 3 (0.033 %) 11 (0.120 %) 16 (0.175 %) 184 (2.010 %) 27 (0.295 %) 241 2.633 % 09 Kirinyaga 2 (0.022 %) 23 (0.251 %) 6 (0.066 %) 101 (1.103 %) 18 (0.197 %) 150 1.639 % 10 Murang'a 3 (0.033 %) 16 (0.175 %) 18 (0.197 %) 263 (2.873 %) 28 (0.306 %) 328 3.583 % 11 Kiambu 9 (0.098 %) 16 (0.175 %) 13 (0.142 %) 235 (2.567 %) 108 (1.180 %) 381 4.162 % 12 Machakos 3 (0.033 %) 27 (0.295 %) 13 (0.142 %) 291 (3.179 %) 81 (0.885 %) 415 4.534 % 13 Kitui 2 (0.022 %) 65 (0.710 %) 7 (0.076 %) 281 (3.070 %) 13 (0.142 %) 368 4.020 % 14 Embu 2 (0.022 %) 20 (0.218 %) 17 (0.186 %) 141 (1.540 %) 18 (0.197 %) 198 2.163 % 15 Meru 3 (0.033 %) 76 (0.830 %) 14 (0.153 %) 257 (2.808 %) 27 (0.295 %) 377 4.118 % 16 Marsabit 2 (0.022 %) 9 (0.098 %) (0.000 %) 16 (0.175 %) 6 (0.066 %) 33 0.360 % 17 Isiolo 2 (0.022 %) (0.000 %) 2 (0.022 %) 11 (0.120 %) 7 (0.076 %) 22 0.240 % 18 Makueni 2 (0.022 %) 39 (0.426 %) 4 (0.044 %) 310 (3.386 %) 21 (0.229 %) 376 4.107 % 19 Tharakanithi 2 (0.022 %) 34 (0.371 %) 14 (0.153 %) 87 (0.950 %) 12 (0.131 %) 149 1.628 % 20 Nairobi 7 (0.076 %) 61 (0.666 %) 9 (0.098 %) 13 (0.142 %) 246 (2.687 %) 337 3.681 % 21 Turkana 2 (0.022 %) 6 (0.066 %) (0.000 %) 24 (0.262 %) 9 (0.098 %) 41 0.448 % 22 Samburu 2 (0.022 %) 6 (0.066 %) 1 (0.011 %) 10 (0.109 %) 6 (0.066 %) 25 0.273 % 23 Trans Nzoia 2 (0.022 %) 22 (0.240 %) 8 (0.087 %) 145 (1.584 %) 27 (0.295 %) 204 2.229 % 24 West Pokot 2 (0.022 %) 33 (0.360 %) 3 (0.033 %) 37 (0.404 %) 5 (0.055 %) 80 0.874 % 25 Bomet 3 (0.033 %) 26 (0.284 %) 6 (0.066 %) 176 (1.923 %) 9 (0.098 %) 220 2.403 % 26 Uasin Gishu 1 (0.011 %) 13 (0.142 %) 10 (0.109 %) 148 (1.617 %) 50 (0.546 %) 222 2.425 % 27 Nakuru 5 (0.055 %) 7 (0.076 %) 16 (0.175 %) 266 (2.906 %) 169 (1.846 %) 463 5.058 % __________________________________________________________________________________________________________________________________________________________________________________________ The 2016 Kenya Certificate of Secondary Education (KCSE) Examination Essential Statistics
  • 8. Page 8 of 13 County Code & Name National County Extra County Sub County Private All 28 Kericho 3 (0.033 %) 27 (0.295 %) 11 (0.120 %) 143 (1.562 %) 12 (0.131 %) 197 2.152 % 29 Nandi 3 (0.033 %) 28 (0.306 %) 4 (0.044 %) 174 (1.901 %) 10 (0.109 %) 219 2.392 % 30 Laikipia 2 (0.022 %) 12 (0.131 %) 1 (0.011 %) 82 (0.896 %) 19 (0.208 %) 116 1.267 % 31 Kajiado 2 (0.022 %) 7 (0.076 %) 1 (0.011 %) 58 (0.634 %) 82 (0.896 %) 150 1.639 % 32 Narok 2 (0.022 %) 7 (0.076 %) 2 (0.022 %) 91 (0.994 %) 11 (0.120 %) 113 1.234 % 33 Baringo 1 (0.011 %) 37 (0.404 %) 8 (0.087 %) 97 (1.060 %) 11 (0.120 %) 154 1.682 % 34 Elgeyo Marakwet 2 (0.022 %) 23 (0.251 %) 9 (0.098 %) 71 (0.776 %) 4 (0.044 %) 109 1.191 % 35 Busia 3 (0.033 %) 13 (0.142 %) 7 (0.076 %) 116 (1.267 %) 8 (0.087 %) 147 1.606 % 36 Bungoma 3 (0.033 %) 30 (0.328 %) 8 (0.087 %) 257 (2.808 %) 20 (0.218 %) 318 3.474 % 37 Kakamega 4 (0.044 %) 25 (0.273 %) 14 (0.153 %) 318 (3.474 %) 29 (0.317 %) 390 4.260 % 38 Vihiga 2 (0.022 %) 14 (0.153 %) 7 (0.076 %) 123 (1.344 %) 7 (0.076 %) 153 1.671 % 39 Kisumu 3 (0.033 %) 18 (0.197 %) 13 (0.142 %) 178 (1.945 %) 29 (0.317 %) 241 2.633 % 40 Kisii 3 (0.033 %) 38 (0.415 %) 18 (0.197 %) 286 (3.124 %) 27 (0.295 %) 372 4.064 % 41 Homa Bay 2 (0.022 %) 25 (0.273 %) 11 (0.120 %) 259 (2.829 %) 28 (0.306 %) 325 3.550 % 42 Siaya 4 (0.044 %) 24 (0.262 %) 10 (0.109 %) 170 (1.857 %) 6 (0.066 %) 214 2.338 % 43 Nyamira 2 (0.022 %) 19 (0.208 %) 3 (0.033 %) 163 (1.781 %) 10 (0.109 %) 197 2.152 % 44 Migori 3 (0.033 %) 21 (0.229 %) 9 (0.098 %) 175 (1.912 %) 24 (0.262 %) 232 2.534 % 45 Garissa 2 (0.022 %) 11 (0.120 %) (0.000 %) 11 (0.120 %) 29 (0.317 %) 53 0.579 % 46 Wajir 2 (0.022 %) 7 (0.076 %) (0.000 %) 30 (0.328 %) 5 (0.055 %) 44 0.481 % 47 Mandera 2 (0.022 %) 13 (0.142 %) (0.000 %) 20 (0.218 %) 12 (0.131 %) 47 0.513 % Total 124 (1.35%) 988 (10.79%) 331 (3.61 %) 6,216 (67.91%) 1,495 (16.33%) 9,154 (100%) TABLE 5: SUMMARY OF SUBJECTS WITH SIGNIFICANT IMPROVED PERFORMANCE (YEARS 2012 – 2016) _______________________________________________________________________________________________________________________________________________________________________________________ The 2016 Kenya Certificate of Secondary Education (KCSE) Examination Essential Statistics
  • 9. Page 9 of 13 CANDIDATES’ PERFORMANCE BY SUBJECT 2016 2015 2014 2013 2012 1. Art & Design 442 English 101 English 101 Kiswahili 102 Chemistry 233 2. Woodwork 444 Kiswahili 102 Kiswahili 102 Biology 231 Mathematics Alternative A 121 3. Drawing & Design 449 Mathematics Alternative A 121 Mathematics Alternative B 122 Physics 232 Geography 312 4. Computer Studies 451 Biology 231 Biology 231 History & Govt. 311 English 101 5. Kenya Sign Language 504 Physics 232 Chemistry 233 CRE 313 Home Science 441 6. Chemistry 233 History & Govt. 311 IRE 314 Physics 232 7. Biology for the Blind 236 Geography 312 Home Science 441 Woodwork 444 8. Home Science 441 CRE 313 Woodwork 444 Power Mechanics 447 9. Agriculture 443 IRE 314 Building Construction 446 Drawing & Design 449 10. Woodwork 444 Agriculture 443 Drawing & Design 449 Music 511 11. Aviation Technology 450 Woodwork 445 French 501 Woodwork 446 12. French 501 Power Mechanics 447 Arabic 503 Art & Design 442 13. Music 511 Electricity 448 Music 511 14. Drawing & Design 449 Business Studies 565 15. Computer Studies 451 05 13 15 14 12 TABLE 6: SUMMARY OF SUBJECTS WITH NO SIGNIFICANT CHANGE IN PERFORMANCE (YEARS 2012– 2016) CANDIDATES’ PERFORMANCE BY SUBJECT 2016 2015 2014 2013 2012 1. Mathematics Alternative B 122 General Science 237 Biology for the Blind 236 Biology for the blind 236 Metalwork 445 2. Biology for the Blind 236 Geography 312 General Science 237 Metalwork 445 General Science 237 3. Building Construction 446 Art & Design 442 Building Construction 446 Power Mechanics 447 German 502 4. Electricity 448 Metalwork 445 French 501 Electricity 448 Computer Studies 451 5. German 502 Building Construction 446 German 502 Aviation Technology 450 Aviation Technology 450 6. Power Mechanics 447 Kenyan Sign Language 504 7. German 502 05 07 05 06 05 TABLE 7 SUMMARY OF SUBJECTS WITH A SIGNIFICANT DECLINE IN PERFORMANCE (YEARS 2012– 2016) _______________________________________________________________________________________________________________________________________________________________________________________ The 2016 Kenya Certificate of Secondary Education (KCSE) Examination Essential Statistics
  • 10. Page 10 of 13 CANDIDATES’ PERFORMANCE BY SUBJECT 2016 2015 2014 2013 2012 1. English 101 Alternative Mathematics B 122 Mathematics Alternative A 121 English 101 Kiswahili 102 2. Kiswahili 102 History and Government 311 Physics 232 Mathematics 121 Biology 231 3. Mathematics Alternative A 121 CRE 313 Home Science 441 Alternative Mathematics B 122 CRE 313 4. Biology 231 IRE 314 Art & Design 442 Chemistry 233 IRE 314 5. Physics 232 Electricity 448 Wood Work 444 General Science 237 Agriculture 443 6. Chemistry 233 Drawing & Design 449 Aviation Technology 450 Geography 312 Arabic 503 7. General Science 237 Computer Studies 451 Arabic 503 Art & Design 442 Business Studies 565 8. History & Govt. 311 Arabic 503 Kenya Sign Language 504 Agriculture 443 History and Government 311 9. Geography 312 Kenyan Sign Language 504 Music 511 Computer Studies 451 Mathematics Alternative B 122 10. CRE 313 Business Studies 565 Business Studies 565 German 502 Electricity 448 11. IRE 314 French 501 12. Home Science 441 Kenya Sign Language 504 13. Agriculture 443 Biology for the Blind 236 14. Woodwork 445 15. Power Mechanics 447 16. Aviation Technology 450 17. French 501 18. Arabic 503 19. Music 511 20. Business Studies 565 20 10 10 10 13 _______________________________________________________________________________________________________________________________________________________________________________________ The 2016 Kenya Certificate of Secondary Education (KCSE) Examination Essential Statistics
  • 11. Page 11 of 13 TABLE 8: OVERALL NATIONAL GRADE SUMMARY FOR 2016 GENDER A A- B+ B B- C+ C C- D+ D D- E FEMALE 58 2,685 6,581 10,204 13,649 17,238 22,960 30,979 41,632 57,487 77,718 18,077 MALE 83 1,960 4,394 7,012 10,096 14,969 21,832 30,047 39,319 54,648 72,211 15,322 ALL 141 4,645 10,975 17,216 23,745 32,207 44,792 61,026 80,951 112,135 149,929 33,399 CUM % AGE 0.02 0.83 2.73 5.71 9.83 15.41 23.17 33.74 47.76 67.19 93.16 98.95 CUM. TOTAL 141 4,786 15,761 32,977 56,722 88,929 133,721 194,747 275,698 387,833 537,762 571,161 % AGE 0.02 0.80 1.90 2.98 4.11 5.58 7.76 10.57 14.02 19.43 25.97 5.79 TABLE 9 OVERALL NATIONAL GRADE SUMMARY FOR 2015 GENDER A A- B+ B B- C+ C C- D+ D D- E MALE 2024 7952 13517 19826 25312 29556 33437 37482 40181 40442 25531 3127 FEMALE 661 4117 8410 13634 19269 25214 31476 36633 38976 39113 23127 2223 ALL 2685 12069 21927 33460 44581 54770 64913 74115 79157 79555 48658 5350 CUM % AGE 0.51 2.81 6.98 13.34 21.82 32.23 44.58 58.67 73.73 88.86 98.11 99.13 CUM. TOTAL 2685 14754 36681 70141 114722 169492 234405 308520 387677 467232 515890 521240 % AGE 0.51 2.30 4.17 6.36 8.48 10.42 12.35 14.10 15.05 15.13 9.25 1.02 __________________________________________________________________________________________________________________________________________________________________________________________ The 2016 Kenya Certificate of Secondary Education (KCSE) Examination Essential Statistics
  • 12. Page 12 of 13 TABLE 10: SPECIAL NEEDS CANDIDATES WHO SAT THE YEAR 2016 AND 2015 KCSE EXAMINATIONS SPECIAL NEED CATEGORY COUNTY NAMES AND CODES BLIND LOW VISION PHYSICALLY IMPAIRED HEARING IMPAIRED 2016 2015 2016 2015 2016 2015 2016 2015 Taita Taveta (01) 00 00 01 03 01 04 00 00 Kwale (02) 00 00 04 04 03 03 00 00 Mombasa (03) 01 00 11 07 15 27 00 01 Kilifi (04) 01 00 05 09 04 06 23 17 Tana River (05) 00 00 00 01 00 00 00 00 Lamu (06) 00 00 01 00 02 01 00 00 Nyandarua (07) 00 00 01 07 02 03 00 00 Nyeri (08) 00 00 03 05 03 07 44 52 Kirinyaga (09) 00 00 03 03 03 06 00 00 Muranga (10) 00 00 04 04 07 10 24 25 Kiambu (11) 50 42 23 27 51 43 00 10 Machakos (12) 00 02 07 07 05 02 10 32 Kitui (13) 00 00 04 06 08 09 32 00 Embu (14) 00 00 05 06 06 03 00 00 Meru (15) 09 16 06 07 04 09 00 00 Marsabit (16) 00 00 00 00 01 00 00 00 Isiolo (17) 00 00 00 02 02 02 00 00 Makueni (18) 00 00 09 06 12 07 00 00 Tharaka Nithi (19) 00 00 04 01 02 01 00 00 Nairobi (20) 04 00 09 27 19 09 09 03 Turkana (21) 01 01 01 01 04 02 00 00 Samburu (22) 00 00 01 00 03 01 00 00 Trans Nzoia (23) 03 00 16 11 08 07 00 01 West Pokot (24) 08 04 06 03 08 03 00 00 Bomet (25) 01 01 01 01 06 07 11 19 Uasin Gishu (26) 00 00 11 04 05 04 00 00 Nakuru 01 01 15 05 15 13 24 21 __________________________________________________________________________________________________________________________________________________________________________________________ The 2016 Kenya Certificate of Secondary Education (KCSE) Examination Essential Statistics
  • 13. Page 13 of 13 SPECIAL NEED CATEGORY COUNTY NAMES AND CODES BLIND LOW VISION PHYSICALLY IMPAIRED HEARING IMPAIRED 2016 2015 2016 2015 2016 2015 2016 2015 (27) Kericho (28) 00 00 08 07 07 08 23 14 Nandi (29) 00 00 08 09 12 05 20 15 Laikipia (30) 00 00 03 02 04 04 00 00 Kajiado (31) 00 00 06 02 06 08 00 00 Narok (32) 00 01 04 03 02 06 00 00 Baringo (33) 00 00 02 02 04 03 00 01 Elgeyo Marakwet (34) 01 00 02 03 04 03 00 00 Busia (35) 00 00 02 02 09 07 10 05 Bungoma (36) 00 00 14 11 35 20 00 01 Kakamega (37) 00 00 04 07 13 06 53 35 Vihiga (38) 00 00 09 05 04 06 02 02 Kisumu (39) 10 16 17 16 58 43 20 03 Kisii (40) 00 00 06 09 09 13 00 28 Homa Bay (41) 00 00 14 14 12 13 00 00 Siaya (42) 11 07 10 14 04 08 29 34 Nyamira (43) 00 00 05 01 02 01 01 00 Migori (44) 00 00 11 00 11 05 51 56 Garissa (45) 00 00 05 03 10 05 01 02 Wajir (46) 00 00 01 02 04 07 00 00 Mandera (47) 00 00 04 00 03 03 00 00 TOTAL 101 91 286 269 412 363 387 377 TABLE 11: CANDIDATES WHO SAT THE YEAR 2016 AND 2015 KCSE EXAMINATION UNDER SPECIAL CIRCUMSTANCES CATEGORY 2016 2015 Candidates who sat their examination in hospitals 237 257 Candidates who sat their examination in prisons 10 08 _______________________________________________________________________________________________________________________________________________________________________________________ The 2016 Kenya Certificate of Secondary Education (KCSE) Examination Essential Statistics