
Empfohlen
Empfohlen
Weitere ähnliche Inhalte
Was ist angesagt?
Was ist angesagt? (18)
Andere mochten auch
Ähnlich wie Road map for_education_results(ccer)_april
Ähnlich wie Road map for_education_results(ccer)_april (20)
Kürzlich hochgeladen
Kürzlich hochgeladen (20)
Road map for_education_results(ccer)_april
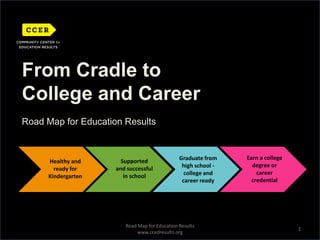
- 1. From Cradle to College and Career Road Map for Education Results 1 Earn a college degree or career credential Graduate from high school - college and career ready Supported and successful in school Healthy and ready for Kindergarten Road Map for Education Results www.ccedresults.org
- 2. 2 What is the Road Map for Education Results? The “Road Map Project” is a new collective impact initiative aimed at getting dramatic improvement in student achievement – cradle through college/career in South Seattle and South King County. Horizontal Image Area Graduate from high school- college and career ready Earn a college degree or career credential Healthy and ready for Kindergarten Supported and successful in school Road Map for Education Results www.ccedresults.org
- 3. 3 Focus on Communities with Greatest Need The Road Map for Education Results is focusing on nine communities in South Seattle and South King County. The communities are:AuburnBurienDes MoinesFederal WayKentRentonSeaTacCentral Seattle, South East Seattle and portions of South West SeattleTukwilaPortions of unincorporated King County Horizontal Image Area Road Map for Education Results www.ccedresults.org
- 4. Post Secondary attainment is increasingly important in today’s job market –especially in King County Horizontal Image Area By 2018, 67% of jobs in Washington will require postsecondary education. This is 4 percentage points above the national average of 63%. Washington ranks 6th in postsecondary education intensity for 2018. Source: The Georgetown University Center on Education and the Workforce Source: Georgetown University Center for Education and the Workforce Road Map for Education Results www.ccedresults.org 4
- 5. 5 Only 1 Out of Every 4 King County Residents Who Have a Bachelor’s Degree or Higher Were Born Here Population 25 Years and Over with Bachelor’s, Graduate or Professional Degree, by Place of Birth Percent of Degree Holders Born In State of Residence Percent of Degree Holders Born in Other State/Country 74% 71% 74% 74% 58% 51% 47% 71% 58% U.S. King County Massachusetts Minnesota Source: Jones, Dennis and Kelly, Patrick “The Emerging Policy Triangle: Economic Development, Workforce Development, and Education.” Western Interstate Commission for Higher Education (May 2007) Road Map for Education Results www.ccedresults.org
- 6. n 6 The Majority of Children in the Road Map Region are Not Ready for School When They Begin Kindergarten Percent of Kindergarten Students Meeting DIBELS Standard, by District (2009) Percent of Auburn Students Meeting DIBELS Standard, by Sub-Group (2009) 73% 61% 59% 42% 50% 41% 33% Auburn DIBELS perfor-mance, by sub-group 29% 28% 30% 26% Auburn Tukwila Highline Lake Washington (Benchmark) Renton Hispanic Asian Pacific Islander White Native Am. Black Source: 2009 DIBELS data from PSESD Road Map for Education Results www.ccedresults.org
- 7. 7 Within Our Region, Large Achievement Gaps Between Low-Income and Non-Low-Income Students Exist from an Early Age Supported and Successful in School Percent Proficient on 3rd Grade Reading (2010) Percent Proficient on 3rd Grade Reading (2010) Source: OSPI Road Map for Education Results www.ccedresults.org
- 8. 8 And Those Disparities Between Low-Income and Non-Low-Income Students Persist into Middle School. Supported and Successful in School Percent Proficient on 7th Grade Math (2010) Percent Proficient on 7th Grade Math (2010) Source: OSPI Road Map for Education Results www.ccedresults.org
- 9. Tale of Two Pipelines: Cleveland HS vs. Bellevue HS 9 Source: Graduation data from OSPI for Class of 2008, college data from College Tracking Data Services (BERC Group) for Class of 2008 Road Map for Education Results www.ccedresults.org
- 10. 2 10 Postsecondary Attainment – Particularly Among Students of Color – is Shockingly Low Student Progression, 9th Grade to College/Credential Completion 100% Asian 100% White 83% 81% Black 80% 68% 66% 66% Hispanic 61% 58% 60% Native American 45% 44% 41% 38% 40% 34% 31% 31% 25% 21% 20% 20% 12% 11% 10% 0% Graduate HS Enroll in PS Attain Credential Return for 2nd Year of PS Enrolled in 9th Grade Note: Data is for high school graduating class of 2004 in the Road Map region, including Auburn, Federal Way, Highline, Kent, Renton, Tukwila and South Seattle public schools. Seattle high schools include Cleveland, Franklin, Garfield, Rainier Beach, Sealth, and South Lake. Source: OSPI The BERC Group, College Tracking Data Services Road Map for Education Results www.ccedresults.org
- 11. Great Progress is Possible 11 Parent Child Home Program IBEST – Integrated Basic Education and Skills Training Martin Sortun Elementary Urban League Scholars “Be the Change” Road Map for Education Results www.ccedresults.org
- 12. STRIVE – Cincinnati Bridging Richmond – Richmond, VA 55,000 Degrees – Louisville, KY The Portland Schools Foundation – Portland E3 Alliance – Austin Promise Neighborhood Harlem/National Replication Ready by 21 Say Yes to Education - Syracuse 12 Other communities are organizing for action too Road Map for Education Results www.ccedresults.org
- 13. 13 Road Map Phase I – Building the Road Map Pathway to success for our students, our community, and our economy. Phase II Strategies for Action 2011 – 2012 Phase III Collective Action 2012 Phase I Building the Road Map Apr 2010 – Dec 2010 Road Map for Education Results www.ccedresults.org
- 15. % students proficient in 4thgrade math
- 16. % 9th graders who pass end of course algebra exam
- 17. % students motivated and engaged to succeed in school3
- 18. % students who are not triggering all three Early Warning indicators4
- 19. % of parents who believe a college degree is important and actively support their child’s education
- 20. % students graduating high school meeting proposed Washington State graduation requirements5
- 21. % students who take SAT/ACT and/or take a community college placement test in high school
- 22. % high school graduates who take developmental education courses in college
- 23. % students who earn a post-secondary credential by age 26
- 24. % students who enroll in postsecondary education
- 25. % students who persist year to year
- 26. % children meeting kindergarten readiness standards 2
- 27. % children accessing comprehensive medical and dental care
- 28. % eligible children enrolled in evidence-based early learning programs1We will also track a full range of indicators and wherever possible we will disaggregate by race, ethnicity and income. 2Measured by WaKIDS= Washington Kindergarten Inventory of Developing Skills; DIBELS = Dynamic Indicators of Basic Early Literacy. 3 Combination of data on internal motivation, engagement (behavior, emotional, cognitive), and academic grit from existing student climate surveys4 Triggering all three Early Warning Indicators would entail having ever had 5 absences in a school year, an F in a core course, and a suspension/expulsion. 5As per WA State Board of Education proposal.
- 29. 15 Road Map Phase II – Strategies for Action Phase II Strategies for Action 2011 – 2012 Phase III Collective Action 2012 Phase I Building the Road Map Apr 2010 – Dec 2010 Road Map for Education Results www.ccedresults.org
- 30. 16 2020 Goal Indicators Strategies K12 P- 3 HS –> College/ Career Credential Aligned Organizational Actions Data Community Engagement / Advocacy Funder Alignment Road Map for Education Results www.ccedresults.org
- 32. Define what it means to be “on track” for the 2020 goal and for closing achievement gaps
- 33. Collect and report baseline and results data; topical reports
- 34. Share reports with Road Map partners and networks
- 35. Strengthen regional data capability2015 2014 2013 2012 2011 1Collective Impact; John Kania & Mark Kramer, Stanford Social Innovation Review Winter 2011 Road Map for Education Results www.ccedresults.org
- 37. Support strong parent and youth involvementRoad Map for Education Results www.ccedresults.org
- 39. Encourage funder’s use of Road Map goals and indicators in grant making
- 40. Support opportunities for leverage and collaboration
- 41. Analyze existing Road Map resources – work on funder alignment and improved collective returnsRoad Map for Education Results www.ccedresults.org
- 42. 20 2020 Goal Indicators Strategies K12 P- 3 HS –> College/ Career Credential Aligned Organizational Actions Data Community Engagement / Advocacy Funder Alignment Road Map for Education Results www.ccedresults.org
- 44. % of high school graduates who meet proposed Washington State graduation requirements
- 45. % students who take SAT/ACT and/or take community college placement test in high school
- 47. % students proficient in 3rd grade reading
- 48. % students proficient in 4th grade math
- 49. % elementary students who start and complete the year at the same school
- 50. % students in 6th grade passing all classes (C or above in all classes)
- 51. % students proficient in 7th grade math and reading
- 52. % students proficient in 8th grade science
- 53. % 9th graders who pass end of course algebra exam
- 54. % students in 9th grade passing of all core classes with a grade level C or above
- 55. % students proficient in 10th grade math
- 56. % students motivated and engaged to succeed in school
- 57. % students who are not triggering all three Early Warning indicators4 (ever having had 5 absences in a school year, and an F in a core course, and a suspension/expulsion )
- 58. % of parents who believe a college degree is important and actively support their child’s education
- 59. % of schools that are rated “Good” (4.00) or better on the State Accountability Index
- 60. % of ELL students who gain one or more level of English proficiency each year
- 61. % eligible 8th-12th graders signed up for and on track to receive College Bound scholarship
- 62. % of students triggering less than 6 of 13 physical/mental health and safety items on the Healthy Youth Survey
- 64. % children utilizing a health care home
- 65. % eligible children enrolled in ECEAP, Early Head Start, Head Start, and other evidence-based early learning programs,
- 66. % children with untreated tooth decay
- 67. % families reading to their children daily
- 68. % children born less than 2500 grams
- 69. % mothers who report breastfeeding at 2 months post partum
- 70. % children ages birth to 5 identified as having special learning needs who received appropriate services
- 71. % licensed child care centers and family home child care providers performing at Level 3 or above on an Environmental Rating Scale(ERS)
- 73. % of students on Free & Reduced Lunch who received a PELL grant
- 74. % students who enroll in postsecondary education
- 75. % students who persist year to year
- 76. % students enrolled in postsecondary education who complete college-level English and math within one year of enrollment
- 77. % students enrolled in postsecondary education who complete 30 college level credits within two years of enrollment
- 78. % students employed within 1 year and 5 years after completing or leaving postsecondary education, including wage
- 79. % of students who did not complete high school who achieve a postsecondary credentialBolded indicators = data is readily obtainable. Recommendations provided by Road Map work groups
- 81. % eligible children enrolled in ECEAP, Early Head Start, Head Start, and other evidence-based early learning programs,
- 83. % students motivated and engaged to succeed in school
- 85. % students proficient in 4th grade math
- 86. % elementary students who start and complete the year at the same school
- 87. % students proficient in 7th grade math and reading
- 88. % students motivated and engaged to succeed in school
- 89. % students who are not triggering all three Early Warning indicators4 (ever having had 5 absences in a school year, and an F in a core course, and a suspension/expulsion)
- 90. % of parents who believe a college degree is important and actively support their child’s education
- 91. % of ELL students who gain one or more level of English proficiency each year
- 92. % of schools that are rated “Good” (4.00) or better on the State Accountability Index
- 93. % eligible 8th-12th graders signed up for and on track to receive College Bound scholarship
- 95. % students proficient in 4th grade math
- 96. % students in 6th grade passing all classes (C or above in all classes)
- 97. % students proficient in 7th grade math and reading
- 98. % students in 9th grade passing of all core classes with a grade level C or above
- 99. % students proficient in 10th grade math
- 101. % children utilizing a health care home
- 103. % of students on Free & Reduced Lunch who received a PELL grant
- 104. % students who enroll in postsecondary education
- 105. % students who persist year to year
- 106. % students enrolled in postsecondary education who complete college-level English and math within one year of enrollment
- 107. % students enrolled in postsecondary education who complete 30 college level credits within two years of enrollment
- 108. % students employed within 1 year and 5 years after completing or leaving postsecondary education, including wage
- 110. % students proficient in 4th grade math
- 111. % 9th graders who pass end of course algebra exam
- 112. % elementary students who start and complete the year at the same school
- 113. % students motivated and engaged to succeed in school
- 114. % students who are not triggering all three Early Warning indicators(ever having had 5 absences in a school year, and an F in a core course, and a suspension/expulsion )
- 115. % of parents who believe a college degree is important and actively support their child’s education
- 116. % % of ELL students who gain one or more level of English proficiency each year
- 117. % children meeting standard on WaKIDS or measures of early literacy, e.g. DIBELS
- 118. % children utilizing a health care home
- 120. % students who take SAT/ACT and/or take community college placement test in high school
- 121. % high school graduates who take developmental education courses in collegeEarly Childhood Indicators:
- 122. 28 2020 Goal Indicators Strategies K12 P- 3 HS –> College/ Career Credential Aligned Organizational Actions Data Community Engagement / Advocacy Funder Alignment Road Map for Education Results www.ccedresults.org
- 123. Road Map for Education Results 29 Building the “how” together Community Network Building awareness and public will for change Strategy Work Groups Building a common agenda K-12 and Community College Presidents Group Connecting system leaders Education Results Network Provide input and building connections Road Map Aligned Funders Investing for greater system impact The Road Map Project Data Advisors Ensuring it all adds up Project Sponsors Provide strategic direction CCER Staff and Consultant Team
- 124. 30 Graduate from high school - college and career ready Earn a college degree or career credential Healthy and ready for Kindergarten Supported and successful in school Thank You! Road Map for Education Results www.ccedresults.org