Web Performance Internals explained for Developers and other stake holders.
•
1 gefällt mir•742 views

Web Performance Internals explained for Developers and others 1. Starting with How Internet Works 2. How Browser Works 3. How to measure Web performance 4. Concluded with tips to Developers and Power users on Improving Web Performance

Empfohlen
Empfohlen
Weitere ähnliche Inhalte
Was ist angesagt?
Was ist angesagt? (17)
Andere mochten auch
Andere mochten auch (8)
Ähnlich wie Web Performance Internals explained for Developers and other stake holders.
Ähnlich wie Web Performance Internals explained for Developers and other stake holders. (20)
Kürzlich hochgeladen
Kürzlich hochgeladen (20)
Web Performance Internals explained for Developers and other stake holders.
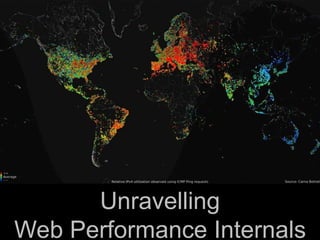
- 1. 2014 TBC-World 1 Unravelling Web Performance Internals
- 2. 2014 TBC-World 2 Internet is built with trust in mind between nodes Scalable Decentralized Architecture, open to add remove any number of nodes IP Addresses, Protocols SOME BASICS ON INTERNET!
- 3. 2014 TBC-World 3 LATENCY: DISTANCE, ROUTE/TRAFFIC,PACKET LOSS LAST MILE
- 4. 2014 TBC-World 4 Web Performance Matters Foundation of “User Experience” Web performance is widely mis-understood! TIME(SPEED) IS MONEY!
- 5. 2014 TBC-World 5 PERCIEVED EXP. VS REAL PERF. If measured objectively, both site would have looked to have taken same amount of time to Load. But, perceived performance has a lot to do with when is the “Document Ready” Sometimes, all that requires is “Perceived Experience” than real performance numbers! E.g. Effect on a Button Click
- 7. 2014 TBC-World 7 Hundreds of files to load in a Web Address Sometimes more than a Megabyte to download Developer Errors HTTP 1.1 is not that great 100s of resources, Render blocking scripts, DNS resolutions, Multiple downloads, Bandwidth, Latency Not clear priority on critical performance areas USERS ARE NOT READY TO WAIT!
- 8. 2014 TBC-World 8 LET US GO UNDER THE HOOD Your Computer: Client / Browser Sea of Servers, Cloud DNS (Resolving NS, Root NS, TLD NS, Authoritative NS) IP Address, TCP Handshake Network HTTP Request, HTTP Response Binary data, Encode HTML (metadata, body) SESSION CSS,JS,AJAX/XML HTTP REQUESTS
- 9. 2014 TBC-World 9 A WEB ADDRESS Amazon’s target in major US Cities • <200 ms to First Byte (TTFB) • <500 ms to Above the Fold content • <2000 ms to complete a page load
- 10. 2014 TBC-World 10 What a Desktop/Mobile Browser is expected to do at the Blink of an EYE!
- 11. 2014 TBC-World 11 HTTP REQUEST AND RESPONSE HTML DOM CSS Images JS
- 12. 2014 TBC-World 12 IMPORTANT TO IMPROVE WEB PERF. Image Source: Radware Bringing it from 16+ sec to 7-8 sec is the easier part •Bringing it under 4 sec is the real challenge •Easy to blame Hardware – but that may not be the issue Mature Optimization is the key
- 13. 2014 TBC-World 13 Round Trip Time, Response Time Throughput Latency Load Time, time to First Byte Payload DNS Lookup times End user Experience on Real Browsers Type of Payload Level of Caching On Load Performance Web Perf. on Phone, Web, Tab, Desktop GTMetrix.com, Webpagetest.org, Pingdom YSlow, Google Page Speed test Device Simulators Grinder, jMeter, Load Runner: Performance under stress/load Google Analytics (For real PROD numbers ) How to Measure and Analyze? What to Measure?
- 14. 2014 TBC-World 14 BUT, DO WE KNOW HOW TO INTERPRET RESULTS?
- 15. 2014 TBC-World 15 WHAT COULD BE WRONG? Test conditions # of Resources to Load and Type of resources Ordering of Resources Trouble maker resources -HTTP Statuses Too late to paint? Lack of Caching? Too many connections to same host? Large Time to First Byte? Too many plugins? Total Payload, Too many images? Pages landing to naked domain or www?
- 16. 2014 TBC-World 16 COMPARE Payload Grade #of Requests Caching Other params
- 17. 2014 TBC-World 17 REAL WORLD PERF. Beware of Averages Performance of all Pages and not just Home page or few pages Beware of route congestions on specific routes on specific days/time
- 18. 2014 TBC-World 18 PERF. WHEN STRESSED Find the max throughput under a reasonable Response time variance Repeat Load Tests with several perf tuning steps including HW spec changes
- 19. 2014 TBC-World 19 WPO (WEB PERFORMANCE OPTIMISATION) FACTORS Locations of the Client Browser Server Location, CDN Edge locations Bandwidth, Type of Connectivity (2G, 3G, 4G, DSL, Fiber, Cable) Type of Browser – some browsers are Smarter Client and Server Config, Scale horizontal, Scale Vertical Cloud, PAAS or IAAS Cloud One size fits all Language frameworks, CMS Frameworks, e-COM Frameworks, jQuery Libraries, Boiler plate templates could impact perf. Payload of the page ISPs, Traffic en-Route # of Trans/Load on the server Web Stack: OS, Web Server, Relational DB Servers, Programming Lang, No SQL Databases JSON vs XML Async, Lazy Loading Responsive vs Device Type Specific
- 20. 2014 TBC-World 20 DEEP INTO WPO FACTORS Front End Optimization Sprites, Compression Static/Dynamic Page Caching Bundling File Minification Domain Sharding Browser Caching Image Optimization, Progressive jPEG Defer JS parsing DB Caching and Indexing Efficient Code SSD Drives, IOPS optimized Drives DDOS counters, Defenders HTTP1.1,HTTPS, SPDY, HTTP2 All the Fancy Scripts (Analytics, Effects, Social share scripts etc..) LESSER CNAMEs HTTP Failure Statuses
- 21. 2014 TBC-World 21 Understand the need – A sub 4 sec load time may not be what all customers are looking for. If sub 4 sec load is required, check if it is required in all pages – get Clarity Get the “Buy-in” for agreed numbers from all stakeholders Do not let the perf measurement and tuning be the first casuality in the rush to the reduce time to market(TTM), and while shipping a minimum viable product (MVP) ACTION STEPS
- 22. 2014 TBC-World 22 Build it Right, Deploy it right: Follow best practices. Everyone must be aware: Do share perf tips learned here with your team! Eliminate 404 and un-necessary redirects Reduce # of images, Optimize images, Compress, Minimize payload, bundle Cache it right, Use CDN, Avoid too many hosts but not too less too. Interpret Page test results correctly and take action Write Quality code – High Performance code Put Special Focus on Front-End, a typical problem area Identify critical screens, too much focus on home page can backfire ACTION STEPS
- 23. 2014 TBC-World 23 Benchmark/Optimize/Automate: Conduct User Experience Studies. Conduct Perf. tests on load and otherwise Benchmark/Optimize: Make Page speed test (Use Yslow or Google speed test) part of regular sprint test. If possible, automate it right into continuous integration scripts , where possible. Consider Deployment of Dynamic Site Acceleration Solutions like Akamai/YOTTA when demands are for sub 3 sec page load, across geographies ACTION STEPS
- 24. 2014 TBC-World 24 My Coordinates: linkedin.com/in/sreejeshkm http://www.slideshare.net/sreejeshkm THANK YOU Image Sources: Radware, Akamaii,
Hinweis der Redaktion
- http://www.akamai.com/html/technology/dataviz1.html
- http://www.akamai.com/html/technology/dataviz1.html
- http://www.akamai.com/html/technology/dataviz1.html
- Web Performance Optimization - WPO