Data Mining
•Als DOCX, PDF herunterladen•
1 gefällt mir•1,934 views

Data mining (DM) manual. Data mining refers to the process of analysing the data from different perspectives and summarizing it into useful information. Data mining software is one of the number of tools used for analysing data. It allows users to analyse from many different dimensions and angles, categorize it, and summarize the relationship identified. Data mining is about technique for finding and describing Structural Patterns in data.

Empfohlen
Empfohlen
Weitere ähnliche Inhalte
Andere mochten auch
Andere mochten auch (16)
Ähnlich wie Data Mining
Ähnlich wie Data Mining (20)
Mehr von Sonali Parab
Mehr von Sonali Parab (18)
Kürzlich hochgeladen
Kürzlich hochgeladen (20)
Data Mining
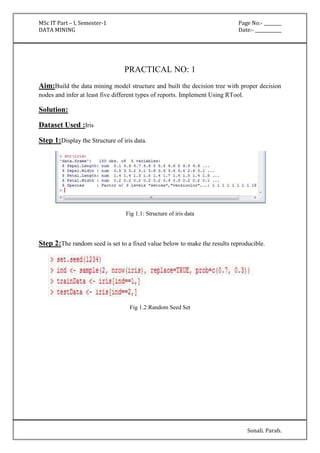
- 1. MSc IT Part – I, Semester-1 Page No:- ________ DATA MINING Date:- ____________ Sonali. Parab. PRACTICAL NO: 1 Aim:Build the data mining model structure and built the decision tree with proper decision nodes and infer at least five different types of reports. Implement Using RTool. Solution: Dataset Used :Iris Step 1:Display the Structure of iris data. Fig 1.1: Structure of iris data Step 2:The random seed is set to a fixed value below to make the results reproducible. Fig 1.2:Random Seed Set
- 2. MSc IT Part – I, Semester-1 Page No:- ________ DATA MINING Date:- ____________ Step 3:Install the party package if it is not installed. Load the party package, build adecision tree, and check the prediction result. Sonali. Parab. Fig 1.3: Load Party library Fig 1.4: iris table Step 4:printing the rules and plot the tree Fig 1.5: Rules of data
- 3. MSc IT Part – I, Semester-1 Page No:- ________ DATA MINING Date:- ____________ Sonali. Parab. A. Report 1 Fig 1.6: Decision Tree
- 4. MSc IT Part – I, Semester-1 Page No:- ________ DATA MINING Date:- ____________ Sonali. Parab. Step 5:Plot Decision tree in simple style Fig 1.7: Command to plot decision tree in simple style B. Report 2 Fig 1.8: Decision tree (Simple Style)
- 5. MSc IT Part – I, Semester-1 Page No:- ________ DATA MINING Date:- ____________ Sonali. Parab. Step 6:Plot iris species in bar plot Fig 1.9: bar plot command C. Report 3 Fig 1.10:Barplot of Species
- 6. MSc IT Part – I, Semester-1 Page No:- ________ DATA MINING Date:- ____________ Sonali. Parab. Step 7:Plot iris Species in pie chart Fig 1.11: Command for pie chart D. Report 4 Fig 1.12: Pie Chart
- 7. MSc IT Part – I, Semester-1 Page No:- ________ DATA MINING Date:- ____________ Sonali. Parab. Step 8:Plot histogram of iris Petal Length Fig 1.13: Command to plot histogram E. Report 5 Fig 1.14: Histogram of iris Petal Length
- 8. MSc IT Part – I, Semester-1 Page No:- ________ DATA MINING Date:- ____________ Sonali. Parab. PRACTICAL NO: 2 Aim:Build the data mining model structure and Implement Naïve Bayes Algorithm. Implement Using WEKA. Solution: Dataset Used :Diabetes.arff Step 1:Pre-processing Go to WekaOpen file go to weka folder select diabetes.arff dataset open Fig 2.1 Choosing diabetes.arff dataset
- 9. MSc IT Part – I, Semester-1 Page No:- ________ DATA MINING Date:- ____________ Sonali. Parab. Step 2:Filter the data FilterssuperviseddiscretizeApply Fig 2.2 Selecting the Filter Fig 2.3 Structure of Filtered Diabetes.arff Dataset
- 10. MSc IT Part – I, Semester-1 Page No:- ________ DATA MINING Date:- ____________ Sonali. Parab. Step 3:Classify the data using Naïve Bayes Algorithm Fig 2.4 Select Classification Algorithm Fig 2.5 Running and Displaying Result
- 11. MSc IT Part – I, Semester-1 Page No:- ________ DATA MINING Date:- ____________ Sonali. Parab. === Run information === Scheme:weka.classifiers.bayes.NaiveBayes Relation: pima_diabetes-weka.filters.supervised.attribute.Discretize-Rfirst-last Instances: 768 Attributes: 9 preg plas pres skin insu mass pedi age class Test mode:10-fold cross-validation === Classifier model (full training set) === Naive Bayes Classifier Class Attribute tested_negative tested_positive (0.65) (0.35) ==================================================== preg
- 12. MSc IT Part – I, Semester-1 Page No:- ________ DATA MINING Date:- ____________ Sonali. Parab. '(-inf-6.5]' 427.0 174.0 '(6.5-inf)' 75.0 96.0 [total] 502.0 270.0 plas '(-inf-99.5]' 182.0 17.0 '(99.5-127.5]' 211.0 79.0 '(127.5-154.5]' 86.0 77.0 '(154.5-inf)' 25.0 99.0 [total] 504.0 272.0 pres 'All' 501.0 269.0 [total] 501.0 269.0 skin 'All' 501.0 269.0 [total] 501.0 269.0 insu '(-inf-14.5]' 237.0 140.0 '(14.5-121]' 165.0 28.0 '(121-inf)' 101.0 103.0 [total] 503.0 271.0 mass '(-inf-27.85]' 196.0 28.0
- 13. MSc IT Part – I, Semester-1 Page No:- ________ DATA MINING Date:- ____________ Sonali. Parab. '(27.85-inf)' 306.0 242.0 [total] 502.0 270.0 pedi '(-inf-0.5275]' 362.0 149.0 '(0.5275-inf)' 140.0 121.0 [total] 502.0 270.0 age '(-inf-28.5]' 297.0 72.0 '(28.5-inf)' 205.0 198.0 [total] 502.0 270.0 Time taken to build model: 0 seconds
- 14. MSc IT Part – I, Semester-1 Page No:- ________ DATA MINING Date:- ____________ Sonali. Parab. Step 4: Visualize classifiers errors Fig 2.6 Visualization of Classification Errors
- 15. MSc IT Part – I, Semester-1 Page No:- ________ DATA MINING Date:- ____________ Sonali. Parab. PRACTICAL NO: 3 Aim:Implement the clustering Algorithm By Using Weka Tool. Solution: Dataset Used :Iris.arff Step 1:Preprocess Open file go to weka folder select iris dataset Choose Filterssuperviseddiscretize Fig 3.1: Structure of iris data
- 16. MSc IT Part – I, Semester-1 Page No:- ________ DATA MINING Date:- ____________ Sonali. Parab. Fig 3.2: Filtering the Data Fig 3.3: Filtered Dataset
- 17. MSc IT Part – I, Semester-1 Page No:- ________ DATA MINING Date:- ____________ Sonali. Parab. Step 2:Cluster Select cluster tabchoose button clusterers select simplekmeans click radio button use training setright click “Poperties” numClusters= 3click start button. Fig 3.4 Configuring Clustering Algorithm Fig 3.5 Generating Result
- 18. MSc IT Part – I, Semester-1 Page No:- ________ DATA MINING Date:- ____________ Sonali. Parab. === Run information === Scheme:weka.clusterers.SimpleKMeans -N 3 -A "weka.core.EuclideanDistance -R first-last" -I 500 -S 10 Relation: iris-weka.filters.supervised.attribute.Discretize-Rfirst-last Instances: 150 Attributes: 5 sepallength sepalwidth petallength petalwidth class Test mode:evaluate on training data === Model and evaluation on training set === kMeans ====== Number of iterations: 5 Within cluster sum of squared errors: 109.0 Missing values globally replaced with mean/mode Cluster centroids: Cluster#
- 19. MSc IT Part – I, Semester-1 Page No:- ________ DATA MINING Date:- ____________ Sonali. Parab. Attribute Full Data 0 1 2 (150) (50) (50) (50) ===================================================== sepallength '(-inf-5.55]' '(-inf-5.55]' '(5.55-6.15]' '(6.15-inf)' sepalwidth '(-inf-2.95]' '(3.35-inf)' '(-inf-2.95]' '(2.95-3.35]' petallength '(4.75-inf)' '(-inf-2.45]' '(2.45-4.75]' '(4.75-inf)' petalwidth '(0.8-1.75]' '(-inf-0.8]' '(0.8-1.75]' '(1.75-inf)' class Iris-setosa Iris-setosa Iris-versicolor Iris-virginica Time taken to build model (full training data) : 0 seconds === Model and evaluation on training set === Clustered Instances 0 50 ( 33%) 1 50 ( 33%) 2 50 ( 33%)
- 20. MSc IT Part – I, Semester-1 Page No:- ________ DATA MINING Date:- ____________ Sonali. Parab. Step 4:Visualizing the Result Right click on resultvisualize cluster assignments Fig 3.6 Selecting Visualization Fig 3.7 Displaying Visualization Result
- 21. MSc IT Part – I, Semester-1 Page No:- ________ DATA MINING Date:- ____________ Sonali. Parab. PRACTICAL NO: 4 Aim :Build the basic Time series model structure and create the predictions BodyFatDataset.By Using RTool. Solution: Dataset Used :BodyFat Step 1 :load Package mboost. Fig 4.1 : Show the load Of Package mboost.
- 22. MSc IT Part – I, Semester-1 Page No:- ________ DATA MINING Date:- ____________ Sonali. Parab. Step2 :To Show Data stored in BodyFat Dataset. Fig 4.2 : Show The Data stored in BodyFat Dataset. Step 3 :Select the Summary Of BodyFat Dataset. Fig 4.3 :Show The Summary Of BodyFat Dataset.
- 23. MSc IT Part – I, Semester-1 Page No:- ________ DATA MINING Date:- ____________ Sonali. Parab. Step4 :Using Predication Method And Plot Graph On BodyFat Dataset. Fig 4.4 : Show Predication Method And Plot Graph Formula ApplyOn BodyFat Dataset. Step5 :Predication Graph For BodyFat Dataset. Fig 4.5 :Show The Predication Graph For BodyFat Dataset.
- 24. MSc IT Part – I, Semester-1 Page No:- ________ DATA MINING Date:- ____________ Sonali. Parab. PRACTICAL NO: 5 Aim:Build the data mining model and implement k-nearest neighbor By Using Weka Tool. Solution: Dataset Used:ContactLenses.arff Step 1:Preprocess Open file go to weka folder select contact lens dataset Choose Filterssuperviseddiscretize Fig 5.1: Structure of contact lens dataset
- 25. MSc IT Part – I, Semester-1 Page No:- ________ DATA MINING Date:- ____________ Sonali. Parab. Fig 5.2: Filtering the Data Fig 5.3:Filtered Dataset
- 26. MSc IT Part – I, Semester-1 Page No:- ________ DATA MINING Date:- ____________ Sonali. Parab. Step 2:Classify Select classify tabchoose buttonexpand Lazy folderselect IBKclick radio button use training setclick start button. Fig 5.4 Choosing K-nearest neighbour algorithm Fig 5.5 Generating Result
- 27. MSc IT Part – I, Semester-1 Page No:- ________ DATA MINING Date:- ____________ Sonali. Parab. === Run information === Scheme:weka.classifiers.lazy.IBk -K 1 -W 0 -A "weka.core.neighboursearch.LinearNNSearch -A "weka.core.EuclideanDistance -R first-last"" Relation: contact-lenses-weka.filters.supervised.attribute.Discretize-Rfirst-last Instances: 24 Attributes: 5 age spectacle-prescrip astigmatism tear-prod-rate contact-lenses Test mode:evaluate on training data === Classifier model (full training set) === IB1 instance-based classifier using 1 nearest neighbour(s) for classification Time taken to build model: 0 seconds === Evaluation on training set === === Summary === Correctly Classified Instances 24 100 %
- 28. MSc IT Part – I, Semester-1 Page No:- ________ DATA MINING Date:- ____________ Sonali. Parab. Incorrectly Classified Instances 0 0 % Kappa statistic 1 Mean absolute error 0.0494 Root mean squared error 0.0524 Relative absolute error 13.4078 % Root relative squared error 12.3482 % Total Number of Instances 24 === Detailed Accuracy By Class === TP Rate FP Rate Precision Recall F-Measure ROC Area Class 1 0 1 1 1 1 soft 1 0 1 1 1 1 hard 1 0 1 1 1 1 none Weighted Avg. 1 0 1 1 1 1 === Confusion Matrix === a b c <-- classified as 5 0 0 | a = soft 0 4 0 | b = hard 0 0 15 | c = none
- 29. MSc IT Part – I, Semester-1 Page No:- ________ DATA MINING Date:- ____________ Sonali. Parab. PRACTICAL NO: 6 Aim:Build the data mining model and implement k-nearest neighbor By Using Weka Tool. Solution: Dataset Used:Supermarket.arff Step 1:Preprocess Open file go to Weka folder select Supermarket dataset Choose FiltersAll Filter Fig 6.1: Structure of Supermarket dataset
- 30. MSc IT Part – I, Semester-1 Page No:- ________ DATA MINING Date:- ____________ Sonali. Parab. Fig 6.2: Filtering the Data Fig 6.3: Filtered Dataset
- 31. MSc IT Part – I, Semester-1 Page No:- ________ DATA MINING Date:- ____________ Sonali. Parab. Step 2:Associate Select Associate tabchoose apriori algorithmpropertiesconfigure algorithm according to requirementsclick ‘start’ Fig 6.4 Choosing Apriori Algorithm Fig 6.5 Configuring Algorithm
- 32. MSc IT Part – I, Semester-1 Page No:- ________ DATA MINING Date:- ____________ Sonali. Parab. Fig 6.6 Displaying Association Results === Run information === Scheme: weka.associations.Apriori -N 12 -T 0 -C 0.9 -D 0.05 -U 1.0 -M 0.1 -S -1.0 -c -1 Relation: supermarket-weka.filters.AllFilter-weka.filters.AllFilter-weka.filters.AllFilter-weka. filters.AllFilter-weka.filters.MultiFilter-Fweka.filters.AllFilter-weka.filters.AllFilter-weka. filters.AllFilter Instances: 4627 Attributes: 217 [list of attributes omitted] === Associator model (full training set) ===
- 33. MSc IT Part – I, Semester-1 Page No:- ________ DATA MINING Date:- ____________ Sonali. Parab. Apriori ======= Minimum support: 0.15 (694 instances) Minimum metric <confidence>: 0.9 Number of cycles performed: 17 Generated sets of large itemsets: Size of set of large itemsets L(1): 44 Size of set of large itemsets L(2): 380 Size of set of large itemsets L(3): 910 Size of set of large itemsets L(4): 633 Size of set of large itemsets L(5): 105 Size of set of large itemsets L(6): 1 Best rules found: 1. biscuits=t frozen foods=t fruit=t total=high 788 ==> bread and cake=t 723 conf:(0.92) 2. baking needs=t biscuits=t fruit=t total=high 760 ==> bread and cake=t 696 conf:(0.92) 3. baking needs=t frozen foods=t fruit=t total=high 770 ==> bread and cake=t 705 conf:(0.92)
- 34. MSc IT Part – I, Semester-1 Page No:- ________ DATA MINING Date:- ____________ 4. biscuits=t fruit=t vegetables=t total=high 815 ==> bread and cake=t 746 conf:(0.92) 5. party snack foods=t fruit=t total=high 854 ==> bread and cake=t 779 conf:(0.91) 6. biscuits=t frozen foods=t vegetables=t total=high 797 ==> bread and cake=t 725 conf:(0.91) 7. baking needs=t biscuits=t vegetables=t total=high 772 ==> bread and cake=t 701 conf:(0.91) Sonali. Parab. 8. biscuits=t fruit=t total=high 954 ==> bread and cake=t 866 conf:(0.91) 9. frozen foods=t fruit=t vegetables=t total=high 834 ==> bread and cake=t 757 conf:(0.91) 10. frozen foods=t fruit=t total=high 969 ==> bread and cake=t 877 conf:(0.91) 11. baking needs=t fruit=t vegetables=t total=high 831 ==> bread and cake=t 752 conf:(0.9) 12. biscuits=t milk-cream=t total=high 907 ==> bread and cake=t 820 conf:(0.9)
- 35. MSc IT Part – I, Semester-1 Page No:- ________ DATA MINING Date:- ____________ Sonali. Parab. PRACTICAL NO: 7 Aim:Build the data mining model and implement k-nearest neighbor By Using Weka Tool. Solution: Dataset Used:Titanic Step 1:Preprocess Loading the Data in Data Frame Transforming the Data into Suitable Format Fig 7.1: Structure of Titanic dataset
- 36. MSc IT Part – I, Semester-1 Page No:- ________ DATA MINING Date:- ____________ Sonali. Parab. Fig 7.2 Summary of Titanic Dataset Step 2:Associate Loading library ‘arules’ that contains functions for Association mining Function used to apply Apriori Algorithm with Default Configuration Fig 7.3 Choosing Apriori Algorithm
- 37. MSc IT Part – I, Semester-1 Page No:- ________ DATA MINING Date:- ____________ Sonali. Parab. Fig 7.4 Inspecting the Results of Apriori Algorithm Fig 7.5 Applying Settings to Display Rules with RHS containing survived only
- 38. MSc IT Part – I, Semester-1 Page No:- ________ DATA MINING Date:- ____________ Sonali. Parab. Step 3:Finding and Removing Redundant Rules Code to Find Redundant Rules Code to Remove Redundant Rules Fig 7.6 Finding & Removing Redundant Rules
- 39. MSc IT Part – I, Semester-1 Page No:- ________ DATA MINING Date:- ____________ Sonali. Parab. Step 4:Visualizing: Loading library aulesViz which contains functions for Visualizing Assoication Results Function to plot Results Using Scatter Plot X axis: Support Y axis:Confidence Fig 7.7 Scatter Plot
- 40. MSc IT Part – I, Semester-1 Page No:- ________ DATA MINING Date:- ____________ Sonali. Parab. Function to plot Association Results as Graph Plot Fig 7.8 Graph Plot Showing How Data Items are Assoicated
- 41. MSc IT Part – I, Semester-1 Page No:- ________ DATA MINING Date:- ____________ Sonali. Parab. PRACTICAL NO: 8 Aim:Consider the suitable data for text mining and Implement the Text Mining technique using R-Tool. Solution: Dataset Used:Plain Text File (www.txt) Step 1:Loading the Text File Loading Essential Libraries for Text Mining tm, SnowballC and twitteR Loading The Data From Text File Into RTool Using readLines() Fig 8.1: Using tail() and head() functions to display start and of paragraphs
- 42. MSc IT Part – I, Semester-1 Page No:- ________ DATA MINING Date:- ____________ Sonali. Parab. Step 2:Transforming Loading tm library and transforming document to Corpusdoc Fig 8.2 Inspecting Corpusdoc Function to Remove Punctuations Fig 8.3 Removing Punctuations
- 43. MSc IT Part – I, Semester-1 Page No:- ________ DATA MINING Date:- ____________ Sonali. Parab. Function to Strip White Spaces Fig 8.4 Stripping White Spaces Function to Remove Stop Words from Document Fig 8.5 Removing Stop Words From Document
- 44. MSc IT Part – I, Semester-1 Page No:- ________ DATA MINING Date:- ____________ Sonali. Parab. Function to Stem the Document Fig 8.6 Stemming the Document Function to Convert corpusdoc to TermDocumentMatrix Fig 8.7 Inspecting TermDocumentMatrix
- 45. MSc IT Part – I, Semester-1 Page No:- ________ DATA MINING Date:- ____________ Sonali. Parab. Step 3:Finding Frequent Terms in Document Fig 8.7 Find Frequent Terms From Document Step 4:Finding Association among terms Function to find Association among Different terms in Document Fig 8.8 Result of How Strongly Terms Are Associated with Term “information”