SlideShare ist ein Scribd-Unternehmen logo
1 von 11
Mnemonic 1 The framework
Walmart Industry Classification ,[object Object],[object Object],[object Object],[object Object],[object Object],[object Object],[object Object]
4521 45211 452110 4521101 4521102 4521103 452 44-45 Retail Trade General Merchandise Stores Department Stores Department Stores Department Stores Conventional Dept. Stores Discount or Mass Merchants National Chain Dept. Stores Walmart NAICS Chart Lance Kawamoto
http://www.census.gov/epcd/naics02/naicod02.htm   http://www.census.gov/epcd/naics02/N2SIC44.HTM#N452 Sandro Olivieri 2002 NAICS Code 1987 SIC Code NAICS Industry Definition 452 General Merchandise Stores –  retail new general merchandise from fixed point-of-sale locations. Establishments in this subsector are unique in that they have the equipment and staff capable of retailing a large variety of goods from a single location. This includes a variety of display equipment and staff trained to provide information on many lines of products.  4521 Department Stores 45211 Department Stores –  primarily engaged in retailing a wide range of the following new products with no one merchandise line predominating: apparel, furniture, appliances and home furnishings; and selected additional items, such as paint, hardware, toiletries, cosmetics, photographic equipment, jewelry, toys, and sporting goods. Merchandise lines are normally arranged in separate departments.  452111 5311 Department Stores (except Discount Department Stores) –  establishments known as department stores that have separate departments for various merchandise lines, such as apparel, jewelry, home furnishings, and linens, each with separate cash registers and sales associates. Department stores in this industry generally do not have central customer checkout and cash register facilities.  452112 5311 Discount Department Stores –  This U.S. industry comprises establishments known as department stores that have central customer checkout areas, generally in the front of the store, and that may have additional cash registers located in one or more individual departments. Department stores in this industry sell a wide range of general merchandise (except fresh, perishable foods).
Industry Size http://www.census.gov/prod/ec02/ec0244i11t.pdf Total sales in the General Merchandisers Industry totaled over $444 billion Kenny Toop
Industry Profitability http://books.google.com/books?id=ueoRaHFe93QC&pg=RA1-PA169&lpg=RA1-PA169&dq=Intensity+of+comp#PRA1-PA170,M1 The General Merchandisers Industry had a median ROE of 10.5% between 1999-2002 Kenny Toop
Growth - Sales Grew 34.7% 24.1% Decrease HC Jun
Based on above profitability criteria, Wal-Mart has the highest profitability. Although the highest numbers are that for Family Dollar Store (FDO), FDO’s market cap and market share is negligible, compared to that of Wal-Mart's  Kaustubh Thakur Profitability/Efficiency WMT BJ COST TGT FDO Gross Margin 25.09% 11.04% 13.38% 32.43% 35.91% Operating Margin 5.76% 2.21% 2.73% 0.00% 5.28% Net Margin 3.35% 1.34% 1.76% 4.03% 3.41% ROE 20.81% 13.56% 14.22% 18.75% 19.50% ROIC 13.49% 13.51% 11.44% 8.75% 16.21% ROA 8.13% 6.53% 6.15% 5.87% 9.21% Inventory Turnover 10.91 11.19 13.59 8.71 6.84 Asset Turnover 2.4 4.86 3.5 1.45 2.7
http://biz.yahoo.com/p/732conameu.html   Sandro Olivieri Description 1-Day Price Chg % Market Cap P/E ROE % Div. Yield % Debt to Equity Price to Book Net Profit Margin (mrq)‏ Price To Free Cash Flow (mrq)‏ Services -1.785 1865.77B 21.794 21.829 2.457 1.139 1.685 5.437 90.157 Discount, Variety Stores -1.92 239.94B 17.3 19.6 1.938 0.73 4 3.2 -178.4 Wal-Mart Stores Inc. -1.55 184.83B 13.638 21.137 2 0.718 2.82 3.181 -57.739 Target Corp. -4.59 23.49B 9.403 17.707 2 1.494 1.73 2.441 -19.124 Costco Wholesale Corp. -3.06 19.51B 15.522 14.577 1.4 0.267 2.204 1.604 -45.665 Family Dollar Stores Inc. 0.58 3.89B 16.192 19.802 2 0.193 2.996 3.381 5457.95 Dollar Tree Inc. -1.29 3.87B 17.7 20.613 NA 0.235 3.394 3.869 -65.462 BJ's Wholesale Club Inc. -1.24 1.69B 13.078 13.155 NA 0.002 1.693 1.149 -35.14 Big Lots Inc. 0.07 1.10B 6.834 21.486 0 0.384 1.559 1.199 -8.05 99 Cents Only Stores -1.87 586.12M NA -1.125 NA 0.015 1.137 -2.962 -45.55 PriceSmart Inc. -1.69 482.42M 11.272 15.756 1.9 0.105 1.7 3.523 -32.877 Fred's Inc. 0.59 410.12M 41.04 2.621 0.8 0.013 1.063 1.457 -188.398 Tuesday Morning Corp. -4.84 48.93M 40.69 0.507 0 0.008 0.202 4.662 1.232 Duckwall-ALCO Stores Inc. 0 32.77M NA -2.277 NA 0.568 0.319 -1.442 -1.424 Maui General Store Inc. 12.5 4.07M 3.214 14.776 NA NA NA NA NA
HHI is the square of the market share of each firm competing in the market and summing the resulting number. (Range: 0-10,000)‏ KT Company Market Share (Market Share)^2 Big Lots Inc. 0.42% 0.1805 Wal-Mart Stores Inc. 72.51% 5257.9812 Target Corp. 9.51% 90.4332 Costco Wholesale Corp. 7.77% 60.3959 99 Cents Only Stores 2.31% 5.3229 PriceSmart Inc. 1.90% 3.5924 Fred's Inc. 1.57% 2.4801 Dollar Tree Inc. 1.51% 2.2926 Family Dollar Stores Inc. 1.49% 2.2229 BJ's Wholesale Club Inc. 0.66% 0.4363 Tuesday Morning Corp. 0.20% 0.0394 Duckwall-ALCO Stores Inc. 0.13% 0.0160 Maui General Store Inc. 0.01% 0.0002 Total 100.00% HHI = 5425.3937
Herfindahl Hirschman index HC Jun   2008 revenue (Mil$)‏ Percent Percent^2 1 Wal-Mart   378,799.0  62.96% 3963.962 2 Target   63,367.0  10.53% 110.8809 3 Sears    50,703.0  8.43% 71.0649 4 Macy's   26,340.0  4.38% 19.1844 5 J.C. Penney 19,860.0  3.30% 10.89 6 Kohl's   16,473.7  2.74% 7.5076 7 Dollar General 9,495.2  1.58% 2.4964 8 Nordstrom 8,828.0  1.47% 2.1609 9 Dillard's   7,370.8  1.23% 1.5129 10 Family Dollar Stores 6,834.3  1.14% 1.2996 11 Belk   3,824.8  0.64% 0.4096 12 Bon-Ton Stores 3,467.7  0.58% 0.3364 13 Saks   3,282.6  0.55% 0.3025 14 Retail Ventures 3,044.6  0.51% 0.2601 Total   601,690.7  100.00% 4,192.3

Weitere ähnliche Inhalte

Was ist angesagt?

Palm - Great Product, Bad Strategy
Palm - Great Product, Bad StrategyPalm - Great Product, Bad Strategy
Palm - Great Product, Bad Strategymimikux
 
Loreal in China: Strategies for the Yue Sai Brand
Loreal in China: Strategies for the Yue Sai BrandLoreal in China: Strategies for the Yue Sai Brand
Loreal in China: Strategies for the Yue Sai BrandAnkit Sen
 
Top 10 marketing campaign by apple
Top 10 marketing campaign by appleTop 10 marketing campaign by apple
Top 10 marketing campaign by appleRonak Modi
 
Case amazon
Case amazonCase amazon
Case amazonTHAO BUI
 
Amazon Case Study 2021
Amazon Case Study 2021Amazon Case Study 2021
Amazon Case Study 2021DevAdnani
 
Case Analysis - HubSpot: Inbound Marketing and Web 2.0
Case Analysis - HubSpot: Inbound Marketing and Web 2.0 Case Analysis - HubSpot: Inbound Marketing and Web 2.0
Case Analysis - HubSpot: Inbound Marketing and Web 2.0 Saptarshi Dhar
 
Walmart- Innovations case study
Walmart- Innovations case studyWalmart- Innovations case study
Walmart- Innovations case studylekshmik
 
Strategic mgt of Ebay
Strategic mgt of EbayStrategic mgt of Ebay
Strategic mgt of Ebayfarah naz
 
Loblaw case
Loblaw caseLoblaw case
Loblaw casee1000sn
 
Walmart – Competing In The Global Market
Walmart – Competing In The Global MarketWalmart – Competing In The Global Market
Walmart – Competing In The Global Marketanshul408
 
Case study analysis of Alibaba.com
Case study analysis of Alibaba.com Case study analysis of Alibaba.com
Case study analysis of Alibaba.com VIVEK ANAND
 

Was ist angesagt? (20)

Alibaba group
Alibaba groupAlibaba group
Alibaba group
 
Presentation on Walmart
Presentation on WalmartPresentation on Walmart
Presentation on Walmart
 
Palm - Great Product, Bad Strategy
Palm - Great Product, Bad StrategyPalm - Great Product, Bad Strategy
Palm - Great Product, Bad Strategy
 
Walmart
WalmartWalmart
Walmart
 
Loreal in China: Strategies for the Yue Sai Brand
Loreal in China: Strategies for the Yue Sai BrandLoreal in China: Strategies for the Yue Sai Brand
Loreal in China: Strategies for the Yue Sai Brand
 
Walmart ppt
Walmart pptWalmart ppt
Walmart ppt
 
Case analysis walmart case group i
Case analysis walmart case group iCase analysis walmart case group i
Case analysis walmart case group i
 
Top 10 marketing campaign by apple
Top 10 marketing campaign by appleTop 10 marketing campaign by apple
Top 10 marketing campaign by apple
 
Flipkart analysis
Flipkart analysis Flipkart analysis
Flipkart analysis
 
Case amazon
Case amazonCase amazon
Case amazon
 
Amazon Case Study 2021
Amazon Case Study 2021Amazon Case Study 2021
Amazon Case Study 2021
 
Case Analysis - HubSpot: Inbound Marketing and Web 2.0
Case Analysis - HubSpot: Inbound Marketing and Web 2.0 Case Analysis - HubSpot: Inbound Marketing and Web 2.0
Case Analysis - HubSpot: Inbound Marketing and Web 2.0
 
Ebay
EbayEbay
Ebay
 
Walmart- Innovations case study
Walmart- Innovations case studyWalmart- Innovations case study
Walmart- Innovations case study
 
Strategic mgt of Ebay
Strategic mgt of EbayStrategic mgt of Ebay
Strategic mgt of Ebay
 
Amazon Business Model
Amazon Business ModelAmazon Business Model
Amazon Business Model
 
Loblaw case
Loblaw caseLoblaw case
Loblaw case
 
Walmart – Competing In The Global Market
Walmart – Competing In The Global MarketWalmart – Competing In The Global Market
Walmart – Competing In The Global Market
 
Amazon business model
Amazon business modelAmazon business model
Amazon business model
 
Case study analysis of Alibaba.com
Case study analysis of Alibaba.com Case study analysis of Alibaba.com
Case study analysis of Alibaba.com
 

Andere mochten auch

Andere mochten auch (10)

Industry Structure - Walmart/CRS
Industry Structure - Walmart/CRSIndustry Structure - Walmart/CRS
Industry Structure - Walmart/CRS
 
Analysis of market structure
Analysis of market structureAnalysis of market structure
Analysis of market structure
 
Hp Bp
Hp BpHp Bp
Hp Bp
 
Organization Study at HP
Organization Study at HPOrganization Study at HP
Organization Study at HP
 
Organizational culture at hp
Organizational culture at hpOrganizational culture at hp
Organizational culture at hp
 
Walmart and RFID
Walmart and RFIDWalmart and RFID
Walmart and RFID
 
5 industry structure and competition analysis
5  industry structure and competition analysis5  industry structure and competition analysis
5 industry structure and competition analysis
 
Nestle
NestleNestle
Nestle
 
companies structure
companies structurecompanies structure
companies structure
 
Organizational structure ppt
Organizational structure pptOrganizational structure ppt
Organizational structure ppt
 

Ähnlich wie Walmart Case Analysis..Industry Analysis

Industry Analysis
Industry AnalysisIndustry Analysis
Industry Analysissamirmohan
 
Module 3 Retail market entry strategy in china
Module 3 Retail market entry strategy in chinaModule 3 Retail market entry strategy in china
Module 3 Retail market entry strategy in chinaIRETChina
 
FY15 Marketing Strat SOLAL final
FY15 Marketing Strat SOLAL finalFY15 Marketing Strat SOLAL final
FY15 Marketing Strat SOLAL finalGraham Boden
 
Financial statement or ratio analysis
Financial statement  or ratio  analysisFinancial statement  or ratio  analysis
Financial statement or ratio analysisAmeenababs
 
Canada country presentation_presentation
Canada country presentation_presentationCanada country presentation_presentation
Canada country presentation_presentationTeresa Maroto Ramos
 
Final presentation
Final presentationFinal presentation
Final presentationZe Shao
 
Tom weldin llc_retail_opportunities
Tom weldin llc_retail_opportunitiesTom weldin llc_retail_opportunities
Tom weldin llc_retail_opportunitiesTomWeldin
 
Wal mart strategic audit-- final edit
Wal mart strategic audit-- final editWal mart strategic audit-- final edit
Wal mart strategic audit-- final editCarolyn Bianco
 
Industry Analysis
Industry AnalysisIndustry Analysis
Industry Analysissamirmohan
 
CAPSIM- Baldwin Sensor Presentation - 1
CAPSIM- Baldwin Sensor Presentation - 1CAPSIM- Baldwin Sensor Presentation - 1
CAPSIM- Baldwin Sensor Presentation - 1Felicia Fort, MBA
 
The Proaction Group 9 box Workshop
The Proaction Group 9 box WorkshopThe Proaction Group 9 box Workshop
The Proaction Group 9 box WorkshopThe Proaction Group
 
Company Presentation Starubucks Fin4414
Company Presentation Starubucks Fin4414Company Presentation Starubucks Fin4414
Company Presentation Starubucks Fin4414adrianai
 
Mass merchant review round 1
Mass merchant review round 1Mass merchant review round 1
Mass merchant review round 1thomas paulson
 
Strategic management mba final project dec 2021
Strategic management     mba final project dec 2021Strategic management     mba final project dec 2021
Strategic management mba final project dec 2021RaMyMoHamed77
 

Ähnlich wie Walmart Case Analysis..Industry Analysis (20)

Industry Analysis
Industry AnalysisIndustry Analysis
Industry Analysis
 
Module 3 Retail market entry strategy in china
Module 3 Retail market entry strategy in chinaModule 3 Retail market entry strategy in china
Module 3 Retail market entry strategy in china
 
Walmart swot analysis 2021
Walmart swot analysis 2021Walmart swot analysis 2021
Walmart swot analysis 2021
 
Walmart
WalmartWalmart
Walmart
 
FY15 Marketing Strat SOLAL final
FY15 Marketing Strat SOLAL finalFY15 Marketing Strat SOLAL final
FY15 Marketing Strat SOLAL final
 
Financial statement or ratio analysis
Financial statement  or ratio  analysisFinancial statement  or ratio  analysis
Financial statement or ratio analysis
 
Canada country presentation_presentation
Canada country presentation_presentationCanada country presentation_presentation
Canada country presentation_presentation
 
Final presentation
Final presentationFinal presentation
Final presentation
 
Tom weldin llc_retail_opportunities
Tom weldin llc_retail_opportunitiesTom weldin llc_retail_opportunities
Tom weldin llc_retail_opportunities
 
Off-price q2 20
Off-price q2 20Off-price q2 20
Off-price q2 20
 
Wal mart strategic audit-- final edit
Wal mart strategic audit-- final editWal mart strategic audit-- final edit
Wal mart strategic audit-- final edit
 
Industry Analysis
Industry AnalysisIndustry Analysis
Industry Analysis
 
CAPSIM- Baldwin Sensor Presentation - 1
CAPSIM- Baldwin Sensor Presentation - 1CAPSIM- Baldwin Sensor Presentation - 1
CAPSIM- Baldwin Sensor Presentation - 1
 
Walmart SWOT Analysis 2018
Walmart SWOT Analysis 2018Walmart SWOT Analysis 2018
Walmart SWOT Analysis 2018
 
Apresentação 4Q09 EN
Apresentação 4Q09 ENApresentação 4Q09 EN
Apresentação 4Q09 EN
 
The Proaction Group 9 box Workshop
The Proaction Group 9 box WorkshopThe Proaction Group 9 box Workshop
The Proaction Group 9 box Workshop
 
Company Presentation Starubucks Fin4414
Company Presentation Starubucks Fin4414Company Presentation Starubucks Fin4414
Company Presentation Starubucks Fin4414
 
Mass merchant review round 1
Mass merchant review round 1Mass merchant review round 1
Mass merchant review round 1
 
Walmart SWOT analysis 2017
Walmart SWOT analysis 2017Walmart SWOT analysis 2017
Walmart SWOT analysis 2017
 
Strategic management mba final project dec 2021
Strategic management     mba final project dec 2021Strategic management     mba final project dec 2021
Strategic management mba final project dec 2021
 

Mehr von smehro

Ww Presentation
Ww PresentationWw Presentation
Ww Presentationsmehro
 
Philips Vs Matsushita Scm
Philips Vs Matsushita ScmPhilips Vs Matsushita Scm
Philips Vs Matsushita Scmsmehro
 
3 Do Case Analysis
3 Do Case Analysis3 Do Case Analysis
3 Do Case Analysissmehro
 
3 Do Case Study
3 Do Case Study3 Do Case Study
3 Do Case Studysmehro
 
Aligning Arc And Strategy
Aligning Arc And StrategyAligning Arc And Strategy
Aligning Arc And Strategysmehro
 
Framework
FrameworkFramework
Frameworksmehro
 
Network Effects And Dsir
Network Effects And DsirNetwork Effects And Dsir
Network Effects And Dsirsmehro
 
Disposable Diaper Case
Disposable Diaper CaseDisposable Diaper Case
Disposable Diaper Casesmehro
 
Midterm
MidtermMidterm
Midtermsmehro
 
High Speed Rail
High Speed RailHigh Speed Rail
High Speed Railsmehro
 
Incumbency Advantages
Incumbency AdvantagesIncumbency Advantages
Incumbency Advantagessmehro
 
What Is Strategy Recap
What Is Strategy RecapWhat Is Strategy Recap
What Is Strategy Recapsmehro
 
Positioning Perceptual Maps1 (1)
Positioning Perceptual Maps1 (1)Positioning Perceptual Maps1 (1)
Positioning Perceptual Maps1 (1)smehro
 
Best Of Value Creating Actitivities
Best Of Value Creating ActitivitiesBest Of Value Creating Actitivities
Best Of Value Creating Actitivitiessmehro
 
Progressive Corp..Ashky
Progressive Corp..AshkyProgressive Corp..Ashky
Progressive Corp..Ashkysmehro
 
Progressive Case Study.Scm
Progressive Case Study.ScmProgressive Case Study.Scm
Progressive Case Study.Scmsmehro
 
Huge And Smart Progressive Case
Huge And Smart   Progressive CaseHuge And Smart   Progressive Case
Huge And Smart Progressive Casesmehro
 
Progressive Corporation.Sssg
Progressive Corporation.SssgProgressive Corporation.Sssg
Progressive Corporation.Sssgsmehro
 

Mehr von smehro (20)

Ww Presentation
Ww PresentationWw Presentation
Ww Presentation
 
Philips Vs Matsushita Scm
Philips Vs Matsushita ScmPhilips Vs Matsushita Scm
Philips Vs Matsushita Scm
 
3 Do Case Analysis
3 Do Case Analysis3 Do Case Analysis
3 Do Case Analysis
 
3 Do3
3 Do33 Do3
3 Do3
 
3 Do
3 Do3 Do
3 Do
 
3 Do Case Study
3 Do Case Study3 Do Case Study
3 Do Case Study
 
Aligning Arc And Strategy
Aligning Arc And StrategyAligning Arc And Strategy
Aligning Arc And Strategy
 
Framework
FrameworkFramework
Framework
 
Network Effects And Dsir
Network Effects And DsirNetwork Effects And Dsir
Network Effects And Dsir
 
Disposable Diaper Case
Disposable Diaper CaseDisposable Diaper Case
Disposable Diaper Case
 
Midterm
MidtermMidterm
Midterm
 
High Speed Rail
High Speed RailHigh Speed Rail
High Speed Rail
 
Incumbency Advantages
Incumbency AdvantagesIncumbency Advantages
Incumbency Advantages
 
What Is Strategy Recap
What Is Strategy RecapWhat Is Strategy Recap
What Is Strategy Recap
 
Positioning Perceptual Maps1 (1)
Positioning Perceptual Maps1 (1)Positioning Perceptual Maps1 (1)
Positioning Perceptual Maps1 (1)
 
Best Of Value Creating Actitivities
Best Of Value Creating ActitivitiesBest Of Value Creating Actitivities
Best Of Value Creating Actitivities
 
Progressive Corp..Ashky
Progressive Corp..AshkyProgressive Corp..Ashky
Progressive Corp..Ashky
 
Progressive Case Study.Scm
Progressive Case Study.ScmProgressive Case Study.Scm
Progressive Case Study.Scm
 
Huge And Smart Progressive Case
Huge And Smart   Progressive CaseHuge And Smart   Progressive Case
Huge And Smart Progressive Case
 
Progressive Corporation.Sssg
Progressive Corporation.SssgProgressive Corporation.Sssg
Progressive Corporation.Sssg
 

Kürzlich hochgeladen

Darshan Hiranandani [News About Next CEO].pdf
Darshan Hiranandani [News About Next CEO].pdfDarshan Hiranandani [News About Next CEO].pdf
Darshan Hiranandani [News About Next CEO].pdfShashank Mehta
 
Innovation Conference 5th March 2024.pdf
Innovation Conference 5th March 2024.pdfInnovation Conference 5th March 2024.pdf
Innovation Conference 5th March 2024.pdfrichard876048
 
Kenya Coconut Production Presentation by Dr. Lalith Perera
Kenya Coconut Production Presentation by Dr. Lalith PereraKenya Coconut Production Presentation by Dr. Lalith Perera
Kenya Coconut Production Presentation by Dr. Lalith Pereraictsugar
 
8447779800, Low rate Call girls in Dwarka mor Delhi NCR
8447779800, Low rate Call girls in Dwarka mor Delhi NCR8447779800, Low rate Call girls in Dwarka mor Delhi NCR
8447779800, Low rate Call girls in Dwarka mor Delhi NCRashishs7044
 
Buy gmail accounts.pdf Buy Old Gmail Accounts
Buy gmail accounts.pdf Buy Old Gmail AccountsBuy gmail accounts.pdf Buy Old Gmail Accounts
Buy gmail accounts.pdf Buy Old Gmail AccountsBuy Verified Accounts
 
8447779800, Low rate Call girls in New Ashok Nagar Delhi NCR
8447779800, Low rate Call girls in New Ashok Nagar Delhi NCR8447779800, Low rate Call girls in New Ashok Nagar Delhi NCR
8447779800, Low rate Call girls in New Ashok Nagar Delhi NCRashishs7044
 
Traction part 2 - EOS Model JAX Bridges.
Traction part 2 - EOS Model JAX Bridges.Traction part 2 - EOS Model JAX Bridges.
Traction part 2 - EOS Model JAX Bridges.Anamaria Contreras
 
Ten Organizational Design Models to align structure and operations to busines...
Ten Organizational Design Models to align structure and operations to busines...Ten Organizational Design Models to align structure and operations to busines...
Ten Organizational Design Models to align structure and operations to busines...Seta Wicaksana
 
Chapter 9 PPT 4th edition.pdf internal audit
Chapter 9 PPT 4th edition.pdf internal auditChapter 9 PPT 4th edition.pdf internal audit
Chapter 9 PPT 4th edition.pdf internal auditNhtLNguyn9
 
PSCC - Capability Statement Presentation
PSCC - Capability Statement PresentationPSCC - Capability Statement Presentation
PSCC - Capability Statement PresentationAnamaria Contreras
 
1911 Gold Corporate Presentation Apr 2024.pdf
1911 Gold Corporate Presentation Apr 2024.pdf1911 Gold Corporate Presentation Apr 2024.pdf
1911 Gold Corporate Presentation Apr 2024.pdfShaun Heinrichs
 
8447779800, Low rate Call girls in Uttam Nagar Delhi NCR
8447779800, Low rate Call girls in Uttam Nagar Delhi NCR8447779800, Low rate Call girls in Uttam Nagar Delhi NCR
8447779800, Low rate Call girls in Uttam Nagar Delhi NCRashishs7044
 
APRIL2024_UKRAINE_xml_0000000000000 .pdf
APRIL2024_UKRAINE_xml_0000000000000 .pdfAPRIL2024_UKRAINE_xml_0000000000000 .pdf
APRIL2024_UKRAINE_xml_0000000000000 .pdfRbc Rbcua
 
(Best) ENJOY Call Girls in Faridabad Ex | 8377087607
(Best) ENJOY Call Girls in Faridabad Ex | 8377087607(Best) ENJOY Call Girls in Faridabad Ex | 8377087607
(Best) ENJOY Call Girls in Faridabad Ex | 8377087607dollysharma2066
 
business environment micro environment macro environment.pptx
business environment micro environment macro environment.pptxbusiness environment micro environment macro environment.pptx
business environment micro environment macro environment.pptxShruti Mittal
 
Pitch Deck Teardown: Geodesic.Life's $500k Pre-seed deck
Pitch Deck Teardown: Geodesic.Life's $500k Pre-seed deckPitch Deck Teardown: Geodesic.Life's $500k Pre-seed deck
Pitch Deck Teardown: Geodesic.Life's $500k Pre-seed deckHajeJanKamps
 
Memorándum de Entendimiento (MoU) entre Codelco y SQM
Memorándum de Entendimiento (MoU) entre Codelco y SQMMemorándum de Entendimiento (MoU) entre Codelco y SQM
Memorándum de Entendimiento (MoU) entre Codelco y SQMVoces Mineras
 
TriStar Gold Corporate Presentation - April 2024
TriStar Gold Corporate Presentation - April 2024TriStar Gold Corporate Presentation - April 2024
TriStar Gold Corporate Presentation - April 2024Adnet Communications
 
Guide Complete Set of Residential Architectural Drawings PDF
Guide Complete Set of Residential Architectural Drawings PDFGuide Complete Set of Residential Architectural Drawings PDF
Guide Complete Set of Residential Architectural Drawings PDFChandresh Chudasama
 

Kürzlich hochgeladen (20)

Darshan Hiranandani [News About Next CEO].pdf
Darshan Hiranandani [News About Next CEO].pdfDarshan Hiranandani [News About Next CEO].pdf
Darshan Hiranandani [News About Next CEO].pdf
 
Innovation Conference 5th March 2024.pdf
Innovation Conference 5th March 2024.pdfInnovation Conference 5th March 2024.pdf
Innovation Conference 5th March 2024.pdf
 
Kenya Coconut Production Presentation by Dr. Lalith Perera
Kenya Coconut Production Presentation by Dr. Lalith PereraKenya Coconut Production Presentation by Dr. Lalith Perera
Kenya Coconut Production Presentation by Dr. Lalith Perera
 
8447779800, Low rate Call girls in Dwarka mor Delhi NCR
8447779800, Low rate Call girls in Dwarka mor Delhi NCR8447779800, Low rate Call girls in Dwarka mor Delhi NCR
8447779800, Low rate Call girls in Dwarka mor Delhi NCR
 
Buy gmail accounts.pdf Buy Old Gmail Accounts
Buy gmail accounts.pdf Buy Old Gmail AccountsBuy gmail accounts.pdf Buy Old Gmail Accounts
Buy gmail accounts.pdf Buy Old Gmail Accounts
 
8447779800, Low rate Call girls in New Ashok Nagar Delhi NCR
8447779800, Low rate Call girls in New Ashok Nagar Delhi NCR8447779800, Low rate Call girls in New Ashok Nagar Delhi NCR
8447779800, Low rate Call girls in New Ashok Nagar Delhi NCR
 
Traction part 2 - EOS Model JAX Bridges.
Traction part 2 - EOS Model JAX Bridges.Traction part 2 - EOS Model JAX Bridges.
Traction part 2 - EOS Model JAX Bridges.
 
Ten Organizational Design Models to align structure and operations to busines...
Ten Organizational Design Models to align structure and operations to busines...Ten Organizational Design Models to align structure and operations to busines...
Ten Organizational Design Models to align structure and operations to busines...
 
Chapter 9 PPT 4th edition.pdf internal audit
Chapter 9 PPT 4th edition.pdf internal auditChapter 9 PPT 4th edition.pdf internal audit
Chapter 9 PPT 4th edition.pdf internal audit
 
Call Us ➥9319373153▻Call Girls In North Goa
Call Us ➥9319373153▻Call Girls In North GoaCall Us ➥9319373153▻Call Girls In North Goa
Call Us ➥9319373153▻Call Girls In North Goa
 
PSCC - Capability Statement Presentation
PSCC - Capability Statement PresentationPSCC - Capability Statement Presentation
PSCC - Capability Statement Presentation
 
1911 Gold Corporate Presentation Apr 2024.pdf
1911 Gold Corporate Presentation Apr 2024.pdf1911 Gold Corporate Presentation Apr 2024.pdf
1911 Gold Corporate Presentation Apr 2024.pdf
 
8447779800, Low rate Call girls in Uttam Nagar Delhi NCR
8447779800, Low rate Call girls in Uttam Nagar Delhi NCR8447779800, Low rate Call girls in Uttam Nagar Delhi NCR
8447779800, Low rate Call girls in Uttam Nagar Delhi NCR
 
APRIL2024_UKRAINE_xml_0000000000000 .pdf
APRIL2024_UKRAINE_xml_0000000000000 .pdfAPRIL2024_UKRAINE_xml_0000000000000 .pdf
APRIL2024_UKRAINE_xml_0000000000000 .pdf
 
(Best) ENJOY Call Girls in Faridabad Ex | 8377087607
(Best) ENJOY Call Girls in Faridabad Ex | 8377087607(Best) ENJOY Call Girls in Faridabad Ex | 8377087607
(Best) ENJOY Call Girls in Faridabad Ex | 8377087607
 
business environment micro environment macro environment.pptx
business environment micro environment macro environment.pptxbusiness environment micro environment macro environment.pptx
business environment micro environment macro environment.pptx
 
Pitch Deck Teardown: Geodesic.Life's $500k Pre-seed deck
Pitch Deck Teardown: Geodesic.Life's $500k Pre-seed deckPitch Deck Teardown: Geodesic.Life's $500k Pre-seed deck
Pitch Deck Teardown: Geodesic.Life's $500k Pre-seed deck
 
Memorándum de Entendimiento (MoU) entre Codelco y SQM
Memorándum de Entendimiento (MoU) entre Codelco y SQMMemorándum de Entendimiento (MoU) entre Codelco y SQM
Memorándum de Entendimiento (MoU) entre Codelco y SQM
 
TriStar Gold Corporate Presentation - April 2024
TriStar Gold Corporate Presentation - April 2024TriStar Gold Corporate Presentation - April 2024
TriStar Gold Corporate Presentation - April 2024
 
Guide Complete Set of Residential Architectural Drawings PDF
Guide Complete Set of Residential Architectural Drawings PDFGuide Complete Set of Residential Architectural Drawings PDF
Guide Complete Set of Residential Architectural Drawings PDF
 

Walmart Case Analysis..Industry Analysis

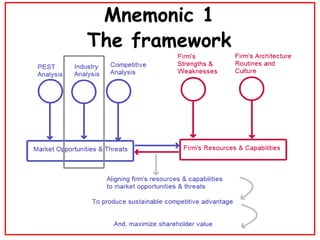
  • 1. Mnemonic 1 The framework
  • 2.
  • 3. 4521 45211 452110 4521101 4521102 4521103 452 44-45 Retail Trade General Merchandise Stores Department Stores Department Stores Department Stores Conventional Dept. Stores Discount or Mass Merchants National Chain Dept. Stores Walmart NAICS Chart Lance Kawamoto
  • 4. http://www.census.gov/epcd/naics02/naicod02.htm http://www.census.gov/epcd/naics02/N2SIC44.HTM#N452 Sandro Olivieri 2002 NAICS Code 1987 SIC Code NAICS Industry Definition 452 General Merchandise Stores – retail new general merchandise from fixed point-of-sale locations. Establishments in this subsector are unique in that they have the equipment and staff capable of retailing a large variety of goods from a single location. This includes a variety of display equipment and staff trained to provide information on many lines of products. 4521 Department Stores 45211 Department Stores – primarily engaged in retailing a wide range of the following new products with no one merchandise line predominating: apparel, furniture, appliances and home furnishings; and selected additional items, such as paint, hardware, toiletries, cosmetics, photographic equipment, jewelry, toys, and sporting goods. Merchandise lines are normally arranged in separate departments. 452111 5311 Department Stores (except Discount Department Stores) – establishments known as department stores that have separate departments for various merchandise lines, such as apparel, jewelry, home furnishings, and linens, each with separate cash registers and sales associates. Department stores in this industry generally do not have central customer checkout and cash register facilities. 452112 5311 Discount Department Stores – This U.S. industry comprises establishments known as department stores that have central customer checkout areas, generally in the front of the store, and that may have additional cash registers located in one or more individual departments. Department stores in this industry sell a wide range of general merchandise (except fresh, perishable foods).
  • 5. Industry Size http://www.census.gov/prod/ec02/ec0244i11t.pdf Total sales in the General Merchandisers Industry totaled over $444 billion Kenny Toop
  • 6. Industry Profitability http://books.google.com/books?id=ueoRaHFe93QC&pg=RA1-PA169&lpg=RA1-PA169&dq=Intensity+of+comp#PRA1-PA170,M1 The General Merchandisers Industry had a median ROE of 10.5% between 1999-2002 Kenny Toop
  • 7. Growth - Sales Grew 34.7% 24.1% Decrease HC Jun
  • 8. Based on above profitability criteria, Wal-Mart has the highest profitability. Although the highest numbers are that for Family Dollar Store (FDO), FDO’s market cap and market share is negligible, compared to that of Wal-Mart's Kaustubh Thakur Profitability/Efficiency WMT BJ COST TGT FDO Gross Margin 25.09% 11.04% 13.38% 32.43% 35.91% Operating Margin 5.76% 2.21% 2.73% 0.00% 5.28% Net Margin 3.35% 1.34% 1.76% 4.03% 3.41% ROE 20.81% 13.56% 14.22% 18.75% 19.50% ROIC 13.49% 13.51% 11.44% 8.75% 16.21% ROA 8.13% 6.53% 6.15% 5.87% 9.21% Inventory Turnover 10.91 11.19 13.59 8.71 6.84 Asset Turnover 2.4 4.86 3.5 1.45 2.7
  • 9. http://biz.yahoo.com/p/732conameu.html Sandro Olivieri Description 1-Day Price Chg % Market Cap P/E ROE % Div. Yield % Debt to Equity Price to Book Net Profit Margin (mrq)‏ Price To Free Cash Flow (mrq)‏ Services -1.785 1865.77B 21.794 21.829 2.457 1.139 1.685 5.437 90.157 Discount, Variety Stores -1.92 239.94B 17.3 19.6 1.938 0.73 4 3.2 -178.4 Wal-Mart Stores Inc. -1.55 184.83B 13.638 21.137 2 0.718 2.82 3.181 -57.739 Target Corp. -4.59 23.49B 9.403 17.707 2 1.494 1.73 2.441 -19.124 Costco Wholesale Corp. -3.06 19.51B 15.522 14.577 1.4 0.267 2.204 1.604 -45.665 Family Dollar Stores Inc. 0.58 3.89B 16.192 19.802 2 0.193 2.996 3.381 5457.95 Dollar Tree Inc. -1.29 3.87B 17.7 20.613 NA 0.235 3.394 3.869 -65.462 BJ's Wholesale Club Inc. -1.24 1.69B 13.078 13.155 NA 0.002 1.693 1.149 -35.14 Big Lots Inc. 0.07 1.10B 6.834 21.486 0 0.384 1.559 1.199 -8.05 99 Cents Only Stores -1.87 586.12M NA -1.125 NA 0.015 1.137 -2.962 -45.55 PriceSmart Inc. -1.69 482.42M 11.272 15.756 1.9 0.105 1.7 3.523 -32.877 Fred's Inc. 0.59 410.12M 41.04 2.621 0.8 0.013 1.063 1.457 -188.398 Tuesday Morning Corp. -4.84 48.93M 40.69 0.507 0 0.008 0.202 4.662 1.232 Duckwall-ALCO Stores Inc. 0 32.77M NA -2.277 NA 0.568 0.319 -1.442 -1.424 Maui General Store Inc. 12.5 4.07M 3.214 14.776 NA NA NA NA NA
  • 10. HHI is the square of the market share of each firm competing in the market and summing the resulting number. (Range: 0-10,000)‏ KT Company Market Share (Market Share)^2 Big Lots Inc. 0.42% 0.1805 Wal-Mart Stores Inc. 72.51% 5257.9812 Target Corp. 9.51% 90.4332 Costco Wholesale Corp. 7.77% 60.3959 99 Cents Only Stores 2.31% 5.3229 PriceSmart Inc. 1.90% 3.5924 Fred's Inc. 1.57% 2.4801 Dollar Tree Inc. 1.51% 2.2926 Family Dollar Stores Inc. 1.49% 2.2229 BJ's Wholesale Club Inc. 0.66% 0.4363 Tuesday Morning Corp. 0.20% 0.0394 Duckwall-ALCO Stores Inc. 0.13% 0.0160 Maui General Store Inc. 0.01% 0.0002 Total 100.00% HHI = 5425.3937
  • 11. Herfindahl Hirschman index HC Jun   2008 revenue (Mil$)‏ Percent Percent^2 1 Wal-Mart   378,799.0 62.96% 3963.962 2 Target   63,367.0 10.53% 110.8809 3 Sears   50,703.0 8.43% 71.0649 4 Macy's   26,340.0 4.38% 19.1844 5 J.C. Penney 19,860.0 3.30% 10.89 6 Kohl's   16,473.7 2.74% 7.5076 7 Dollar General 9,495.2 1.58% 2.4964 8 Nordstrom 8,828.0 1.47% 2.1609 9 Dillard's   7,370.8 1.23% 1.5129 10 Family Dollar Stores 6,834.3 1.14% 1.2996 11 Belk   3,824.8 0.64% 0.4096 12 Bon-Ton Stores 3,467.7 0.58% 0.3364 13 Saks   3,282.6 0.55% 0.3025 14 Retail Ventures 3,044.6 0.51% 0.2601 Total   601,690.7 100.00% 4,192.3