
Recommended
More Related Content
Recently uploaded
Recently uploaded (20)
Featured
Featured (20)
Smc global derivative 12-10-2011
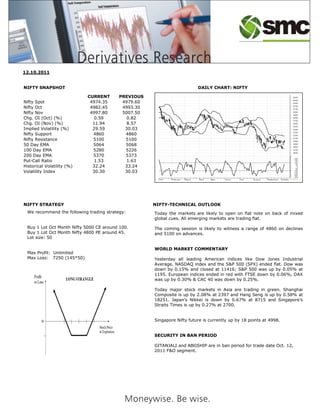
- 1. 12.10.2011 NIFTY SNAPSHOT DAILY CHART: NIFTY CURRENT PREVIOUS Nifty Spot 4974.35 4979.60 Nifty Oct 4982.45 4993.30 Nifty Nov 4997.80 5007.50 Chg. OI (Oct) (%) 0.59 0.82 Chg. OI (Nov) (%) 11.94 8.57 Implied Volatility (%) 29.59 30.03 Nifty Support 4860 4860 Nifty Resistance 5100 5100 50 Day EMA 5064 5068 100 Day EMA 5280 5226 200 Day EMA 5370 5373 Put-Call Ratio 1.53 1.63 Historical Volatility (%) 32.24 33.24 Volatility Index 30.30 30.03 NIFTY STRATEGY NIFTY-TECHNICAL OUTLOOK We recommend the following trading strategy: Today the markets are likely to open on flat note on back of mixed global cues. All emerging markets are trading flat. Buy 1 Lot Oct Month Nifty 5000 CE around 100. The coming session is likely to witness a range of 4860 on declines Buy 1 Lot Oct Month Nifty 4800 PE around 45. and 5100 on advances. Lot size: 50 WORLD MARKET COMMENTARY Max Profit: Unlimited Max Loss: 7250 (145*50) Yesterday all leading American indices like Dow Jones Industrial Average, NASDAQ index and the S&P 500 (SPX) ended flat. Dow was down by 0.15% and closed at 11416; S&P 500 was up by 0.05% at 1195. European indices ended in red with FTSE down by 0.06%, DAX was up by 0.30% & CAC 40 was down by 0.25%. Today major stock markets in Asia are trading in green. Shanghai Composite is up by 2.08% at 2397 and Hang Seng is up by 0.58% at 18251. Japan’s Nikkei is down by 0.67% at 8715 and Singapore’s Straits Times is up by 0.27% at 2700. Singapore Nifty future is currently up by 18 points at 4998. SECURITY IN BAN PERIOD GITANJALI and ABGSHIP are in ban period for trade date Oct. 12, 2011 F&O segment.
- 2. FII’S ACTIVITY IN F&O IN LAST TEN SESSIONS FII’S ACTIVITY IN F&O IN LAST TEN SESSIONS (DERIVATIVE SEGMENT) (DERIVATIVE SEGMENT) 3000 2500 2000 1500 1000 Sell 500 47.87% 0 Buy 52.13% -500 -1000 -1500 26- 27- 28- 29- 30- 03- 04- 06- 10 BASIS GAP IN NIFTY NIFTY TOTAL OPEN INTEREST 15 10 Call Put 9000000 5 8000000 0 7000000 -5 6000000 -10 5000000 -15 4000000 -20 3000000 a -25 2000000 -30 1000000 27- 28- 29- 30- 03- 04- 05- 07- 10 0 4500 4600 4700 4800 4900 5000 5100 5200 5300 NIFTY CHANGE IN OPEN INTREST FII’s are net buyers in (F&O segment) last session by INR 1317.80 crores. 1000000 Call Put Nifty Oct Futures closed at a premium of 8.1 800000 points. 600000 Maximum Call for Oct month stands at the 400000 levels of 5200. 200000 Maximum Put for Oct month stands at the 0 levels of 4800. -200000 Nifty closed down by 0.11% and open interest -400000 add by 0.59%. -600000 -800000 4500 4600 4700 4800 4900 5000 5100 5200 5300
- 3. STOCK REC0MMENDATIONS SUNPHARMA View: Bullish C.M.P: 484.40 On daily chart the stock closed above its 20- DMA. It closed with a bullish candle and increase in volume; momentum oscillators are neutral to positive. We recommend to: Buy Oct. Fut. Above: 486.00 Stop Loss: 481.00 Target: 496.00 Lot size: 500 HEROMOTOCO View: Bullish C.M.P: 1978.80 On daily chart the stock has taken support around 1900 levels. It closed with a bullish candle; momentum oscillators are neutral to positive. We recommend to: Buy Oct. Fut. Around: 2000.00 Stop Loss: 1980.00 Target: 2040.00 Lot size: 1000 BHUSANSTL View: Bearish C.M.P: 327.00 On daily chart the stock is showing weakness against the market, it has closed below its 20- DMA. Momentum oscillators are neutral to negative. We recommend to: Sell Oct. Fut. Below: 326.00 Stop Loss: 329.00 Target: 320.00 Lot size: 500
- 4. For Any Query or Suggestions email at researchfeedback@smcindiaonline.com Analyst Asmita Satyendra asmitasatyendra@smcindiaonline.com Disclaimer : This report is for the personal information of the authorized recipient and doesn’t construe to be any investment, legal or taxation advice to you. It is only for private circulation and use .The report is based upon information that we consider reliable, but we do not represent that it is accurate or complete, and it should not be relied upon as such. No action is solicited on the basis of the contents of the report. The report should not be reproduced or redistributed to any other person(s)in any form without prior written permission of the SMC. The contents of this material are general and are neither comprehensive nor inclusive. Neither SMC nor any of its affiliates, associates, representatives, directors or employees shall be responsible for any loss or damage that may arise to any person due to any action taken on the basis of this report. It does not constitute personal recommendations or take into account the particular investment objectives, financial situations or needs of an individual client or a corporate/s or any entity/s. All investments involve risk and past performance doesn’t guarantee future results. The value of, and income from investments may vary because of the changes in the macro and micro factors given at a certain period of time. The person should use his/her own judgment while taking investment decisions. Please note that we and our affiliates, officers, directors, and employees, including persons involved in the preparation or issuance if this material;(a) from time to time, may have long or short positions in, and buy or sell the securities thereof, of company (ies) mentioned here in or (b) be engaged in any other transaction involving such securities and earn brokerage or other compensation or act as a market maker in the financial instruments of the company (ies) discussed herein or may perform or seek to perform investment banking services for such company(ies) or act as advisor or lender/borrower to such company(ies) or (c) may have any other potential conflict of interest with respect to any recommendation and related information and opinions. All disputes shall be subject to the exclusive jurisdiction of Delhi High court.