1. Sound investing takes more than returns
into account
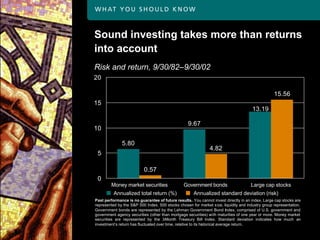
Risk and return, 9/30/82–9/30/02
20
15.56
15
13.19
9.67
10
5.80
4.82
5
0.57
0
Money market securities Government bonds Large cap stocks
Annualized total return (%) Annualized standard deviation (risk)
Past performance is no guarantee of future results. You cannot invest directly in an index. Large cap stocks are
represented by the S&P 500 Index, 500 stocks chosen for market size, liquidity and industry group representation.
Government bonds are represented by the Lehman Government Bond Index, comprised of U.S. government and
government agency securities (other than mortgage securities) with maturities of one year or more. Money market
securities are represented by the 3 -Month Treasury Bill Index. Standard deviation indicates how much an
investment’s return has fluctuated over time, relative to its historical average return.
2. A targeted blend captures higher
risk-adjusted returns
High
Same risk,
more return
Efficient
frontier
Expected return
Same return,
less risk
Inefficient (less return,
portfolio more risk)
Low
Risk
Low High
3. Sophisticated strategies incorporate
classes and subclasses
The basics
Stocks: 60%
Bonds: 30%
Cash: 10%
The next level
Large cap U.S. stocks: 30% Investment-grade
corporate bonds: 10%
Small cap U.S. stocks: 10%
High yield bonds: 5%
International stocks: 20%
Cash: 10%
Government bonds: 15%
Asset allocations are for illustrative purposes only and do not constitute a recommendation.
4. Asset allocation has provided protection
in volatile markets
12/31/72–12/31/74
30%
20%
10%
1.22%
0%
-10%
-11.99%
-20%
-20.80%
-30%
Large cap stocks Bonds 60% stocks/40% bonds
5. Know your goals
Goal Ideal time to start investing Key considerations
Retirement When you get your first job • Years until retirement
• Company plans
• Desired lifestyle
in retirement
College When each child is born • Age of child(ren)
education • Public or private college
• Current savings
• Grandparent contributions
New house As soon as you decide you • Size of mortgage
may want to be an owner • Time horizon
Rainy-day When you have some • Potential level of need
fund savings accumulated • Other financial
commitments
Build a legacy As your career progresses • Tax implications
for your heirs • Time horizon
• Number of heirs
6. Make it work
Asset allocation #1: Aggressive
1982–2001
Number of down years 3
Average loss in down years -4.51%
Worst 1-year loss -7.80%
Average annual total return 14.50%
Stocks: 80% Bonds: 20%
7. Make it work
Asset allocation #2: Moderate
1982–2001
Number of down years 2
Average loss in down years -1.04%
Worst 1-year loss -2.06%
Average annual total return 12.79%
Stocks: 50% Bonds: 40% Cash: 10%
8. Make it work
Asset allocation #3: Conservative
1982–2001
Number of down years 0
Average loss in down years N/A
Worst 1-year loss N/A
Average annual total return 10.98%
Stocks: 30% Bonds: 40% Cash: 30%
9. How rebalancing works — an example
Initial allocation: 12/31/99 Ending allocation: 12/31/02
Large cap stocks 35% Large cap stocks 26%
Small cap stocks 25% Small cap stocks 24%
International stocks 15% International stocks 10%
Bonds 25% Bonds 40%