
Empfohlen
Weitere ähnliche Inhalte
Was ist angesagt?
Ähnlich wie Employee table
Ähnlich wie Employee table (20)
Employee table
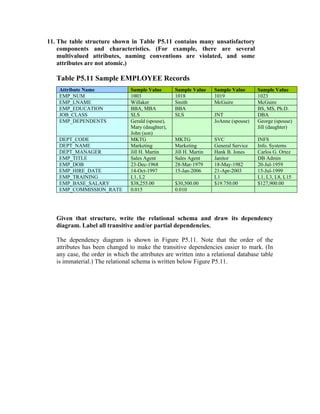
- 1. 11. The table structure shown in Table P5.11 contains many unsatisfactory components and characteristics. (For example, there are several multivalued attributes, naming conventions are violated, and some attributes are not atomic.) Table P5.11 Sample EMPLOYEE Records Attribute Name Sample Value Sample Value Sample Value Sample Value EMP_NUM 1003 1018 1019 1023 EMP_LNAME Willaker Smith McGuire McGuire EMP_EDUCATION BBA, MBA BBA BS, MS, Ph.D. JOB_CLASS SLS SLS JNT DBA EMP_DEPENDENTS Gerald (spouse), JoAnne (spouse) George (spouse) Mary (daughter), Jill (daughter) John (son) DEPT_CODE MKTG MKTG SVC INFS DEPT_NAME Marketing Marketing General Service Info. Systems DEPT_MANAGER Jill H. Martin Jill H. Martin Hank B. Jones Carlos G. Ortez EMP_TITLE Sales Agent Sales Agent Janitor DB Admin EMP_DOB 23-Dec-1968 28-Mar-1979 18-May-1982 20-Jul-1959 EMP_HIRE_DATE 14-Oct-1997 15-Jan-2006 21-Apr-2003 15-Jul-1999 EMP_TRAINING L1, L2 L1 L1, L3, L8, L15 EMP_BASE_SALARY $38,255.00 $30,500.00 $19.750.00 $127,900.00 EMP_COMMISSION_RATE 0.015 0.010 Given that structure, write the relational schema and draw its dependency diagram. Label all transitive and/or partial dependencies. The dependency diagram is shown in Figure P5.11. Note that the order of the attributes has been changed to make the transitive dependencies easier to mark. (In any case, the order in which the attributes are written into a relational database table is immaterial.) The relational schema is written below Figure P5.11.
- 2. Figure P5.11 The Dependency Diagram for Problem 11 EMP_CODE EMP_LNAME EMP_EDUCATION DEPT_CODE DEPT_NAME DEPT_MANAGER Transitive Dependencies Continued…. EMP_DEPENDENTS EMP_DOB EMP_HIRE_DATE EMP_TRAINING Continued…. JOB_TITLE JOB_CLASS EMP_BASE_SALARY EMP_COMMISSION_RATE Transitive Dependencies The relational schema is written as: EMPLOYEE(EMP_CODE, EMP_LNAME, EMP_EDUCATION, JOB_CLASS, EMP_DEPENDENTS,DEPT_CODE, DEPT_NAME, DEPT_MANAGER, EMP_TITLE, EMP_DOB, EMP_HIRE_DATE, EMP_TRAINING, EMP_BASE_SALARY, EMP_COMMISSION_RATE) 12. Break up the dependency diagram you drew in Problem 11 to produce dependency diagrams that are in 3NF. (Hint: You might have to create a few new attributes. Also make sure that the new dependency diagrams contain attributes that meet proper design criteria; that is, make sure there are no multivalued attributes, that the naming conventions are met, and so on.) Dependency diagrams have no way to indicate multi-valued attributes, nor do they provide the means through which such attributes can be handled. Therefore, the solution to this problem requires a basic knowledge of modeling concepts, once again indicating that normalization and design are part of the same process. Given the sample data shown in Problem 11, EDUCATION, DEPENDENT and QUALIFICATION are multi-valued attributes whose values are stored as strings. We have created the appropriate entities to avoid the use of multi-valued attributes. (See Figure P5.12.)
- 3. Figure P5.12 The Dependency Diagrams for Problem 12 EMPLOYEE EMP_CODE EMP_LNAME DEPT_CODE JOB_CLASS EMP_DOB EMP_HIRE_DATE DEPARTMENT DEPT_CODE DEPT_NAME EMP_CODE QUALIFICATION EDUCATION EMP_CODE EDUC_CODE QUAL_DATE EDUC_CODE EDUC_DESCRIPTION DEPENDENT EMP_CODE DEP_NUM DEP_FNAME DEP_TYPE JOB JOB_CLASS JOB_TITLE JOB_BASE_SALARY As you discuss Figure P5.12, note that a real world design would have to include additional entities or additional attributes in the existing entities. For example, while the job description is likely to include a (job) base salary, employee experience – perhaps measured by time in the job classification and performance – is likely to add to the job’s base salary. Therefore, the EMPLOYEE table might include a salary or hourly wage adjustment attribute. Overall employment longevity is likely to be included, too … employers often find it useful to keep (expensive) job turnover rates low. And, of course, you might include year-to-date (YTD) earnings and taxes in each employee’s records, too. This problem is a great source of discussion material! The relational schemas are written as: EMPLOYEE(EMP_CODE, EMP_LNAME, DEPT_CODE, JOB_CLASS, EMP_DOB, EMP_HIREDATE) DEPENDENT(EMP_CODE, DEP_NUM, DEP_FNAME, DEP_TYPE) DEPARTMENT(DEPT_CODE, DEPT_NAME, EMP_CODE)
- 4. JOB(JOB_CLASS, JOB_TITLE, JOB_BASE_SALARY) EDUCATION(EDUC_CODE, EDUC_DESCRIPTION) QUALIFICATION(EMP_CODE, EDUC_CODE, QUAL_DATE_EARNED) 13. Using the results of problem 12, draw the relational diagram. The relational diagram is shown in Figure P5.13. Figure P5.13 The Relational Diagram for Problem 13 DEPARTMENT DEPT_CODE _CODE 1 EMPLOYEE 1 QUALIFICATION DEPT_NAME 1 EMP_CODE EMP_CODE EDUCATION EMP_CODE 1 M 1 1 EMP_LNAME EDUC_CODE EDUC_CODE M DEPENDENT DEPT_CODE QUAL_DATE_EARNED EDUC_DESCRIPTION EMP_CODE M JOB_CLASS M JOB DEPT_NUM EMP_HIRE_DATE JOB_CLASS 1 DEPT_FNAME M DEPT_CODE JOB_TITLE DEPT_TYPE JOB_BASE_SALARY
- 5. 14. Using the results of Problem 13, draw the Crow’s Foot ERD. The Crow’s Foot solution is shown in Figure P5.14. Figure P5.14 The Crow’s Foot ERD for Problem 14