SlideShare ist ein Scribd-Unternehmen logo
1 von 34
Downloaden Sie, um offline zu lesen
Module II – Physical Layer
1. Overview of Data
Data refers to information that conveys some meaning based on some mutually agreed up rules
or conventions between a sender and a receiver and today it comes in a variety of forms such as
text, graphics, audio, video and animation.
Data must be transformed to electromagnetic signals and the major job of the physical
layer lies with the moving of data in the form of electromagnetic signal across the
transmission media.
Data can be of two types; analog and digital. Analog data take on continuous values on some
interval. Typical examples of analog data are voice and video. The data that are collected from
the real world with the help of transducers are continuous-valued or analog in nature. On the
contrary, digital data take on discrete values. Text or character strings can be considered as
examples of digital data. Characters are represented by suitable codes, e.g. ASCII code, where
each character is represented by 8-bit code. Fig. 1.1 shows how data is represented as signal and
transmitted over the communication medium.
2. Signal
It is electrical, electronic or optical representation of data, which can be sent over a
communication medium. Stated in mathematical terms, a signal is merely a function of the data.
For example, a microphone converts voice data into voice signal, which can be sent over a pair
of wire. Analog signals are continuous-valued; digital signals are discrete-valued. The
independent variable of the signal could be time (speech, for example), space (images), or the
integers (denoting the sequencing of letters and numbers in the football score).
2.1 Analog Signal
Analog data are continuous and take continuous values. Analog signals can have an infinite
number of values in a range. Figure 2.1.1 shows an analog signal.
Fig. 2.1.1
In data communication, we commonly use periodic analog signals. Periodic signals completes
a pattern within a measurable time frame, called a period, and repeat the pattern over subsequent
identical periods. The completion of full period is called a cycle.
Periodic analog signals can be classified as simple or composite. A simple periodic analog
signal, a sine wave, cannot be decomposed into simpler signals.
Fig. 2.1.2 shows the simple analog signal where S is the instantaneous amplitude, A is the peak
amplitude, f is frequency, and Ø is the phase. A sine wave cannot be decomposed into simpler
signal. Peak amplitude is the absolute value of its highest intensity proportional to the energy it
carries. Like electrical signal peak amplitude is measured in volts.
Fig. 2.1.2 Simple sine wave analog signal
A composite periodic analog signal is composed of multiple sine waves. any composite signal
can be represented as a combination of simple sine waves with different frequencies, phases and
amplitudes.
Periodic composite signal (period=T, freq. = f0=1/T) can be represented as a sum of simple sines
and/or cosines known as Fourier series:
Fig2.1.3 shows the Composite analog signal.
Fig. 2.3 Composite analog signal
2.2 Frequency and period
Period refers to the amount of time, in second, a signal needs to complete one cycle
Frequency refers to the number of periods in one second. Frequency and period are the inverse
of each other.
Frequency is the rate of change with respect to time. Change in a short span of time means high
frequency. Change over a long span of time means low frequency. If a signal does not change at
all, its frequency is zero. If a signal changes instantaneously, its frequency is infinite.
Fig. 2.2.1 shows the relationship of period and frequency
Fig. 2.2.1 Two signals with the same amplitude and phase, but different frequencies
Q1.The period of a signal is 100 ms. What is its frequency in kilohertz?
Solution
First we change 100 ms to seconds, and then we calculate the frequency from the period (1 Hz =
10−3
kHz).
2.3 Phase
Phase describes the position of the waveform relative to time 0. Fig. 2.3.1 shows the three sine
waves with the same amplitude and frequency, but different phases.
Fig. 2.3.1
2.4 Wavelength
Wavelength is the distance between identical points in the adjacent cycles of a waveform signal
propagated in space or along a wire, as shown in the Fig. 2.4.1. In wireless systems, this length is
usually specified in meters, centimeters, or millimeters. In the case of infrared, visible light,
ultraviolet, and gamma radiation, the wavelength is more often specified in nanometers (units of
10-9
meter) or Angstrom units (units of 10-10
meter).
Wavelength is inversely related to frequency. The higher the frequency of the signal, the shorter
the wavelength. If f is the frequency of the signal as measured in megahertz, and w is the
wavelength as measured in meters, then
w = 300/f
And conversely
f = 300/w
Fig. 2.4.1
2.5 Frequency domain concepts
The time domain representation displays a signal using time-domain plot, which shows changes
in signal amplitude with time. The time-domain plot can be visualized with the help of an
oscilloscope. The relationship between amplitude and frequency is provided by frequency
domain representation, which can be displayed with the help of spectrum analyser. Time domain
and frequency domain representations of three sine waves of three different frequencies are
shown in Fig. 2.5.1.
Fig. 2.5.1 The time domain and frequency domain of three sine waves
Composite signals made of many simple sine waves find use in data communication. Any
composite signal can be represented by a combination of simple sine waves using Fourier
Analysis. For example, the signal shown in Fig. 2.5.2(c) is a composition of two sine waves
having frequencies f1, 3f1, shown in Fig. 2.5.2 (a) and (b), respectively and it can be represented
by
s (t) = sin ωt + 1/3 sin 3ωt , where ω = 2πf1.
The frequency domain function s(f) specifies the constituent frequencies of the signal. The range
of frequencies that a signal contains is known as it spectrum, which can be visualized with the
help of a spectrum analyser. The band of frequencies over which most of the energy of a signal is
concentrated is known as the bandwidth of the signal.
Fig. 2.5.2 Time and frequency domain representations of a composite signal
If the composite signal is periodic, the decomposition gives a series of signals with discrete
frequencies; if the composite signal is nonperiodic, the decomposition gives a combination of
sine waves with continuous frequencies.
2.6 Frequency Spectrum
Frequency spectrum of a signal is the range of frequencies that a signal contains.
The frequency spectrum of this signal can be approximation comprising only the first and third
harmonics as shown in Fig. 2.6.1.
Fig. 2.6.1
2.7 Bandwidth
The bandwidth of a composite signal is the difference between the highest and the lowest
frequencies contained in that signal (Fig. 2.7.1).
Fig. 2.7.1 Frequency spectrum and bandwidth of a signal
Q2. If a periodic signal is decomposed into five sine waves with frequencies of 100, 300, 500,
700, and 900 Hz, what is its bandwidth? Draw the spectrum, assuming all components have
maximum amplitude of 10 V.
Solution
Let fh
be the highest frequency, fl
the lowest frequency, and B the bandwidth.
The spectrum has only five spikes, at 100, 300, 500, 700, and 900 Hz (see Figure 2.7.2)
Fig. 2.7.2
Q3. A nonperiodic composite signal has a bandwidth of 200 kHz, with a middle frequency of
140 kHz and peak amplitude of 20 V. The two extreme frequencies have amplitude of 0. Draw
the frequency domain of the signal.
Solution
The lowest frequency must be at 40 kHz and the highest at 240 kHz. Figure 3.15 shows the
frequency domain and the bandwidth.
2.8 DIGITAL SIGNALS
For example, a 1 can be encoded as a positive voltage and a 0 as zero voltage. A digital signal
can have more than two levels. In this case, we can send more than 1 bit for each level. Two
digital signals: one with two signal levels and the other with four signal levels shown in Fig2.8
Fig2.8
Q4.A digital signal has eight levels. How many bits are needed per level?
Solution
We calculate the number of bits from the formula
Each signal level is represented by 3 bits.
Most digital signals are aperiodic and thus, period or frequency is not appropriate. Two new
terms, bit interval (instead of period) and bit rate (instead of frequency) are used to describe
digital signals. The bit interval is the time required to send one single bit. The bit rate is the
number of bit interval per second. This mean that the bit rate is the number of bits send in one
second, usually expressed in bits per second (bps) as shown in Fig. 2.8.1.
Fig.2.8.1
A digital signal can be considered as a signal with an infinite number of frequencies and
transmission of digital requires a low-pass channel as shown in Fig. 2.8.2. On the other hand,
transmission of analog signal requires band-pass channel shown in Fig. 2.8.3.
Fig. 2.8.2 Low pass channel required for transmission of digital signal
Fig. 2.8.3 Low pass channel required for transmission of analog signal
Digital transmission has several advantages over analog transmission. That is why there is a
shift towards digital transmission despite large analog base. Some of the advantages of digital
transmission are highlighted below:
Analog circuits require amplifiers, and each amplifier adds distortion and noise to the signal.
In contrast, digital amplifiers regenerate an exact signal, eliminating cumulative errors. An
incoming (analog) signal is sampled, its value is determined, and the node then generates a
new signal from the bit value; the incoming signal is discarded. With analog circuits,
intermediate nodes amplify the incoming signal, noise and all.
Voice, data, video, etc. can all by carried by digital circuits. What about carrying digital
signals over analog circuit? The modem example shows the difficulties in carrying digital
over analog. A simple encoding method is to use constant voltage levels for a “1'' and a ``0''.
Can lead to long periods where the voltage does not change.
Easier to multiplex large channel capacities with digital.
Easy to apply encryption to digital data.
Better integration if all signals are in one form. Can integrate voice, video and digital data.
2.9Baseband channel
A baseband channel or lowpass channel (or system, or network) is a communication channel that
can transfer frequencies that are very near zero. Examples are serial cables and local area
networks (LANs), as opposed to bandpass channels such as radio frequency channels and
bandpass filtered wires of the analog telephone network. Frequency division multiplexing (FDM)
allows an analog telephone wire to carry a baseband telephone call, concurrently as one or
several carrier-modulated telephone calls.
Baseband transmission of a digital signal that preserves the shape of the digital signal is possible
only if we have a low-pass channel with an infinite or very wide bandwidth.
If the available channel is a bandpass channel, we cannot send the digital signal directly to the
channel; we need to convert the digital signal to an analog signal before transmission.
Compare Baseband and Broadband Signals
Depending on some type of typical signal formats or modulation schemes, a few terminologies
evolved to classify different types of signals. So, we can have either a base band or broadband
signalling. Base-band is defined as one that uses digital signalling, which is inserted in the
transmission channel as voltage pulses. On the other hand, broadband systems are those, which
use analog signalling to transmit information using a carrier of high frequency.
In baseband LANs, the entire frequency spectrum of the medium is utilized for transmission and
hence the frequency division multiplexing (discussed later) cannot be used. Signals inserted at a
point propagates in both the directions, hence transmission is bi-directional. Baseband systems
extend only to limited distances because at higher frequency, the attenuation of the signal is most
pronounced and the pulses blur out, causing the large distance communication totally
impractical. In baseband transmission, the required bandwidth is proportional to the bit rate; if
we need to send bits faster, we need more bandwidth.
Since broadband systems use analog signalling, frequency division multiplexing is possible,
where the frequency spectrum of the cable is divided into several sections of bandwidth. These
separate channels can support different types of signals of various frequency ranges to travel at
the same instance. Unlike base-band, broadband is a unidirectional medium where the signal
inserted into the media propagates in only one direction. Two data paths are required, which are
connected at a point in the network called headend. All the stations transmit towards the headend
on one path and the signals received at the headend are propagated through the second path.
3. Transmission media
Transmission media can be defined as physical path between transmitter and receiver in a data
transmission system. And it may be classified into two types as shown in Fig. 3.1
Guided: Transmission capacity depends critically on the medium, the length, and whether
the medium is point-to-point or multipoint (e.g. LAN). Examples are co-axial cable, twisted
pair, and optical fiber. For guided media, the medium is more important in determining the
limitations of transmission.
Unguided: provides a means for transmitting electro-magnetic signals but do not guide them.
Example wireless transmission. In case of unguided media, the bandwidth of the signal
produced by the transmitting antenna and the size of the antenna is more important than the
medium. Signals at lower frequencies are omni-directional (propagate in all directions). For
higher frequencies, focusing the signals into a directional beam is possible. These properties
determine what kind of media one should use in a particular application.
Fig. 3.1 Classes of Transmission Media
3.1 Guided transmission media
Most commonly used guided transmission media are twisted-pair of cable, coaxial cable and
optical fiber.
3.1.1 Twisted Pair cable
In twisted pair technology, two copper wires are strung between two points:
The two wires are typically ``twisted'' together in a helix to reduce interference between the
two conductors as shown in Fig.3.1.1 Twisting decreases the cross-talk interference between
adjacent pairs in a cable. Typically, a number of pairs are bundled together into a cable by
wrapping them in a tough protective sheath.
Can carry both analog and digital signals. Actually, they carry only analog signals. However,
the ``analog'' signals can very closely correspond to the square waves representing bits, so we
often think of them as carrying digital data.
Data rates of several Mbps common.
Spans distances of several kilometers.
Data rate determined by wire thickness and length. In addition, shielding to eliminate
interference from other wires impacts signal-to-noise ratio, and ultimately, the data rate.
Good, low-cost communication. Indeed, many sites already have twisted pair installed in
offices -- existing phone lines!
Maximum transmission distance of 1 Km can be achieved for data rates up to 1 Mb/s. For
analog voice signals, amplifiers are required about every 6 Km and for digital signals,
repeaters are needed for about 2 Km.
To reduce interference, the twisted pair can be shielded with metallic braid. This type of wire
is known as Shielded Twisted-Pair (STP) and the other form is known as Unshielded
Twisted-Pair (UTP).
Application:
• Twisted pair cable are used for voice and data in telephone lines in local loop
• DSL line use the same kind of cable for high data rate.
• LAN like 10BaseT and 100BaseT also use UTP cable
Fig. 3.1.1 Twisted Pair cable
UTP Connector:
3.1.2 Coaxial cable
With ``coax'', the medium consists of a copper core surrounded by insulating material and a
braided outer conductor as shown in Fig. 3.1.2. The term base band indicates digital transmission
(as opposed to broadband analog).
Physical connection consists of metal pin touching the copper core. There are two common ways
to connect to a coaxial cable:
With vampire taps, a metal pin is inserted into the copper core. A special tool drills a hole
into the cable, removing a small section of the insulation, and a special connector is screwed
into the hole. The tap makes contact with the copper core.
With a T-junction, the cable is cut in half, and both halves connect to the T-junction. A T-
connector is analogous to the signal splitters used to hook up multiple TVs to the same cable
wire.
Co-axial cable has superior frequency characteristics compared to twisted-pair and can be used
for both analog and digital signaling. In baseband LAN, the data rates lies in the range of 1 KHz
to 20 MHz over a distance in the range of 1 Km. Co-axial cables typically have a diameter of
3/8". Coaxial cables are used both for baseband and broadband communication. For broadband
CATV application coaxial cable of 1/2" diameter and 75 Ω impedance is used. This cable offers
bandwidths of 300 to 400 MHz facilitating high-speed data communication with low bit-error
rate. In broadband signaling, signal propagates only in one direction, in contrast to propagation
in both directions in baseband signaling. Broadband cabling uses either dual-cable scheme or
single-cable scheme with a headend to facilitate flow of signal in one direction. Because of the
shielded, concentric construction, co-axial cable is less susceptible to interference and cross talk
than the twisted-pair. For long distance communication, repeaters are needed for every kilometer
or so. Data rate depends on physical properties of cable, but 10 Mbps is typical.
Fig. 3.1.2 Coaxial cable
Application:
Coaxial Cable could carry 10000 voice signal in analog telephone system and carry digital
data upto 600Mbps
Traditional cable TV network use the Coaxial cable
Coaxial cable can give continues high data rate. Due to this high bandwidth it can also be
used for Ethernet LAN.
3.1.3 Fiber Optics
In fiber optic technology, the medium consists of a hair-width strand of silicon or glass, and the
signal consists of pulses of light. For instance, a pulse of light means ``1'', lack of pulse means
``0''. It has a cylindrical shape and consists of three concentric sections: the core, the cladding,
and the jacket as shown in Fig. 3.1.3. The core, innermost section consists of a single solid
dielectric cylinder of diameter d1 and of refractive index n1. The core is surrounded by a solid
dielectric cladding of refractive index n2 that is less than n1. As a consequence, the light is
propagated through multiple total internal reflections. The core material is usually made of ultra
pure fused silica or glass and the cladding is either made of glass or plastic. The cladding is
surrounded by a jacket made of plastic. The jacket is used to protect against moisture, abrasion,
crushing and other environmental hazards.
Fig. 3.1.3 Optical Fiber
Optical Fiber works in three different types of modes (or we can say that we have 3 types of
communication using Optical fiber). Optical fibers are available in two varieties; Multi-Mode
Fiber (MMF) and Single-Mode Fiber (SMF). For multi-mode fiber the core and cladding
diameter lies in the range 50-200μm and 125-400μm, respectively. Where as in single-mode
fiber, the core and cladding diameters lie in the range 8-12μm and 125μm, respectively. Single-
mode fibers are also known as Mono-Mode Fiber. Moreover, both single-mode and multi-mode
fibers can have two types; step index and graded index. In the former case the refractive index of
the core is uniform throughout and at the core cladding boundary there is an abrupt change in
refractive index. In the later case, the refractive index of the core varies radially from the centre
to the core-cladding boundary from n1 to n2 in a linear manner. Fig. 3.1.4 shows the optical fiber
transmission modes.
Fig. 3.1.4 optical fiber transmission modes
Advantages:
Very high data rate, low error rate. 1000 Mbps (1 Gbps) over distances of kilometers
common. Error rates are so low they are almost negligible.
Difficult to tap, this makes it hard for unauthorized taps as well. This is responsible for
higher reliability of this medium.
Much thinner (per logical phone line) than existing copper circuits. Because of its thinness,
phone companies can replace thick copper wiring with fibers having much more capacity for
same volume. This is important because it means that aggregate phone capacity can be
upgraded without the need for finding more physical space to hire the new cables.
Not susceptible to electrical interference (lightning) or corrosion (rust).
Greater repeater distance than coax.
Disadvantages:
Difficult to tap. It really is point-to-point technology. In contrast, tapping into coax is trivial.
No special training or expensive tools or parts are required.
One-way channel. Two fibers needed to get full duplex (both ways) communication.
Fig. 3.1.5 Fiber-optic cable connectors
3.2 Unguided Transmission media
Unguided media transport electromagnetic waves without using a physical conductor. This type
of communication is often referred to as wireless communication.
There are three types of unguided media is available as per Electromagnetic spectrum for
wireless communication (Fig. 3.2.1).
Fig. 3.2.1
Unguided transmission is used when running a physical cable (either fiber or copper) between
two end points is not possible. For example, running wires between buildings is probably not
legal if the building is separated by a public street.
Radio waves are used for multicast communications, such as radio and television, cord less
phone and paging systems. For radio wave transmission omnidirectional antenna (Fig.3.2.2)
is used for long distance broadcasting.
Fig.3.2.2 omnidirectional antenna
Infrared signals typically used for short distances (across the street or within same room).
Infrared signals can be used for short-range communication in a closed area using line-of-
sight propagation (Wave lengths from 1mm to 770nm).IrDA port in Wireless key board use
infrared with 75Kbps to 4Mbps data rate.
Microwave signals commonly used for longer distances (10's of km). Sender and receiver use
some sort of dish antenna. Microwaves are used for unicast communication such as cellular
telephones, satellite networks, and wireless LANs. Microwave signals needs unidirectional
antenna (Parabolic dish antenna, Horn antenna) for line of sight communication (Fig. 3.2.3).
Fig. 3.2.3 unidirectional antenna
Propagation Method:
There are three types of propagation namely Ground propagation, sky propagation and line of
sight propagation (See Fig. 3.2.4)
Fig. 3.2.4
Difficulties of Unguided Transmission:
Weather interferes with signals. For instance, clouds, rain, lightning, etc. may adversely affect
communication.
Radio transmissions easy to tap. A big concern for companies worried about competitors stealing
plans.
Signals bouncing off of structures may lead to out-of-phase signals that the receiver must filter
out.
3.2.1 Satellite Communication
Satellite communication is based on ideas similar to those used for line-of-sight. A
communication satellite is essentially a big microwave repeater or relay station in the sky.
Microwave signals from a ground station is picked up by a transponder, amplifies the signal and
rebroadcasts it in another frequency, which can be received by ground stations at long distances
as shown in Fig. 3.2.5.
To keep the satellite stationary with respect to the ground based stations, the satellite is placed in
a geostationary orbit above the equator at an altitude of about 36,000 km. As the spacing
between two satellites on the equatorial plane should not be closer than 40, there can be 360/4 =
90 communication satellites in the sky at a time. A satellite can be used for point-to-point
communication between two ground-based stations or it can be used to broadcast a signal
received from one station to many ground-based stations as shown in Fig. 3.2.6. Number of geo-
synchronous satellites limited (about 90 total, to minimize interference). International
agreements regulate how satellites are used, and how frequencies are allocated. Weather affects
certain frequencies. Satellite transmission differs from terrestrial communication in another
important way: One-way propagation delay is roughly 270 ms. In interactive terms, propagation
delay alone inserts a 1 second delay between typing a character and receiving its echo.
Fig. 3.2.5 Fig. 3.2.6.
Use: Now-a-days communication satellites are not only used to handle telephone, telex and
television traffic over long distances, but are used to support various internet based services such
as e-mail, FTP, World Wide Web (WWW), etc. New types of services, based on communication
satellites, are emerging.
Comparison/contrast with other technologies:
1. Propagation delay very high. On LANs, for example, propagation time is in nanoseconds --
essentially negligible.
2. One of few alternatives to phone companies for long distances.
3. Uses broadcast technology over a wide area - everyone on earth could receive a message at
the same time!
4. Easy to place unauthorized taps into signal.
Satellites have recently fallen out of favor relative to fiber.
However, fiber has one big disadvantage: no one has it coming into their house or building,
whereas anyone can place an antenna on a roof and lease a satellite channel.
3.3 TRANSMISSION IMPAIRMENT
When a signal is transmitted over a communication channel, it is subjected to different types of
impairments because of imperfect characteristics of the channel. As a consequence, the received
and the transmitted signals are not the same. Outcome of the impairments are manifested in two
different ways in analog and digital signals. These impairments introduce random modifications
in analog signals leading to distortion. On the other hand, in case of digital signals, the
impairments lead to error in the bit values. The impairment can be broadly categorized into the
following three types:
Attenuation and attenuation distortion
Delay distortion
Noise
3.3.1 Attenuation
Irrespective of whether a medium is guided or unguided, the strength of a signal falls off with
distance. This is known as attenuation. In case of guided media, the attenuation is logarithmic,
whereas in case of unguided media it is a more complex function of the distance and the material
that constitutes the medium.
An important concept in the field of data communications is the use of on unit known as decibel
(dB).
Fig. 3.3.1Attenuation
Example: Let us consider a transmission line between points 1 and 2 and let the energy strength
at point 2 is 1/10 of that of point 1. Then attenuation in dB is 10log10(1/10) = -10 dB. On the
other hand, there is an amplifier between points 2 and 3. Let the power is 100 times at point 3
with respect to point 2. Then power gain in dB is 10log10(100/1) = 20 dB, which has a positive
sign.
The attenuation leads to several problems:
Attenuation Distortion: If the strength of the signal is very low, the signal cannot be detected
and interpreted properly at the receiving end. The signal strength should be sufficiently high so
that the signal can be correctly detected by a receiver in presence of noise in the channel.
Attenuation of all frequency components is not same. Some frequencies are passed without
attenuation, some are weakened and some are blocked. This dependence of attenuation of a
channel on the frequency of a signal leads to a new kind of distortion attenuation distortion.
The effect of attenuation distortion can be reduced with the help of a suitable equalizer circuit,
which is placed between the channel and the receiver.
3.3.2 Delay distortion
The velocity of propagation of different frequency components of a signal are different in guided
media. This leads to delay distortion in the signal. For a band limited signal, the velocity of
propagation has been found to be maximum near the center frequency and lower on both sides of
the edges of the frequency band. In case of analog signals, the received signal is distorted
because of variable delay of different components. In case of digital signals, the problem is much
more severe. Some frequency components of one bit position spill over to other bit positions,
because of delay distortion. This leads to inter symbol interference, which restricts the maximum
bit rate of transmission through a particular transmission medium.
Fig.3.3.2 Delay Distortion
3.3.3 Noise
As signal is transmitted through a channel, undesired signal in the form of noise gets mixed up with
the signal, along with the distortion introduced by the transmission media. Noise can be categorised
into the following four types:
Thermal Noise
Intermodulation Noise
Cross talk
Impulse Noise
The thermal noise is due to thermal agitation of electrons in a conductor. It is distributed across
the entire spectrum and that is why it is also known as white noise.
Cross talk is a result of bunching several conductors together in a single cable. Signal carrying
wires generate electromagnetic radiation, which is induced on other conductors because of close
proximity of the conductors. While using telephone, it is a common experience to hear
conversation of other people in the background. This is known as cross talk.
Impulse noise is irregular pulses or noise spikes of short duration generated by phenomena like
lightning, spark due to loose contact in electric circuits, etc. Impulse noise is a primary source of
bit-errors in digital data communication. This kind of noise introduces burst errors.
Nyquist Bit Rate
The maximum rate at which data can be correctly communicated over a channel in presence of
noise and distortion is known as its channel capacity. Consider first a noise-free channel of
Bandwidth B. Based on Nyquist formulation it is known that given a bandwidth B of a channel,
the maximum data rate that can be carried is 2B. This limitation arises due to the effect of inter
symbol interference caused by the frequency components higher than B. If the signal consists of
m discrete levels, then Nyquist theorem states:
Maximum data rate C = 2 B log2 m bits/sec,
Where C is known as the channel capacity,
B is the bandwidth of the channel and m is the number of signal levels used.
Baud Rate: The baud rate or signaling rate is defined as the number of distinct symbols
transmitted per second, irrespective of the form of encoding. For baseband digital transmission m
= 2. So, the maximum baud rate = 1/Element width (in Seconds) = 2B
Bit Rate: The bit rate or information rate I is the actual equivalent number of bits transmitted per
second. I = Baud Rate × Bits per Baud
= Baud Rate × N = Baud Rate ×log2m
For binary encoding, the bit rate and the baud rate are the same; i.e., I = Baud Rate.
Example: Let us consider the telephone channel having bandwidth B = 4 kHz. Assuming there is
no noise, determine channel capacity for the following encoding levels:
(i) 2, and (ii) 128.
Ans: (i) C = 2B = 2×4000 = 8 Kbits/s
(ii) C = 2×4000×log2 128 = 8000×7 = 56 Kbits/s
Effects of Noise
When there is noise present in the medium, the limitations of both bandwidth and noise must be
considered. A noise spike may cause a given level to be interpreted as a signal of greater level, if
it is in positive phase or a smaller level, if it is negative phase. Noise becomes more problematic
as the number of levels increases.
Shannon Capacity (Noisy Channel)
In presence of Gaussian band-limited white noise, Shannon-Hartley theorem gives the maximum
data rate capacity C = B log2 (1 + S/N),
where S and N are the signal and noise power, respectively, at the output of the channel. This
theorem gives an upper bound of the data rate which can be reliably transmitted over a thermal-
noise limited channel.
Example: We can calculate the theoretical highest bit rate of a regular telephone line. A
telephone line normally has a bandwidth of 3000. The signal-to-noise ratio is usually 3162. For
this channel the capacity is calculated as
This means that the highest bit rate for a telephone line is 34.860 kbps. If we want to send data
faster than this, we can either increase the bandwidth of the line or improve the signal-to-noise
ratio.
Example: The signal-to-noise ratio is often given in decibels. Assume that SNRdB = 36 and the
channel bandwidth is 2 MHz. The theoretical channel capacity can be calculated as
Example: We have a channel with a 1-MHz bandwidth. The SNR for this channel is 63. What
are the appropriate bit rate and signal level?
Solution
First, we use the Shannon formula to find the upper limit.
The Shannon formula gives us 6 Mbps, the upper limit. For better performance we choose
something lower, 4 Mbps, for example. Then we use the Nyquist formula to find the number of
signal levels.
4. Transmission of Digital Signal
There are two alternatives; the data can be either converted to digital or analog signal. Both the
approaches have pros and cons. What to be used depends on the situation and the available
bandwidth.
Now, either form of data can be encoded into either form of signal. For digital signalling, the
data source can be either analog or digital, which is encoded into digital signal, using different
encoding techniques.
The basis of analog signalling is a constant frequency signal known as a carrier signal, which is
chosen to be compatible with the transmission media being used, so that it can traverse a long
distance with minimum of attenuation and distortion. Data can be transmitted using these carrier
signals by a process called modulation, where one or more fundamental parameters of the carrier
wave, i.e. amplitude, frequency and phase are being modulated by the source data. The resulting
signal, called modulated signal traverses the media, which is demodulated at the receiving end
and the original signal is extracted. All the four possibilities are shown in Fig. 4.1.
Fig. 4.1 various approaches for conversion of data to signal
4.1 Line coding characteristics
The first approach converts digital data to digital signal, known as line coding, as shown in Fig. 4.1.1
Important parameters those characteristics line coding techniques are mentioned below.
Fig. 4.1.1 Line coding and decoding
No of signal levels: This refers to the number values allowed in a signal, known as signal levels, to
represent data. Figure 4.1.2 shows signal levels to represent binary data.
Bit rate versus Baud rate: The bit rate represents the number of bits sent per second, whereas the
baud rate defines the number of signal elements per second in the signal. Depending on the
encoding technique used, baud rate may be more than or less than the data rate.
DC components: After line coding, the signal may have zero frequency component in the spectrum
of the signal, which is known as the direct-current (DC) component. DC component in a signal is
not desirable because the DC component does not pass through some components of a
communication system such as a transformer. This leads to distortion of the signal and may create
error at the output. The DC component also results in unwanted energy loss on the line.
Signal Spectrum: Different encoding of data leads to different spectrum of the signal. It is necessary
to use suitable encoding technique to match with the medium so that the signal suffers minimum
attenuation and distortion as it is transmitted through a medium.
Synchronization: To interpret the received signal correctly, the bit interval of the receiver should be
exactly same or within certain limit of that of the transmitter. Any mismatch between the two may
lead wrong interpretation of the received signal. Usually, clock is generated and synchronized from
the received signal with the help of a special hardware known as Phase Lock Loop (PLL).
Cost of Implementation: It is desirable to keep the encoding technique simple enough such that it
does not incur high cost of implementation.
Figure 4.1.2 Signal element versus data element
4.1.2 Line Coding Techniques
Line coding techniques can be broadly divided into three broad categories: Unipolar, Polar and
Bipolar, as shown in Fig. 4.1.3
Fig. 4.1.3
Unipolar: In unipolar encoding technique, only two voltage levels are used. The polarity of a
pulse refers to whether it is positive or negative. Unipolar encoding use only one polarity means
only one voltage level. In this encoding approach, the bit rate same as data rate.
Disadvantage:
Lack of synchronization (long sequence of 0s and 1s means no change of signal which can alert
potential synchronization problem at receiver end)
Existence of DC component (average amplitude of unipolar encoded signal is nonzero.)
Polar: Polar encoding technique uses two voltage levels – one positive and the other one
negative. Four different encoding schemes shown in Figure 4.1.4 under this category discussed
below:
Figure 4.1.4 Encoding Schemes under polar category
In NRZ encoding the value of the signal is either positive or negative. Two types of NRZ, one is
NRZ-L and another one is NRZ-I.
In NRZ-L, the level of the signal depends on the type of the bit. Positive voltage means 0 and
negative voltage means 1 but long sequence of 0s and 1s with no change of signal may create
Synchronization problem if clock of sender and receiver is not synchronized.
In NRZ-I inversion of the voltage level represents a 1 bit. It is the transition between a positive
and negative voltage, not the voltage itself that represent a 1 bit. A 0 bit represent by no change.
NRZ-I is superior to NRZ-L
The advantages of NRZ coding are:
Detecting a transition in presence of noise is more reliable than to compare a value to a threshold.
NRZ codes are easy to engineer and it makes efficient use of bandwidth.
The spectrum of the NRZ-L and NRZ-I signals are shown in Fig. 4.1.5. It may be noted that most of
the energy is concentrated between 0 and half the bit rate. The main limitations are the presence of a
dc component and the lack of synchronization capability. When there is long sequence of 0’s or 1’s,
the receiving side will fail to regenerate the clock and synchronization between the transmitter and
receiver clocks will fail. NRZ-L and NRZ-I both have an average signal rate of N/2 Bd.
Fig. 4.1.5. Polar NRZ-L and NRZ-I schemes
Return to zero (RZ) uses three values Positive, Negative and Zero. In RZ signal changes not
between bit but during each bit.
Like NRZ-L a positive voltage means 1 and negative voltage means 0 but unlike NRZ-L, half
way through each bit interval, the signal return to zero.1 bit is represented by positive to zero and
0 bit by negative to zero (Fig.4.1.6)
Advantage:
Bit rate is double than that of data rate
No dc component
Good synchronization
Main limitation is the increase in bandwidth
Fig.4.1.6 Polar RZ scheme
Biphase: To overcome the limitations of NRZ encoding, biphase encoding techniques can be
adopted. Manchester and differential Manchester Coding are the two common Biphase
techniques in use, as shown in Fig.4.1.7.
Manchester encoding uses an inversion in the middle of each bit for both synchronization and bit
representation. A negative to Positive transition represent 1 and a positive to negative transition
represent 0. Manchester encoding achieves the same level of Synchronization as RZ but only
two level of amplitude.
In differential Manchester encoding, the inversion at the middle of the bit interval is used for
synchronization but the presence or Absence of additional transition at the beginning of the
interval is used to identify the bit. A transition means binary zero and no Transition means 1.
Fig.4.1.7 Polar biphase: Manchester and differential Manchester schemes
Advantage:
Two levels
No DC component
Good synchronization
Higher bandwidth due to doubling of bit rate with respect to data rate
The bandwidth required for biphase techniques are greater than that of NRZ techniques, but due to
the predictable transition during each bit time, the receiver can synchronize properly on that
transition. A Manchester code is now very popular and has been specified for the IEEE 802.3
standard for base band coaxial cables and twisted pair CSMA/CD bus LANs.
Bipolar Encoding: Bipolar used three voltage levesl. Unlike RZ zero level is used to represent a
0 and a binary 1’s are represented by alternating positive and negative voltages, as shown in Fig
4.1.8.
Fig 4.1.8. Bipolar schemes: AMI (Alternate mark inversion) and pseudoternary
The common bipolar encoding scheme is known as Alternate Mark inversion (AMI). Bipolar n-
zeros substitution (BnZS) is used to avoid synchronization problem if there is consecutive n no.s
of 0 for a long distance transmission.
Pseudoternary encoding: This encoding scheme is same as AMI but alternating positive and
negative pulses occur for binary 0 instead of binary 1. Key characteristics are:
Three levels
No DC component
Loss of synchronization for long sequence of 0’s
Lesser bandwidth
Frequency spectrum of different encoding scheme is shown in Fig. 4.1.9.
Fig. 4.1.9 Frequency spectrum of different encoding scheme
5. Analog Data, Digital Signals
Digital signal is superior to an analog signal. The tendency today is to change an analog signal to
digital data. Analog data such as voice, video and music can be converted into digital signal
communication through transmission media. This allows the use of modern digital transmission
and switching equipment’s. The device used for conversion of analog data to digital signal and
vice versa is called a coder (coder-decoder). There are two basic approaches:
Pulse Code Modulation (PCM)
Delta Modulation (DM)
5.1 Pulse Code Modulation (PCM)
Pulse Code Modulation involves the following three basic steps as shown in Fig. 5.1
Sampling – PAM
Quantization
Line coding
Fig. 5.1 Basic steps of pulse code modulation
Sampling: This process is based on Shannon’s sampling theorem. Numbers of samples of the
signal are taken at regular intervals, at a rate higher than twice the highest significant signal
frequency. This basic step is known as Pulse Amplitude Modulation (PAM). For example, during
the sampling of voice data, in the frequency range 300 to 4000 Hz, 8000 samples per second are
sufficient for the coding.
Quantization: The PAM samples are quantized and approximated to n-bit integer by using
analog-to-digital converter. For example, if n = 4, then there are 16 (=24) levels available for
approximating the PAM signals. This process introduces an error are known as quantization
error. Quantization error depends on step size. Use of uniform step size leads to poorer S/N ratio
for small amplitude signals. With the constraint of a fixed number of levels, the situation can be
improved using variable step size. The effect of quantization error can be minimized by using a
technique known as companding.
Line coding: The digital data thus obtained can be encoded into one of digital signals
At the receiving end, an Digital-to-Analog converter followed by a low-pass filter can be used to
get back the analog signal as shown in Fig. 5.2
Fig. 5.2 Conversion of digital to analog signal
Limitations: The PCM signal has high bandwidth. For example, let us consider voice signal as
input with bandwidth of 4 kHz. Based on Nyquist theorem, the Sampling frequency should be 8
kHz. If an 8-bit ADC is used for conversion to digital data, it generates data rate of 64 Kbps.
Therefore, to send voice signal a data rate of 64 Kbps is required. To overcome this problem a
technique known as Differential PCM (DPCM) can be used.
Why do you need encoding of data before sending over a medium?
Ans: Suitable encoding of data is required in order to transmit signal with minimum attenuation
and optimize the use of transmission media in terms of data rate and error rate.
Distinguish between PAM and PCM signals?
Ans: In order to convert Analog data to Digital signal, initially sampling is done on the analog data
by using Sample & Hold (S/H) circuit. The output of the S/H circuit is known as PAM (Pulse
Amplitude Modulated) signal. The PAM signal is then converted to PCM (Pulse Code Modulated)
data by using a Analog-to-Digital (A/D) converter circuit. This digital data (PCM) is passed through
an encoder to generate PCM signal.
Between RZ and NRZ encoding techniques, which requires higher bandwidth and why?
Ans: RZ encoding requires more bandwidth, as it requires two signal changes to encode one bit.
What is quantization error? How can it be reduced?
Ans: To convert analog signal to digital signal, the analog signal is first sampled and each of these
analog samples must be assigned a binary code. In other words, each sample is approximated by
being quantized into some binary codes. As the quantized values are only approximations, it is
impossible to recover the original signal exactly. Error due to this quantization is known as
quantization error. Quantization error can be minimized by using non-linear encoding.
How does Manchester encoding differ from differential Manchester encoding?
Ans: In the Manchester encoding, a low-to-high transition represents a 1, and a high-to-low
transition represents a 0. There is a transition at the middle of each bit period, which serves the
purpose of synchronization and encoding of data.
In Differential Manchester, the encoding of a 0 is represented by the presence of a transition at
the beginning of a bit period, and a 1 is represented by the absence of a transition at the
beginning of a bit period. In this case, the mid bit transition is only used for synchronization.
5.1 TRANSMISSION MODES
The transmission of binary data across a link can be accomplished in either parallel or serial
mode. In parallel mode, multiple bits are sent with each clock tick. In serial mode, 1 bit is sent
with each clock tick. While there is only one way to send parallel data, there are three subclasses
of serial transmission: asynchronous, synchronous, and isochronous.
Parallel transmission Serial transmission
Asynchronous transmission
In asynchronous transmission, we send 1 start bit (0) at the beginning and 1 or more stop bits
(1s) at the end of each byte. There may be a gap between
each byte. Asynchronous here means “asynchronous at the byte level,” but the bits are still
synchronized; their durations are the same.
Asynchronous transmission
In synchronous transmission, we send bits one after another without start or stop bits or gaps. It
is the responsibility of the receiver to group the bits.
Synchronous transmission
6. Analog data to analog signal
Although transmission of digital signal is preferred, it is not always feasible to transmit in digital
form because it requires channel of high bandwidth having low pass characteristics. On the other
hand, an analog transmission requires lower bandwidth having band pass characteristics. The
process involved in analog transmission is known as modulation, which requires manipulation
of one or more of the parameters of the carrier that characterizes the analog signal. Modulation
is needed if the medium is bandpass in nature or if only a bandpass channel is available to us.
Some of the important advantages of modulation are summarized below:
Frequency translation: Modulation translates the signal from one region of frequency
domain to another region. This helps to transmit the modulated signal with minimum
attenuation through a particular medium.
Practical size of antenna: Modulation translates baseband signal to higher frequency, which
can be transmitted through a bandpass channel using an antenna of smaller size.
Narrowbanding: As modulation translates a signal from lower frequency domain to higher
frequency domain, the ratio between highest to lowest frequency of the modulated signal
becomes close to 1.
Multiplexing: Different base band signals originating from different sources can be
translated to different frequency ranges. This allows transmission of different signals through
the same medium using frequency division multiplexing (FDM)
The modulation technique can be broadly divided into two basic categories; Amplitude
modulation and Angle modulation. The Angle modulation can be further divided into two more
categories; Frequency and Phase modulations as shown in Fig. 6.1
Fig. 6.1 Categories of modulation techniques
6.1 Amplitude Modulation (AM)
This is the simplest form of modulation where the amplitude of the carrier wave is modulated by
the analog signal known as the modulating signal. A signal to be modulated, a carrier and the
modulated signal are shown in Fig. 6.1.1
Fig. 6.1.1 Amplitude modulation
Frequency Spectrum: Frequency spectrum of the sinusoidal AM signal can be represented by
s(t) = Ec [1 + m cos 2πfmt] cos 2πfct
= Ec cos 2πfct + m Ec cos 2πfmt cos 2πfct
= Ec cos 2πfct + m/2 Ec cos 2π(fc – fm)t + m/2 Ec cos 2π(fc + fm)t
It may be noted that there are three frequency components; Carrier wave of amplitude Ec, Lower
sideband of amplitude m/2 Ec and Higher sideband of amplitude m/2 Ec, as shown in Fig. 6.1.2.
Fig. 6.1.2 Spectrum of a modulated signal
The total bandwidth required for AM can be determined from the bandwidth of the audio signal:
BAM = 2B.
6.2 Frequency modulation
In FM transmission, the frequency of the carrier signal is modulated to follow the changing
voltage level (amplitude) of the modulating signal. The peak amplitude and phase of the carrier
signal remain constant but as the amplitude of the information signal changes, the frequency of
the carrier signal changes correspondingly. FM is normally implemented using voltage
controlled oscillator. Fig. 6.2.1 shows the relationship of the modulating signal, the carrier signal
and the resultant FM signal.
The total bandwidth required for FM can be determined from the bandwidth
of the audio signal: BFM = 2(1 + β)B. β is the factor depends on modulation technique.
Fig. 6.2.1 Frequency modulation
6.3 Phase modulation
In PM transmission, the Phase of the carrier signal is modulated to follow the changing voltage
level (amplitude) of the modulating signal. The peak amplitude and frequency of the carrier
signal remain constant but as the amplitude of the information signal changes, the phase of the
carrier signal changes correspondingly. PM is normally implemented using voltage controlled
oscillator along with a derivative. Fig. 6.3.1 shows the relationship of the modulating signal, the
carrier signal and the resultant FM signal. In PM the instantaneous change in the carrier
frequency is proportional to the derivative of the amplitude of the modulating signal.
Fig. 6.3.1 Phase modulation
The total bandwidth required for PM can be determined from the bandwidth and maximum
amplitude of the modulating signal: BPM = 2(1 + β)B. β is the factor depends on modulation
technique.
Q. Between AM and FM, which one gives better noise immunity?
Ans: FM is more immune to noise than AM, since the power of transmission is independent of
the modulation index.
7. Digital-to-analog conversion
Quite often we have to send digital data through analog transmission media such as a telephone
network. In such situations it is essential to convert digital data to analog signal. Basic approach
is shown in Fig. 7.1 This conversion is accomplished with the help of special devices such as
modem (modulator-demodulator) that converts digital data to analog signal and vice versa.
Fig. 7.1 Conversion of digital data to analog signal
Since modulation involves operations on one or more of the three characteristics of the carrier
signal, namely amplitude, frequency and phase, three basic encoding or modulation techniques
are available for conversion of digital data to analog signals as shown in Fig. 7.1.2. The three
techniques, referred to as amplitude shift keying (ASK), frequency shift keying (FSK) and phase
shift keying (PSK). There are many situations where ASK and PSK techniques are combined
together leading to a modulation technique known as Quardrature Amplitude Modulation
(QAM).
Fig. 7.2 Types of digital-to-analog modulation
7.1 Amplitude-shift keying (ASK)
In amplitude Shift keying, logic levels are represented by different amplitudes of signals.
Usually, one amplitude is zero for logic digital logic zero while is logic 1 represented by the
actual amplitudes of some sine wave signal. Fig 7.1.1 shows the expected waveforms in ASK.
Fig. 7.1.1 Amplitude-shift keying (ASK)
Both the frequency and phase remain constant while the amplitude changes. The bandwidth
requirement of ASK signal is B= (1+d)S, where S is the signal rate and B is the bandwidth and
the value of d is between 0 and 1.
This method is very much susceptible to noise and sudden gain changes and hence it is
considered as an inefficient modulation technique.
7.2 Frequency-Shift keying (FSK)
In this case two binary values are represented carrier frequency. In FSK two carrier frequencies
f1 and f2 are used to represent 1 and 0 as shown in the above figure.
Here s(t) = A cos 2πfc1t for binary 1
And s(t) = A cos 2πfc2t for binary 0
This method is less susceptible to errors than ASK. It is mainly used in higher frequency radio
transmission.
Frequency spectrum: FSK may be considered as a combination of two ASK spectra centered
around fc1 and fc2, which requires higher bandwidth. The bandwidth = (fc2 - fc1) + Nb.
Fig7.2.1 Frequency-Shift keying
7.3. Phase shift Keying (PSK)
In this method, the phase of the carrier signal is shifted by the modulated signal with the phase
measured relative to the previous bit interval. The binary 0 is represented by sending a signal of the
same phase as the preceding one and 1 is represented by sending the signal with an opposite phase to
the previous one as shown in Fig. 7.3.1.
Fig. 7.3.1 Phase-shift keying
In 2-PSK the carrier is the carrier is used to present 0 and 1.
s(t) = A cos (2πfct+π) for binary 1
s(t) = A cos (2πfct) for binary 0
The representation is called constellation diagram, which provides a graphical representation of
the complex envelope of each possible symbol state. The x-axis of a constellation diagram represents
the in-phase component of the complex envelope, and the y-axis represents the quadrature
component of the complex envelope. The distance between signals on a constellation diagram
indicates how different the modulation waveforms are, and how well a receiver can differentiate
between all possible symbols in presence of noise.
Fig. 7.3.1
QPSK: For more efficient use of bandwidth Quadrature Phase-shift keying (QPSK) can be used
where
In 8-PSK phase is shifted by 450
as shown in figure.

Weitere ähnliche Inhalte

Was ist angesagt?

Was ist angesagt? (20)

03 Data and_Signals
03 Data and_Signals03 Data and_Signals
03 Data and_Signals
 
PCM and delta modulation.ppt
PCM and delta modulation.pptPCM and delta modulation.ppt
PCM and delta modulation.ppt
 
Nyquist criterion for zero ISI
Nyquist criterion for zero ISINyquist criterion for zero ISI
Nyquist criterion for zero ISI
 
Phydyas 09 fFilter Bank Multicarrier (FBMC): An Integrated Solution to Spectr...
Phydyas 09 fFilter Bank Multicarrier (FBMC): An Integrated Solution to Spectr...Phydyas 09 fFilter Bank Multicarrier (FBMC): An Integrated Solution to Spectr...
Phydyas 09 fFilter Bank Multicarrier (FBMC): An Integrated Solution to Spectr...
 
Lica 3rd chapter slides
Lica 3rd chapter slidesLica 3rd chapter slides
Lica 3rd chapter slides
 
Receivers
ReceiversReceivers
Receivers
 
Noise analysis
Noise  analysisNoise  analysis
Noise analysis
 
Ruido De CuantificacióN
Ruido De CuantificacióNRuido De CuantificacióN
Ruido De CuantificacióN
 
Turbo code
Turbo codeTurbo code
Turbo code
 
Switched capacitor
Switched capacitorSwitched capacitor
Switched capacitor
 
Companding & Pulse Code Modulation
Companding & Pulse Code ModulationCompanding & Pulse Code Modulation
Companding & Pulse Code Modulation
 
Companding and DPCM and ADPCM
Companding and DPCM and ADPCMCompanding and DPCM and ADPCM
Companding and DPCM and ADPCM
 
Phase Noise and Jitter Measurements
Phase Noise and Jitter MeasurementsPhase Noise and Jitter Measurements
Phase Noise and Jitter Measurements
 
Digital Communication 1
Digital Communication 1Digital Communication 1
Digital Communication 1
 
Integrated circuit
Integrated circuitIntegrated circuit
Integrated circuit
 
baseband system
baseband systembaseband system
baseband system
 
Digital communications
Digital communicationsDigital communications
Digital communications
 
Base band transmission
Base band transmissionBase band transmission
Base band transmission
 
UNIT-4.pptx
UNIT-4.pptxUNIT-4.pptx
UNIT-4.pptx
 
linear equalizer and turbo equalizer
linear equalizer and turbo equalizerlinear equalizer and turbo equalizer
linear equalizer and turbo equalizer
 

Andere mochten auch

DRM Evolution 2005 03 17
DRM Evolution 2005 03 17DRM Evolution 2005 03 17
DRM Evolution 2005 03 17Amit Maitra
 
Metastudio DRM. Product presentation (en)
Metastudio DRM. Product presentation (en)Metastudio DRM. Product presentation (en)
Metastudio DRM. Product presentation (en)Ireneusz Chmielak
 
Amplitude modulation
Amplitude modulationAmplitude modulation
Amplitude modulationRumah Belajar
 
Digital Modulation Unit 3
Digital Modulation Unit 3Digital Modulation Unit 3
Digital Modulation Unit 3Anil Nigam
 
Game Theory Presentation
Game Theory PresentationGame Theory Presentation
Game Theory PresentationMehdi Ghotbi
 

Andere mochten auch (6)

DRM Evolution 2005 03 17
DRM Evolution 2005 03 17DRM Evolution 2005 03 17
DRM Evolution 2005 03 17
 
Metastudio DRM. Product presentation (en)
Metastudio DRM. Product presentation (en)Metastudio DRM. Product presentation (en)
Metastudio DRM. Product presentation (en)
 
Game theory ppt
Game theory pptGame theory ppt
Game theory ppt
 
Amplitude modulation
Amplitude modulationAmplitude modulation
Amplitude modulation
 
Digital Modulation Unit 3
Digital Modulation Unit 3Digital Modulation Unit 3
Digital Modulation Unit 3
 
Game Theory Presentation
Game Theory PresentationGame Theory Presentation
Game Theory Presentation
 

Ähnlich wie Module ii physical layer

Ch3Data communication and networking by neha g. kurale
Ch3Data communication and networking by neha g. kuraleCh3Data communication and networking by neha g. kurale
Ch3Data communication and networking by neha g. kuraleNeha Kurale
 
Chapter 3 - Data and Signals
Chapter 3 - Data and SignalsChapter 3 - Data and Signals
Chapter 3 - Data and SignalsWayne Jones Jnr
 
Ch03
Ch03Ch03
Ch03H K
 
COMPUTER NETWORKS DATAS AND SIGNALS.pptx
COMPUTER NETWORKS DATAS AND SIGNALS.pptxCOMPUTER NETWORKS DATAS AND SIGNALS.pptx
COMPUTER NETWORKS DATAS AND SIGNALS.pptxKALPANAC20
 
Telecommunications basics
Telecommunications basicsTelecommunications basics
Telecommunications basicsAarón Candia
 
Chap 3 data and signals
Chap 3 data and signalsChap 3 data and signals
Chap 3 data and signalsMukesh Tekwani
 
Communication systems
Communication systemsCommunication systems
Communication systemsUmang Gupta
 
computer networks
computer networkscomputer networks
computer networksvimalraman
 
3. Data and Signals-1.ppt
3. Data and Signals-1.ppt3. Data and Signals-1.ppt
3. Data and Signals-1.ppttest22333
 
Data Communication And Networking - DATA & SIGNALS
Data Communication And Networking - DATA & SIGNALSData Communication And Networking - DATA & SIGNALS
Data Communication And Networking - DATA & SIGNALSAvijeet Negel
 

Ähnlich wie Module ii physical layer (20)

M2 l1
M2 l1M2 l1
M2 l1
 
Ch3Data communication and networking by neha g. kurale
Ch3Data communication and networking by neha g. kuraleCh3Data communication and networking by neha g. kurale
Ch3Data communication and networking by neha g. kurale
 
Chapter 3 - Data and Signals
Chapter 3 - Data and SignalsChapter 3 - Data and Signals
Chapter 3 - Data and Signals
 
Chapter 3
Chapter 3Chapter 3
Chapter 3
 
Ch03
Ch03Ch03
Ch03
 
COMPUTER NETWORKS DATAS AND SIGNALS.pptx
COMPUTER NETWORKS DATAS AND SIGNALS.pptxCOMPUTER NETWORKS DATAS AND SIGNALS.pptx
COMPUTER NETWORKS DATAS AND SIGNALS.pptx
 
Telecommunications basics
Telecommunications basicsTelecommunications basics
Telecommunications basics
 
Chap 3 data and signals
Chap 3 data and signalsChap 3 data and signals
Chap 3 data and signals
 
Network : Ch03
Network : Ch03Network : Ch03
Network : Ch03
 
Communication systems
Communication systemsCommunication systems
Communication systems
 
computer networks
computer networkscomputer networks
computer networks
 
3. Data and Signals-1.ppt
3. Data and Signals-1.ppt3. Data and Signals-1.ppt
3. Data and Signals-1.ppt
 
ch3_1_v1.ppt
ch3_1_v1.pptch3_1_v1.ppt
ch3_1_v1.ppt
 
Chapter 3: Data & Signals
Chapter 3: Data & SignalsChapter 3: Data & Signals
Chapter 3: Data & Signals
 
2. data and signals
2. data and signals2. data and signals
2. data and signals
 
Lecture-3 Data Communication ~www.fida.com.bd
Lecture-3 Data Communication ~www.fida.com.bdLecture-3 Data Communication ~www.fida.com.bd
Lecture-3 Data Communication ~www.fida.com.bd
 
Ch3 1 v1
Ch3 1 v1Ch3 1 v1
Ch3 1 v1
 
Ch3 1 v1
Ch3 1 v1Ch3 1 v1
Ch3 1 v1
 
Data Communication And Networking - DATA & SIGNALS
Data Communication And Networking - DATA & SIGNALSData Communication And Networking - DATA & SIGNALS
Data Communication And Networking - DATA & SIGNALS
 
waves and signals
waves and signalswaves and signals
waves and signals
 

Mehr von Sisir Ghosh

ASP.NET Session 2
ASP.NET Session 2ASP.NET Session 2
ASP.NET Session 2Sisir Ghosh
 
ASP.NET Session 3
ASP.NET Session 3ASP.NET Session 3
ASP.NET Session 3Sisir Ghosh
 
ASP.NET Session 4
ASP.NET Session 4ASP.NET Session 4
ASP.NET Session 4Sisir Ghosh
 
ASP.NET Session 5
ASP.NET Session 5ASP.NET Session 5
ASP.NET Session 5Sisir Ghosh
 
ASP.NET Session 6
ASP.NET Session 6ASP.NET Session 6
ASP.NET Session 6Sisir Ghosh
 
ASP.NET Session 7
ASP.NET Session 7ASP.NET Session 7
ASP.NET Session 7Sisir Ghosh
 
ASP.NET Session 8
ASP.NET Session 8ASP.NET Session 8
ASP.NET Session 8Sisir Ghosh
 
ASP.NET Session 9
ASP.NET Session 9ASP.NET Session 9
ASP.NET Session 9Sisir Ghosh
 
ASP.NET Session 10
ASP.NET Session 10ASP.NET Session 10
ASP.NET Session 10Sisir Ghosh
 
ASP.NET Session 11 12
ASP.NET Session 11 12ASP.NET Session 11 12
ASP.NET Session 11 12Sisir Ghosh
 
ASP.NET Session 13 14
ASP.NET Session 13 14ASP.NET Session 13 14
ASP.NET Session 13 14Sisir Ghosh
 
ASP.NET Session 16
ASP.NET Session 16ASP.NET Session 16
ASP.NET Session 16Sisir Ghosh
 
ASP.NET System design 2
ASP.NET System design 2ASP.NET System design 2
ASP.NET System design 2Sisir Ghosh
 
ASP.NET Session 1
ASP.NET Session 1ASP.NET Session 1
ASP.NET Session 1Sisir Ghosh
 
Network security
Network securityNetwork security
Network securitySisir Ghosh
 
Error detection and correction
Error detection and correctionError detection and correction
Error detection and correctionSisir Ghosh
 
Overview of data communication and networking
Overview of data communication and networkingOverview of data communication and networking
Overview of data communication and networkingSisir Ghosh
 
Application layer
Application layerApplication layer
Application layerSisir Ghosh
 

Mehr von Sisir Ghosh (20)

ASP.NET Session 2
ASP.NET Session 2ASP.NET Session 2
ASP.NET Session 2
 
ASP.NET Session 3
ASP.NET Session 3ASP.NET Session 3
ASP.NET Session 3
 
ASP.NET Session 4
ASP.NET Session 4ASP.NET Session 4
ASP.NET Session 4
 
ASP.NET Session 5
ASP.NET Session 5ASP.NET Session 5
ASP.NET Session 5
 
ASP.NET Session 6
ASP.NET Session 6ASP.NET Session 6
ASP.NET Session 6
 
ASP.NET Session 7
ASP.NET Session 7ASP.NET Session 7
ASP.NET Session 7
 
ASP.NET Session 8
ASP.NET Session 8ASP.NET Session 8
ASP.NET Session 8
 
ASP.NET Session 9
ASP.NET Session 9ASP.NET Session 9
ASP.NET Session 9
 
ASP.NET Session 10
ASP.NET Session 10ASP.NET Session 10
ASP.NET Session 10
 
ASP.NET Session 11 12
ASP.NET Session 11 12ASP.NET Session 11 12
ASP.NET Session 11 12
 
ASP.NET Session 13 14
ASP.NET Session 13 14ASP.NET Session 13 14
ASP.NET Session 13 14
 
ASP.NET Session 16
ASP.NET Session 16ASP.NET Session 16
ASP.NET Session 16
 
ASP.NET System design 2
ASP.NET System design 2ASP.NET System design 2
ASP.NET System design 2
 
ASP.NET Session 1
ASP.NET Session 1ASP.NET Session 1
ASP.NET Session 1
 
Transport layer
Transport layerTransport layer
Transport layer
 
Routing
RoutingRouting
Routing
 
Network security
Network securityNetwork security
Network security
 
Error detection and correction
Error detection and correctionError detection and correction
Error detection and correction
 
Overview of data communication and networking
Overview of data communication and networkingOverview of data communication and networking
Overview of data communication and networking
 
Application layer
Application layerApplication layer
Application layer
 

Kürzlich hochgeladen

Grant Readiness 101 TechSoup and Remy Consulting
Grant Readiness 101 TechSoup and Remy ConsultingGrant Readiness 101 TechSoup and Remy Consulting
Grant Readiness 101 TechSoup and Remy ConsultingTechSoup
 
18-04-UA_REPORT_MEDIALITERAСY_INDEX-DM_23-1-final-eng.pdf
18-04-UA_REPORT_MEDIALITERAСY_INDEX-DM_23-1-final-eng.pdf18-04-UA_REPORT_MEDIALITERAСY_INDEX-DM_23-1-final-eng.pdf
18-04-UA_REPORT_MEDIALITERAСY_INDEX-DM_23-1-final-eng.pdfssuser54595a
 
Measures of Central Tendency: Mean, Median and Mode
Measures of Central Tendency: Mean, Median and ModeMeasures of Central Tendency: Mean, Median and Mode
Measures of Central Tendency: Mean, Median and ModeThiyagu K
 
Advanced Views - Calendar View in Odoo 17
Advanced Views - Calendar View in Odoo 17Advanced Views - Calendar View in Odoo 17
Advanced Views - Calendar View in Odoo 17Celine George
 
Introduction to ArtificiaI Intelligence in Higher Education
Introduction to ArtificiaI Intelligence in Higher EducationIntroduction to ArtificiaI Intelligence in Higher Education
Introduction to ArtificiaI Intelligence in Higher Educationpboyjonauth
 
Accessible design: Minimum effort, maximum impact
Accessible design: Minimum effort, maximum impactAccessible design: Minimum effort, maximum impact
Accessible design: Minimum effort, maximum impactdawncurless
 
Z Score,T Score, Percential Rank and Box Plot Graph
Z Score,T Score, Percential Rank and Box Plot GraphZ Score,T Score, Percential Rank and Box Plot Graph
Z Score,T Score, Percential Rank and Box Plot GraphThiyagu K
 
Hybridoma Technology ( Production , Purification , and Application )
Hybridoma Technology  ( Production , Purification , and Application  ) Hybridoma Technology  ( Production , Purification , and Application  )
Hybridoma Technology ( Production , Purification , and Application ) Sakshi Ghasle
 
Organic Name Reactions for the students and aspirants of Chemistry12th.pptx
Organic Name Reactions  for the students and aspirants of Chemistry12th.pptxOrganic Name Reactions  for the students and aspirants of Chemistry12th.pptx
Organic Name Reactions for the students and aspirants of Chemistry12th.pptxVS Mahajan Coaching Centre
 
BASLIQ CURRENT LOOKBOOK LOOKBOOK(1) (1).pdf
BASLIQ CURRENT LOOKBOOK  LOOKBOOK(1) (1).pdfBASLIQ CURRENT LOOKBOOK  LOOKBOOK(1) (1).pdf
BASLIQ CURRENT LOOKBOOK LOOKBOOK(1) (1).pdfSoniaTolstoy
 
Privatization and Disinvestment - Meaning, Objectives, Advantages and Disadva...
Privatization and Disinvestment - Meaning, Objectives, Advantages and Disadva...Privatization and Disinvestment - Meaning, Objectives, Advantages and Disadva...
Privatization and Disinvestment - Meaning, Objectives, Advantages and Disadva...RKavithamani
 
microwave assisted reaction. General introduction
microwave assisted reaction. General introductionmicrowave assisted reaction. General introduction
microwave assisted reaction. General introductionMaksud Ahmed
 
Student login on Anyboli platform.helpin
Student login on Anyboli platform.helpinStudent login on Anyboli platform.helpin
Student login on Anyboli platform.helpinRaunakKeshri1
 
Software Engineering Methodologies (overview)
Software Engineering Methodologies (overview)Software Engineering Methodologies (overview)
Software Engineering Methodologies (overview)eniolaolutunde
 
1029 - Danh muc Sach Giao Khoa 10 . pdf
1029 -  Danh muc Sach Giao Khoa 10 . pdf1029 -  Danh muc Sach Giao Khoa 10 . pdf
1029 - Danh muc Sach Giao Khoa 10 . pdfQucHHunhnh
 
A Critique of the Proposed National Education Policy Reform
A Critique of the Proposed National Education Policy ReformA Critique of the Proposed National Education Policy Reform
A Critique of the Proposed National Education Policy ReformChameera Dedduwage
 
Presentation by Andreas Schleicher Tackling the School Absenteeism Crisis 30 ...
Presentation by Andreas Schleicher Tackling the School Absenteeism Crisis 30 ...Presentation by Andreas Schleicher Tackling the School Absenteeism Crisis 30 ...
Presentation by Andreas Schleicher Tackling the School Absenteeism Crisis 30 ...EduSkills OECD
 

Kürzlich hochgeladen (20)

Grant Readiness 101 TechSoup and Remy Consulting
Grant Readiness 101 TechSoup and Remy ConsultingGrant Readiness 101 TechSoup and Remy Consulting
Grant Readiness 101 TechSoup and Remy Consulting
 
18-04-UA_REPORT_MEDIALITERAСY_INDEX-DM_23-1-final-eng.pdf
18-04-UA_REPORT_MEDIALITERAСY_INDEX-DM_23-1-final-eng.pdf18-04-UA_REPORT_MEDIALITERAСY_INDEX-DM_23-1-final-eng.pdf
18-04-UA_REPORT_MEDIALITERAСY_INDEX-DM_23-1-final-eng.pdf
 
Measures of Central Tendency: Mean, Median and Mode
Measures of Central Tendency: Mean, Median and ModeMeasures of Central Tendency: Mean, Median and Mode
Measures of Central Tendency: Mean, Median and Mode
 
Advanced Views - Calendar View in Odoo 17
Advanced Views - Calendar View in Odoo 17Advanced Views - Calendar View in Odoo 17
Advanced Views - Calendar View in Odoo 17
 
Introduction to ArtificiaI Intelligence in Higher Education
Introduction to ArtificiaI Intelligence in Higher EducationIntroduction to ArtificiaI Intelligence in Higher Education
Introduction to ArtificiaI Intelligence in Higher Education
 
Accessible design: Minimum effort, maximum impact
Accessible design: Minimum effort, maximum impactAccessible design: Minimum effort, maximum impact
Accessible design: Minimum effort, maximum impact
 
Z Score,T Score, Percential Rank and Box Plot Graph
Z Score,T Score, Percential Rank and Box Plot GraphZ Score,T Score, Percential Rank and Box Plot Graph
Z Score,T Score, Percential Rank and Box Plot Graph
 
Hybridoma Technology ( Production , Purification , and Application )
Hybridoma Technology  ( Production , Purification , and Application  ) Hybridoma Technology  ( Production , Purification , and Application  )
Hybridoma Technology ( Production , Purification , and Application )
 
Staff of Color (SOC) Retention Efforts DDSD
Staff of Color (SOC) Retention Efforts DDSDStaff of Color (SOC) Retention Efforts DDSD
Staff of Color (SOC) Retention Efforts DDSD
 
TataKelola dan KamSiber Kecerdasan Buatan v022.pdf
TataKelola dan KamSiber Kecerdasan Buatan v022.pdfTataKelola dan KamSiber Kecerdasan Buatan v022.pdf
TataKelola dan KamSiber Kecerdasan Buatan v022.pdf
 
Organic Name Reactions for the students and aspirants of Chemistry12th.pptx
Organic Name Reactions  for the students and aspirants of Chemistry12th.pptxOrganic Name Reactions  for the students and aspirants of Chemistry12th.pptx
Organic Name Reactions for the students and aspirants of Chemistry12th.pptx
 
BASLIQ CURRENT LOOKBOOK LOOKBOOK(1) (1).pdf
BASLIQ CURRENT LOOKBOOK  LOOKBOOK(1) (1).pdfBASLIQ CURRENT LOOKBOOK  LOOKBOOK(1) (1).pdf
BASLIQ CURRENT LOOKBOOK LOOKBOOK(1) (1).pdf
 
Privatization and Disinvestment - Meaning, Objectives, Advantages and Disadva...
Privatization and Disinvestment - Meaning, Objectives, Advantages and Disadva...Privatization and Disinvestment - Meaning, Objectives, Advantages and Disadva...
Privatization and Disinvestment - Meaning, Objectives, Advantages and Disadva...
 
microwave assisted reaction. General introduction
microwave assisted reaction. General introductionmicrowave assisted reaction. General introduction
microwave assisted reaction. General introduction
 
Student login on Anyboli platform.helpin
Student login on Anyboli platform.helpinStudent login on Anyboli platform.helpin
Student login on Anyboli platform.helpin
 
Software Engineering Methodologies (overview)
Software Engineering Methodologies (overview)Software Engineering Methodologies (overview)
Software Engineering Methodologies (overview)
 
Mattingly "AI & Prompt Design: The Basics of Prompt Design"
Mattingly "AI & Prompt Design: The Basics of Prompt Design"Mattingly "AI & Prompt Design: The Basics of Prompt Design"
Mattingly "AI & Prompt Design: The Basics of Prompt Design"
 
1029 - Danh muc Sach Giao Khoa 10 . pdf
1029 -  Danh muc Sach Giao Khoa 10 . pdf1029 -  Danh muc Sach Giao Khoa 10 . pdf
1029 - Danh muc Sach Giao Khoa 10 . pdf
 
A Critique of the Proposed National Education Policy Reform
A Critique of the Proposed National Education Policy ReformA Critique of the Proposed National Education Policy Reform
A Critique of the Proposed National Education Policy Reform
 
Presentation by Andreas Schleicher Tackling the School Absenteeism Crisis 30 ...
Presentation by Andreas Schleicher Tackling the School Absenteeism Crisis 30 ...Presentation by Andreas Schleicher Tackling the School Absenteeism Crisis 30 ...
Presentation by Andreas Schleicher Tackling the School Absenteeism Crisis 30 ...
 

Module ii physical layer

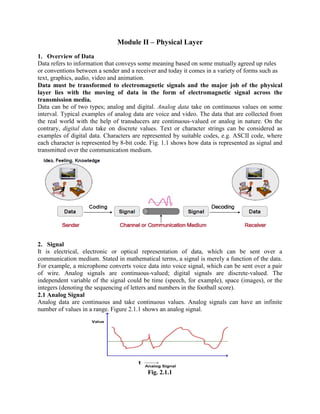
  • 1. Module II – Physical Layer 1. Overview of Data Data refers to information that conveys some meaning based on some mutually agreed up rules or conventions between a sender and a receiver and today it comes in a variety of forms such as text, graphics, audio, video and animation. Data must be transformed to electromagnetic signals and the major job of the physical layer lies with the moving of data in the form of electromagnetic signal across the transmission media. Data can be of two types; analog and digital. Analog data take on continuous values on some interval. Typical examples of analog data are voice and video. The data that are collected from the real world with the help of transducers are continuous-valued or analog in nature. On the contrary, digital data take on discrete values. Text or character strings can be considered as examples of digital data. Characters are represented by suitable codes, e.g. ASCII code, where each character is represented by 8-bit code. Fig. 1.1 shows how data is represented as signal and transmitted over the communication medium. 2. Signal It is electrical, electronic or optical representation of data, which can be sent over a communication medium. Stated in mathematical terms, a signal is merely a function of the data. For example, a microphone converts voice data into voice signal, which can be sent over a pair of wire. Analog signals are continuous-valued; digital signals are discrete-valued. The independent variable of the signal could be time (speech, for example), space (images), or the integers (denoting the sequencing of letters and numbers in the football score). 2.1 Analog Signal Analog data are continuous and take continuous values. Analog signals can have an infinite number of values in a range. Figure 2.1.1 shows an analog signal. Fig. 2.1.1
  • 2. In data communication, we commonly use periodic analog signals. Periodic signals completes a pattern within a measurable time frame, called a period, and repeat the pattern over subsequent identical periods. The completion of full period is called a cycle. Periodic analog signals can be classified as simple or composite. A simple periodic analog signal, a sine wave, cannot be decomposed into simpler signals. Fig. 2.1.2 shows the simple analog signal where S is the instantaneous amplitude, A is the peak amplitude, f is frequency, and Ø is the phase. A sine wave cannot be decomposed into simpler signal. Peak amplitude is the absolute value of its highest intensity proportional to the energy it carries. Like electrical signal peak amplitude is measured in volts. Fig. 2.1.2 Simple sine wave analog signal A composite periodic analog signal is composed of multiple sine waves. any composite signal can be represented as a combination of simple sine waves with different frequencies, phases and amplitudes. Periodic composite signal (period=T, freq. = f0=1/T) can be represented as a sum of simple sines and/or cosines known as Fourier series: Fig2.1.3 shows the Composite analog signal. Fig. 2.3 Composite analog signal
  • 3. 2.2 Frequency and period Period refers to the amount of time, in second, a signal needs to complete one cycle Frequency refers to the number of periods in one second. Frequency and period are the inverse of each other. Frequency is the rate of change with respect to time. Change in a short span of time means high frequency. Change over a long span of time means low frequency. If a signal does not change at all, its frequency is zero. If a signal changes instantaneously, its frequency is infinite. Fig. 2.2.1 shows the relationship of period and frequency Fig. 2.2.1 Two signals with the same amplitude and phase, but different frequencies Q1.The period of a signal is 100 ms. What is its frequency in kilohertz? Solution First we change 100 ms to seconds, and then we calculate the frequency from the period (1 Hz = 10−3 kHz). 2.3 Phase
  • 4. Phase describes the position of the waveform relative to time 0. Fig. 2.3.1 shows the three sine waves with the same amplitude and frequency, but different phases. Fig. 2.3.1 2.4 Wavelength Wavelength is the distance between identical points in the adjacent cycles of a waveform signal propagated in space or along a wire, as shown in the Fig. 2.4.1. In wireless systems, this length is usually specified in meters, centimeters, or millimeters. In the case of infrared, visible light, ultraviolet, and gamma radiation, the wavelength is more often specified in nanometers (units of 10-9 meter) or Angstrom units (units of 10-10 meter). Wavelength is inversely related to frequency. The higher the frequency of the signal, the shorter the wavelength. If f is the frequency of the signal as measured in megahertz, and w is the wavelength as measured in meters, then w = 300/f And conversely f = 300/w Fig. 2.4.1 2.5 Frequency domain concepts The time domain representation displays a signal using time-domain plot, which shows changes in signal amplitude with time. The time-domain plot can be visualized with the help of an oscilloscope. The relationship between amplitude and frequency is provided by frequency domain representation, which can be displayed with the help of spectrum analyser. Time domain and frequency domain representations of three sine waves of three different frequencies are shown in Fig. 2.5.1.
  • 5. Fig. 2.5.1 The time domain and frequency domain of three sine waves Composite signals made of many simple sine waves find use in data communication. Any composite signal can be represented by a combination of simple sine waves using Fourier Analysis. For example, the signal shown in Fig. 2.5.2(c) is a composition of two sine waves having frequencies f1, 3f1, shown in Fig. 2.5.2 (a) and (b), respectively and it can be represented by s (t) = sin ωt + 1/3 sin 3ωt , where ω = 2πf1. The frequency domain function s(f) specifies the constituent frequencies of the signal. The range of frequencies that a signal contains is known as it spectrum, which can be visualized with the help of a spectrum analyser. The band of frequencies over which most of the energy of a signal is concentrated is known as the bandwidth of the signal. Fig. 2.5.2 Time and frequency domain representations of a composite signal If the composite signal is periodic, the decomposition gives a series of signals with discrete frequencies; if the composite signal is nonperiodic, the decomposition gives a combination of sine waves with continuous frequencies.
  • 6. 2.6 Frequency Spectrum Frequency spectrum of a signal is the range of frequencies that a signal contains. The frequency spectrum of this signal can be approximation comprising only the first and third harmonics as shown in Fig. 2.6.1. Fig. 2.6.1 2.7 Bandwidth The bandwidth of a composite signal is the difference between the highest and the lowest frequencies contained in that signal (Fig. 2.7.1). Fig. 2.7.1 Frequency spectrum and bandwidth of a signal Fig. 2.7.1 Frequency spectrum and bandwidth of a signal
  • 7. Q2. If a periodic signal is decomposed into five sine waves with frequencies of 100, 300, 500, 700, and 900 Hz, what is its bandwidth? Draw the spectrum, assuming all components have maximum amplitude of 10 V. Solution Let fh be the highest frequency, fl the lowest frequency, and B the bandwidth. The spectrum has only five spikes, at 100, 300, 500, 700, and 900 Hz (see Figure 2.7.2) Fig. 2.7.2 Q3. A nonperiodic composite signal has a bandwidth of 200 kHz, with a middle frequency of 140 kHz and peak amplitude of 20 V. The two extreme frequencies have amplitude of 0. Draw the frequency domain of the signal. Solution The lowest frequency must be at 40 kHz and the highest at 240 kHz. Figure 3.15 shows the frequency domain and the bandwidth. 2.8 DIGITAL SIGNALS For example, a 1 can be encoded as a positive voltage and a 0 as zero voltage. A digital signal can have more than two levels. In this case, we can send more than 1 bit for each level. Two digital signals: one with two signal levels and the other with four signal levels shown in Fig2.8 Fig2.8
  • 8. Q4.A digital signal has eight levels. How many bits are needed per level? Solution We calculate the number of bits from the formula Each signal level is represented by 3 bits. Most digital signals are aperiodic and thus, period or frequency is not appropriate. Two new terms, bit interval (instead of period) and bit rate (instead of frequency) are used to describe digital signals. The bit interval is the time required to send one single bit. The bit rate is the number of bit interval per second. This mean that the bit rate is the number of bits send in one second, usually expressed in bits per second (bps) as shown in Fig. 2.8.1. Fig.2.8.1 A digital signal can be considered as a signal with an infinite number of frequencies and transmission of digital requires a low-pass channel as shown in Fig. 2.8.2. On the other hand, transmission of analog signal requires band-pass channel shown in Fig. 2.8.3. Fig. 2.8.2 Low pass channel required for transmission of digital signal Fig. 2.8.3 Low pass channel required for transmission of analog signal
  • 9. Digital transmission has several advantages over analog transmission. That is why there is a shift towards digital transmission despite large analog base. Some of the advantages of digital transmission are highlighted below: Analog circuits require amplifiers, and each amplifier adds distortion and noise to the signal. In contrast, digital amplifiers regenerate an exact signal, eliminating cumulative errors. An incoming (analog) signal is sampled, its value is determined, and the node then generates a new signal from the bit value; the incoming signal is discarded. With analog circuits, intermediate nodes amplify the incoming signal, noise and all. Voice, data, video, etc. can all by carried by digital circuits. What about carrying digital signals over analog circuit? The modem example shows the difficulties in carrying digital over analog. A simple encoding method is to use constant voltage levels for a “1'' and a ``0''. Can lead to long periods where the voltage does not change. Easier to multiplex large channel capacities with digital. Easy to apply encryption to digital data. Better integration if all signals are in one form. Can integrate voice, video and digital data. 2.9Baseband channel A baseband channel or lowpass channel (or system, or network) is a communication channel that can transfer frequencies that are very near zero. Examples are serial cables and local area networks (LANs), as opposed to bandpass channels such as radio frequency channels and bandpass filtered wires of the analog telephone network. Frequency division multiplexing (FDM) allows an analog telephone wire to carry a baseband telephone call, concurrently as one or several carrier-modulated telephone calls. Baseband transmission of a digital signal that preserves the shape of the digital signal is possible only if we have a low-pass channel with an infinite or very wide bandwidth. If the available channel is a bandpass channel, we cannot send the digital signal directly to the channel; we need to convert the digital signal to an analog signal before transmission. Compare Baseband and Broadband Signals Depending on some type of typical signal formats or modulation schemes, a few terminologies evolved to classify different types of signals. So, we can have either a base band or broadband signalling. Base-band is defined as one that uses digital signalling, which is inserted in the transmission channel as voltage pulses. On the other hand, broadband systems are those, which use analog signalling to transmit information using a carrier of high frequency. In baseband LANs, the entire frequency spectrum of the medium is utilized for transmission and hence the frequency division multiplexing (discussed later) cannot be used. Signals inserted at a point propagates in both the directions, hence transmission is bi-directional. Baseband systems extend only to limited distances because at higher frequency, the attenuation of the signal is most
  • 10. pronounced and the pulses blur out, causing the large distance communication totally impractical. In baseband transmission, the required bandwidth is proportional to the bit rate; if we need to send bits faster, we need more bandwidth. Since broadband systems use analog signalling, frequency division multiplexing is possible, where the frequency spectrum of the cable is divided into several sections of bandwidth. These separate channels can support different types of signals of various frequency ranges to travel at the same instance. Unlike base-band, broadband is a unidirectional medium where the signal inserted into the media propagates in only one direction. Two data paths are required, which are connected at a point in the network called headend. All the stations transmit towards the headend on one path and the signals received at the headend are propagated through the second path. 3. Transmission media Transmission media can be defined as physical path between transmitter and receiver in a data transmission system. And it may be classified into two types as shown in Fig. 3.1 Guided: Transmission capacity depends critically on the medium, the length, and whether the medium is point-to-point or multipoint (e.g. LAN). Examples are co-axial cable, twisted pair, and optical fiber. For guided media, the medium is more important in determining the limitations of transmission. Unguided: provides a means for transmitting electro-magnetic signals but do not guide them. Example wireless transmission. In case of unguided media, the bandwidth of the signal produced by the transmitting antenna and the size of the antenna is more important than the medium. Signals at lower frequencies are omni-directional (propagate in all directions). For higher frequencies, focusing the signals into a directional beam is possible. These properties determine what kind of media one should use in a particular application. Fig. 3.1 Classes of Transmission Media 3.1 Guided transmission media Most commonly used guided transmission media are twisted-pair of cable, coaxial cable and optical fiber. 3.1.1 Twisted Pair cable In twisted pair technology, two copper wires are strung between two points: The two wires are typically ``twisted'' together in a helix to reduce interference between the two conductors as shown in Fig.3.1.1 Twisting decreases the cross-talk interference between adjacent pairs in a cable. Typically, a number of pairs are bundled together into a cable by wrapping them in a tough protective sheath.
  • 11. Can carry both analog and digital signals. Actually, they carry only analog signals. However, the ``analog'' signals can very closely correspond to the square waves representing bits, so we often think of them as carrying digital data. Data rates of several Mbps common. Spans distances of several kilometers. Data rate determined by wire thickness and length. In addition, shielding to eliminate interference from other wires impacts signal-to-noise ratio, and ultimately, the data rate. Good, low-cost communication. Indeed, many sites already have twisted pair installed in offices -- existing phone lines! Maximum transmission distance of 1 Km can be achieved for data rates up to 1 Mb/s. For analog voice signals, amplifiers are required about every 6 Km and for digital signals, repeaters are needed for about 2 Km. To reduce interference, the twisted pair can be shielded with metallic braid. This type of wire is known as Shielded Twisted-Pair (STP) and the other form is known as Unshielded Twisted-Pair (UTP). Application: • Twisted pair cable are used for voice and data in telephone lines in local loop • DSL line use the same kind of cable for high data rate. • LAN like 10BaseT and 100BaseT also use UTP cable Fig. 3.1.1 Twisted Pair cable UTP Connector:
  • 12. 3.1.2 Coaxial cable With ``coax'', the medium consists of a copper core surrounded by insulating material and a braided outer conductor as shown in Fig. 3.1.2. The term base band indicates digital transmission (as opposed to broadband analog). Physical connection consists of metal pin touching the copper core. There are two common ways to connect to a coaxial cable: With vampire taps, a metal pin is inserted into the copper core. A special tool drills a hole into the cable, removing a small section of the insulation, and a special connector is screwed into the hole. The tap makes contact with the copper core. With a T-junction, the cable is cut in half, and both halves connect to the T-junction. A T- connector is analogous to the signal splitters used to hook up multiple TVs to the same cable wire. Co-axial cable has superior frequency characteristics compared to twisted-pair and can be used for both analog and digital signaling. In baseband LAN, the data rates lies in the range of 1 KHz to 20 MHz over a distance in the range of 1 Km. Co-axial cables typically have a diameter of 3/8". Coaxial cables are used both for baseband and broadband communication. For broadband CATV application coaxial cable of 1/2" diameter and 75 Ω impedance is used. This cable offers bandwidths of 300 to 400 MHz facilitating high-speed data communication with low bit-error rate. In broadband signaling, signal propagates only in one direction, in contrast to propagation in both directions in baseband signaling. Broadband cabling uses either dual-cable scheme or single-cable scheme with a headend to facilitate flow of signal in one direction. Because of the shielded, concentric construction, co-axial cable is less susceptible to interference and cross talk than the twisted-pair. For long distance communication, repeaters are needed for every kilometer or so. Data rate depends on physical properties of cable, but 10 Mbps is typical. Fig. 3.1.2 Coaxial cable Application: Coaxial Cable could carry 10000 voice signal in analog telephone system and carry digital data upto 600Mbps Traditional cable TV network use the Coaxial cable Coaxial cable can give continues high data rate. Due to this high bandwidth it can also be used for Ethernet LAN. 3.1.3 Fiber Optics In fiber optic technology, the medium consists of a hair-width strand of silicon or glass, and the signal consists of pulses of light. For instance, a pulse of light means ``1'', lack of pulse means ``0''. It has a cylindrical shape and consists of three concentric sections: the core, the cladding, and the jacket as shown in Fig. 3.1.3. The core, innermost section consists of a single solid dielectric cylinder of diameter d1 and of refractive index n1. The core is surrounded by a solid dielectric cladding of refractive index n2 that is less than n1. As a consequence, the light is propagated through multiple total internal reflections. The core material is usually made of ultra pure fused silica or glass and the cladding is either made of glass or plastic. The cladding is
  • 13. surrounded by a jacket made of plastic. The jacket is used to protect against moisture, abrasion, crushing and other environmental hazards. Fig. 3.1.3 Optical Fiber Optical Fiber works in three different types of modes (or we can say that we have 3 types of communication using Optical fiber). Optical fibers are available in two varieties; Multi-Mode Fiber (MMF) and Single-Mode Fiber (SMF). For multi-mode fiber the core and cladding diameter lies in the range 50-200μm and 125-400μm, respectively. Where as in single-mode fiber, the core and cladding diameters lie in the range 8-12μm and 125μm, respectively. Single- mode fibers are also known as Mono-Mode Fiber. Moreover, both single-mode and multi-mode fibers can have two types; step index and graded index. In the former case the refractive index of the core is uniform throughout and at the core cladding boundary there is an abrupt change in refractive index. In the later case, the refractive index of the core varies radially from the centre to the core-cladding boundary from n1 to n2 in a linear manner. Fig. 3.1.4 shows the optical fiber transmission modes. Fig. 3.1.4 optical fiber transmission modes
  • 14. Advantages: Very high data rate, low error rate. 1000 Mbps (1 Gbps) over distances of kilometers common. Error rates are so low they are almost negligible. Difficult to tap, this makes it hard for unauthorized taps as well. This is responsible for higher reliability of this medium. Much thinner (per logical phone line) than existing copper circuits. Because of its thinness, phone companies can replace thick copper wiring with fibers having much more capacity for same volume. This is important because it means that aggregate phone capacity can be upgraded without the need for finding more physical space to hire the new cables. Not susceptible to electrical interference (lightning) or corrosion (rust). Greater repeater distance than coax. Disadvantages: Difficult to tap. It really is point-to-point technology. In contrast, tapping into coax is trivial. No special training or expensive tools or parts are required. One-way channel. Two fibers needed to get full duplex (both ways) communication. Fig. 3.1.5 Fiber-optic cable connectors 3.2 Unguided Transmission media Unguided media transport electromagnetic waves without using a physical conductor. This type of communication is often referred to as wireless communication. There are three types of unguided media is available as per Electromagnetic spectrum for wireless communication (Fig. 3.2.1). Fig. 3.2.1
  • 15. Unguided transmission is used when running a physical cable (either fiber or copper) between two end points is not possible. For example, running wires between buildings is probably not legal if the building is separated by a public street. Radio waves are used for multicast communications, such as radio and television, cord less phone and paging systems. For radio wave transmission omnidirectional antenna (Fig.3.2.2) is used for long distance broadcasting. Fig.3.2.2 omnidirectional antenna Infrared signals typically used for short distances (across the street or within same room). Infrared signals can be used for short-range communication in a closed area using line-of- sight propagation (Wave lengths from 1mm to 770nm).IrDA port in Wireless key board use infrared with 75Kbps to 4Mbps data rate. Microwave signals commonly used for longer distances (10's of km). Sender and receiver use some sort of dish antenna. Microwaves are used for unicast communication such as cellular telephones, satellite networks, and wireless LANs. Microwave signals needs unidirectional antenna (Parabolic dish antenna, Horn antenna) for line of sight communication (Fig. 3.2.3). Fig. 3.2.3 unidirectional antenna Propagation Method: There are three types of propagation namely Ground propagation, sky propagation and line of sight propagation (See Fig. 3.2.4)
  • 16. Fig. 3.2.4 Difficulties of Unguided Transmission: Weather interferes with signals. For instance, clouds, rain, lightning, etc. may adversely affect communication. Radio transmissions easy to tap. A big concern for companies worried about competitors stealing plans. Signals bouncing off of structures may lead to out-of-phase signals that the receiver must filter out. 3.2.1 Satellite Communication Satellite communication is based on ideas similar to those used for line-of-sight. A communication satellite is essentially a big microwave repeater or relay station in the sky. Microwave signals from a ground station is picked up by a transponder, amplifies the signal and rebroadcasts it in another frequency, which can be received by ground stations at long distances as shown in Fig. 3.2.5. To keep the satellite stationary with respect to the ground based stations, the satellite is placed in a geostationary orbit above the equator at an altitude of about 36,000 km. As the spacing between two satellites on the equatorial plane should not be closer than 40, there can be 360/4 = 90 communication satellites in the sky at a time. A satellite can be used for point-to-point communication between two ground-based stations or it can be used to broadcast a signal received from one station to many ground-based stations as shown in Fig. 3.2.6. Number of geo- synchronous satellites limited (about 90 total, to minimize interference). International agreements regulate how satellites are used, and how frequencies are allocated. Weather affects certain frequencies. Satellite transmission differs from terrestrial communication in another important way: One-way propagation delay is roughly 270 ms. In interactive terms, propagation delay alone inserts a 1 second delay between typing a character and receiving its echo.
  • 17. Fig. 3.2.5 Fig. 3.2.6. Use: Now-a-days communication satellites are not only used to handle telephone, telex and television traffic over long distances, but are used to support various internet based services such as e-mail, FTP, World Wide Web (WWW), etc. New types of services, based on communication satellites, are emerging. Comparison/contrast with other technologies: 1. Propagation delay very high. On LANs, for example, propagation time is in nanoseconds -- essentially negligible. 2. One of few alternatives to phone companies for long distances. 3. Uses broadcast technology over a wide area - everyone on earth could receive a message at the same time! 4. Easy to place unauthorized taps into signal. Satellites have recently fallen out of favor relative to fiber. However, fiber has one big disadvantage: no one has it coming into their house or building, whereas anyone can place an antenna on a roof and lease a satellite channel. 3.3 TRANSMISSION IMPAIRMENT When a signal is transmitted over a communication channel, it is subjected to different types of impairments because of imperfect characteristics of the channel. As a consequence, the received and the transmitted signals are not the same. Outcome of the impairments are manifested in two different ways in analog and digital signals. These impairments introduce random modifications in analog signals leading to distortion. On the other hand, in case of digital signals, the impairments lead to error in the bit values. The impairment can be broadly categorized into the following three types: Attenuation and attenuation distortion Delay distortion Noise
  • 18. 3.3.1 Attenuation Irrespective of whether a medium is guided or unguided, the strength of a signal falls off with distance. This is known as attenuation. In case of guided media, the attenuation is logarithmic, whereas in case of unguided media it is a more complex function of the distance and the material that constitutes the medium. An important concept in the field of data communications is the use of on unit known as decibel (dB). Fig. 3.3.1Attenuation Example: Let us consider a transmission line between points 1 and 2 and let the energy strength at point 2 is 1/10 of that of point 1. Then attenuation in dB is 10log10(1/10) = -10 dB. On the other hand, there is an amplifier between points 2 and 3. Let the power is 100 times at point 3 with respect to point 2. Then power gain in dB is 10log10(100/1) = 20 dB, which has a positive sign. The attenuation leads to several problems: Attenuation Distortion: If the strength of the signal is very low, the signal cannot be detected and interpreted properly at the receiving end. The signal strength should be sufficiently high so that the signal can be correctly detected by a receiver in presence of noise in the channel. Attenuation of all frequency components is not same. Some frequencies are passed without attenuation, some are weakened and some are blocked. This dependence of attenuation of a channel on the frequency of a signal leads to a new kind of distortion attenuation distortion. The effect of attenuation distortion can be reduced with the help of a suitable equalizer circuit, which is placed between the channel and the receiver. 3.3.2 Delay distortion The velocity of propagation of different frequency components of a signal are different in guided media. This leads to delay distortion in the signal. For a band limited signal, the velocity of propagation has been found to be maximum near the center frequency and lower on both sides of the edges of the frequency band. In case of analog signals, the received signal is distorted because of variable delay of different components. In case of digital signals, the problem is much more severe. Some frequency components of one bit position spill over to other bit positions,
  • 19. because of delay distortion. This leads to inter symbol interference, which restricts the maximum bit rate of transmission through a particular transmission medium. Fig.3.3.2 Delay Distortion 3.3.3 Noise As signal is transmitted through a channel, undesired signal in the form of noise gets mixed up with the signal, along with the distortion introduced by the transmission media. Noise can be categorised into the following four types: Thermal Noise Intermodulation Noise Cross talk Impulse Noise The thermal noise is due to thermal agitation of electrons in a conductor. It is distributed across the entire spectrum and that is why it is also known as white noise. Cross talk is a result of bunching several conductors together in a single cable. Signal carrying wires generate electromagnetic radiation, which is induced on other conductors because of close proximity of the conductors. While using telephone, it is a common experience to hear conversation of other people in the background. This is known as cross talk. Impulse noise is irregular pulses or noise spikes of short duration generated by phenomena like lightning, spark due to loose contact in electric circuits, etc. Impulse noise is a primary source of bit-errors in digital data communication. This kind of noise introduces burst errors. Nyquist Bit Rate The maximum rate at which data can be correctly communicated over a channel in presence of noise and distortion is known as its channel capacity. Consider first a noise-free channel of Bandwidth B. Based on Nyquist formulation it is known that given a bandwidth B of a channel, the maximum data rate that can be carried is 2B. This limitation arises due to the effect of inter symbol interference caused by the frequency components higher than B. If the signal consists of m discrete levels, then Nyquist theorem states: Maximum data rate C = 2 B log2 m bits/sec, Where C is known as the channel capacity, B is the bandwidth of the channel and m is the number of signal levels used. Baud Rate: The baud rate or signaling rate is defined as the number of distinct symbols transmitted per second, irrespective of the form of encoding. For baseband digital transmission m = 2. So, the maximum baud rate = 1/Element width (in Seconds) = 2B
  • 20. Bit Rate: The bit rate or information rate I is the actual equivalent number of bits transmitted per second. I = Baud Rate × Bits per Baud = Baud Rate × N = Baud Rate ×log2m For binary encoding, the bit rate and the baud rate are the same; i.e., I = Baud Rate. Example: Let us consider the telephone channel having bandwidth B = 4 kHz. Assuming there is no noise, determine channel capacity for the following encoding levels: (i) 2, and (ii) 128. Ans: (i) C = 2B = 2×4000 = 8 Kbits/s (ii) C = 2×4000×log2 128 = 8000×7 = 56 Kbits/s Effects of Noise When there is noise present in the medium, the limitations of both bandwidth and noise must be considered. A noise spike may cause a given level to be interpreted as a signal of greater level, if it is in positive phase or a smaller level, if it is negative phase. Noise becomes more problematic as the number of levels increases. Shannon Capacity (Noisy Channel) In presence of Gaussian band-limited white noise, Shannon-Hartley theorem gives the maximum data rate capacity C = B log2 (1 + S/N), where S and N are the signal and noise power, respectively, at the output of the channel. This theorem gives an upper bound of the data rate which can be reliably transmitted over a thermal- noise limited channel. Example: We can calculate the theoretical highest bit rate of a regular telephone line. A telephone line normally has a bandwidth of 3000. The signal-to-noise ratio is usually 3162. For this channel the capacity is calculated as This means that the highest bit rate for a telephone line is 34.860 kbps. If we want to send data faster than this, we can either increase the bandwidth of the line or improve the signal-to-noise ratio. Example: The signal-to-noise ratio is often given in decibels. Assume that SNRdB = 36 and the channel bandwidth is 2 MHz. The theoretical channel capacity can be calculated as Example: We have a channel with a 1-MHz bandwidth. The SNR for this channel is 63. What are the appropriate bit rate and signal level? Solution First, we use the Shannon formula to find the upper limit. The Shannon formula gives us 6 Mbps, the upper limit. For better performance we choose something lower, 4 Mbps, for example. Then we use the Nyquist formula to find the number of signal levels.
  • 21. 4. Transmission of Digital Signal There are two alternatives; the data can be either converted to digital or analog signal. Both the approaches have pros and cons. What to be used depends on the situation and the available bandwidth. Now, either form of data can be encoded into either form of signal. For digital signalling, the data source can be either analog or digital, which is encoded into digital signal, using different encoding techniques. The basis of analog signalling is a constant frequency signal known as a carrier signal, which is chosen to be compatible with the transmission media being used, so that it can traverse a long distance with minimum of attenuation and distortion. Data can be transmitted using these carrier signals by a process called modulation, where one or more fundamental parameters of the carrier wave, i.e. amplitude, frequency and phase are being modulated by the source data. The resulting signal, called modulated signal traverses the media, which is demodulated at the receiving end and the original signal is extracted. All the four possibilities are shown in Fig. 4.1. Fig. 4.1 various approaches for conversion of data to signal 4.1 Line coding characteristics The first approach converts digital data to digital signal, known as line coding, as shown in Fig. 4.1.1 Important parameters those characteristics line coding techniques are mentioned below. Fig. 4.1.1 Line coding and decoding No of signal levels: This refers to the number values allowed in a signal, known as signal levels, to represent data. Figure 4.1.2 shows signal levels to represent binary data.
  • 22. Bit rate versus Baud rate: The bit rate represents the number of bits sent per second, whereas the baud rate defines the number of signal elements per second in the signal. Depending on the encoding technique used, baud rate may be more than or less than the data rate. DC components: After line coding, the signal may have zero frequency component in the spectrum of the signal, which is known as the direct-current (DC) component. DC component in a signal is not desirable because the DC component does not pass through some components of a communication system such as a transformer. This leads to distortion of the signal and may create error at the output. The DC component also results in unwanted energy loss on the line. Signal Spectrum: Different encoding of data leads to different spectrum of the signal. It is necessary to use suitable encoding technique to match with the medium so that the signal suffers minimum attenuation and distortion as it is transmitted through a medium. Synchronization: To interpret the received signal correctly, the bit interval of the receiver should be exactly same or within certain limit of that of the transmitter. Any mismatch between the two may lead wrong interpretation of the received signal. Usually, clock is generated and synchronized from the received signal with the help of a special hardware known as Phase Lock Loop (PLL). Cost of Implementation: It is desirable to keep the encoding technique simple enough such that it does not incur high cost of implementation. Figure 4.1.2 Signal element versus data element 4.1.2 Line Coding Techniques Line coding techniques can be broadly divided into three broad categories: Unipolar, Polar and Bipolar, as shown in Fig. 4.1.3 Fig. 4.1.3
  • 23. Unipolar: In unipolar encoding technique, only two voltage levels are used. The polarity of a pulse refers to whether it is positive or negative. Unipolar encoding use only one polarity means only one voltage level. In this encoding approach, the bit rate same as data rate. Disadvantage: Lack of synchronization (long sequence of 0s and 1s means no change of signal which can alert potential synchronization problem at receiver end) Existence of DC component (average amplitude of unipolar encoded signal is nonzero.) Polar: Polar encoding technique uses two voltage levels – one positive and the other one negative. Four different encoding schemes shown in Figure 4.1.4 under this category discussed below: Figure 4.1.4 Encoding Schemes under polar category In NRZ encoding the value of the signal is either positive or negative. Two types of NRZ, one is NRZ-L and another one is NRZ-I. In NRZ-L, the level of the signal depends on the type of the bit. Positive voltage means 0 and negative voltage means 1 but long sequence of 0s and 1s with no change of signal may create Synchronization problem if clock of sender and receiver is not synchronized. In NRZ-I inversion of the voltage level represents a 1 bit. It is the transition between a positive and negative voltage, not the voltage itself that represent a 1 bit. A 0 bit represent by no change. NRZ-I is superior to NRZ-L The advantages of NRZ coding are: Detecting a transition in presence of noise is more reliable than to compare a value to a threshold. NRZ codes are easy to engineer and it makes efficient use of bandwidth. The spectrum of the NRZ-L and NRZ-I signals are shown in Fig. 4.1.5. It may be noted that most of the energy is concentrated between 0 and half the bit rate. The main limitations are the presence of a dc component and the lack of synchronization capability. When there is long sequence of 0’s or 1’s, the receiving side will fail to regenerate the clock and synchronization between the transmitter and receiver clocks will fail. NRZ-L and NRZ-I both have an average signal rate of N/2 Bd.
  • 24. Fig. 4.1.5. Polar NRZ-L and NRZ-I schemes Return to zero (RZ) uses three values Positive, Negative and Zero. In RZ signal changes not between bit but during each bit. Like NRZ-L a positive voltage means 1 and negative voltage means 0 but unlike NRZ-L, half way through each bit interval, the signal return to zero.1 bit is represented by positive to zero and 0 bit by negative to zero (Fig.4.1.6) Advantage: Bit rate is double than that of data rate No dc component Good synchronization Main limitation is the increase in bandwidth Fig.4.1.6 Polar RZ scheme Biphase: To overcome the limitations of NRZ encoding, biphase encoding techniques can be adopted. Manchester and differential Manchester Coding are the two common Biphase techniques in use, as shown in Fig.4.1.7. Manchester encoding uses an inversion in the middle of each bit for both synchronization and bit representation. A negative to Positive transition represent 1 and a positive to negative transition represent 0. Manchester encoding achieves the same level of Synchronization as RZ but only two level of amplitude. In differential Manchester encoding, the inversion at the middle of the bit interval is used for synchronization but the presence or Absence of additional transition at the beginning of the interval is used to identify the bit. A transition means binary zero and no Transition means 1.
  • 25. Fig.4.1.7 Polar biphase: Manchester and differential Manchester schemes Advantage: Two levels No DC component Good synchronization Higher bandwidth due to doubling of bit rate with respect to data rate The bandwidth required for biphase techniques are greater than that of NRZ techniques, but due to the predictable transition during each bit time, the receiver can synchronize properly on that transition. A Manchester code is now very popular and has been specified for the IEEE 802.3 standard for base band coaxial cables and twisted pair CSMA/CD bus LANs. Bipolar Encoding: Bipolar used three voltage levesl. Unlike RZ zero level is used to represent a 0 and a binary 1’s are represented by alternating positive and negative voltages, as shown in Fig 4.1.8. Fig 4.1.8. Bipolar schemes: AMI (Alternate mark inversion) and pseudoternary The common bipolar encoding scheme is known as Alternate Mark inversion (AMI). Bipolar n- zeros substitution (BnZS) is used to avoid synchronization problem if there is consecutive n no.s of 0 for a long distance transmission. Pseudoternary encoding: This encoding scheme is same as AMI but alternating positive and negative pulses occur for binary 0 instead of binary 1. Key characteristics are: Three levels No DC component Loss of synchronization for long sequence of 0’s Lesser bandwidth Frequency spectrum of different encoding scheme is shown in Fig. 4.1.9.
  • 26. Fig. 4.1.9 Frequency spectrum of different encoding scheme 5. Analog Data, Digital Signals Digital signal is superior to an analog signal. The tendency today is to change an analog signal to digital data. Analog data such as voice, video and music can be converted into digital signal communication through transmission media. This allows the use of modern digital transmission and switching equipment’s. The device used for conversion of analog data to digital signal and vice versa is called a coder (coder-decoder). There are two basic approaches: Pulse Code Modulation (PCM) Delta Modulation (DM) 5.1 Pulse Code Modulation (PCM) Pulse Code Modulation involves the following three basic steps as shown in Fig. 5.1 Sampling – PAM Quantization Line coding Fig. 5.1 Basic steps of pulse code modulation Sampling: This process is based on Shannon’s sampling theorem. Numbers of samples of the signal are taken at regular intervals, at a rate higher than twice the highest significant signal frequency. This basic step is known as Pulse Amplitude Modulation (PAM). For example, during the sampling of voice data, in the frequency range 300 to 4000 Hz, 8000 samples per second are sufficient for the coding. Quantization: The PAM samples are quantized and approximated to n-bit integer by using analog-to-digital converter. For example, if n = 4, then there are 16 (=24) levels available for
  • 27. approximating the PAM signals. This process introduces an error are known as quantization error. Quantization error depends on step size. Use of uniform step size leads to poorer S/N ratio for small amplitude signals. With the constraint of a fixed number of levels, the situation can be improved using variable step size. The effect of quantization error can be minimized by using a technique known as companding. Line coding: The digital data thus obtained can be encoded into one of digital signals At the receiving end, an Digital-to-Analog converter followed by a low-pass filter can be used to get back the analog signal as shown in Fig. 5.2 Fig. 5.2 Conversion of digital to analog signal Limitations: The PCM signal has high bandwidth. For example, let us consider voice signal as input with bandwidth of 4 kHz. Based on Nyquist theorem, the Sampling frequency should be 8 kHz. If an 8-bit ADC is used for conversion to digital data, it generates data rate of 64 Kbps. Therefore, to send voice signal a data rate of 64 Kbps is required. To overcome this problem a technique known as Differential PCM (DPCM) can be used. Why do you need encoding of data before sending over a medium? Ans: Suitable encoding of data is required in order to transmit signal with minimum attenuation and optimize the use of transmission media in terms of data rate and error rate. Distinguish between PAM and PCM signals? Ans: In order to convert Analog data to Digital signal, initially sampling is done on the analog data by using Sample & Hold (S/H) circuit. The output of the S/H circuit is known as PAM (Pulse Amplitude Modulated) signal. The PAM signal is then converted to PCM (Pulse Code Modulated) data by using a Analog-to-Digital (A/D) converter circuit. This digital data (PCM) is passed through an encoder to generate PCM signal. Between RZ and NRZ encoding techniques, which requires higher bandwidth and why? Ans: RZ encoding requires more bandwidth, as it requires two signal changes to encode one bit. What is quantization error? How can it be reduced? Ans: To convert analog signal to digital signal, the analog signal is first sampled and each of these analog samples must be assigned a binary code. In other words, each sample is approximated by being quantized into some binary codes. As the quantized values are only approximations, it is impossible to recover the original signal exactly. Error due to this quantization is known as quantization error. Quantization error can be minimized by using non-linear encoding. How does Manchester encoding differ from differential Manchester encoding? Ans: In the Manchester encoding, a low-to-high transition represents a 1, and a high-to-low transition represents a 0. There is a transition at the middle of each bit period, which serves the purpose of synchronization and encoding of data. In Differential Manchester, the encoding of a 0 is represented by the presence of a transition at the beginning of a bit period, and a 1 is represented by the absence of a transition at the beginning of a bit period. In this case, the mid bit transition is only used for synchronization.
  • 28. 5.1 TRANSMISSION MODES The transmission of binary data across a link can be accomplished in either parallel or serial mode. In parallel mode, multiple bits are sent with each clock tick. In serial mode, 1 bit is sent with each clock tick. While there is only one way to send parallel data, there are three subclasses of serial transmission: asynchronous, synchronous, and isochronous. Parallel transmission Serial transmission Asynchronous transmission In asynchronous transmission, we send 1 start bit (0) at the beginning and 1 or more stop bits (1s) at the end of each byte. There may be a gap between each byte. Asynchronous here means “asynchronous at the byte level,” but the bits are still synchronized; their durations are the same. Asynchronous transmission
  • 29. Asynchronous transmission In synchronous transmission, we send bits one after another without start or stop bits or gaps. It is the responsibility of the receiver to group the bits. Synchronous transmission 6. Analog data to analog signal Although transmission of digital signal is preferred, it is not always feasible to transmit in digital form because it requires channel of high bandwidth having low pass characteristics. On the other hand, an analog transmission requires lower bandwidth having band pass characteristics. The process involved in analog transmission is known as modulation, which requires manipulation of one or more of the parameters of the carrier that characterizes the analog signal. Modulation is needed if the medium is bandpass in nature or if only a bandpass channel is available to us. Some of the important advantages of modulation are summarized below: Frequency translation: Modulation translates the signal from one region of frequency domain to another region. This helps to transmit the modulated signal with minimum attenuation through a particular medium. Practical size of antenna: Modulation translates baseband signal to higher frequency, which can be transmitted through a bandpass channel using an antenna of smaller size. Narrowbanding: As modulation translates a signal from lower frequency domain to higher frequency domain, the ratio between highest to lowest frequency of the modulated signal becomes close to 1. Multiplexing: Different base band signals originating from different sources can be translated to different frequency ranges. This allows transmission of different signals through the same medium using frequency division multiplexing (FDM) The modulation technique can be broadly divided into two basic categories; Amplitude modulation and Angle modulation. The Angle modulation can be further divided into two more categories; Frequency and Phase modulations as shown in Fig. 6.1 Fig. 6.1 Categories of modulation techniques
  • 30. 6.1 Amplitude Modulation (AM) This is the simplest form of modulation where the amplitude of the carrier wave is modulated by the analog signal known as the modulating signal. A signal to be modulated, a carrier and the modulated signal are shown in Fig. 6.1.1 Fig. 6.1.1 Amplitude modulation Frequency Spectrum: Frequency spectrum of the sinusoidal AM signal can be represented by s(t) = Ec [1 + m cos 2πfmt] cos 2πfct = Ec cos 2πfct + m Ec cos 2πfmt cos 2πfct = Ec cos 2πfct + m/2 Ec cos 2π(fc – fm)t + m/2 Ec cos 2π(fc + fm)t It may be noted that there are three frequency components; Carrier wave of amplitude Ec, Lower sideband of amplitude m/2 Ec and Higher sideband of amplitude m/2 Ec, as shown in Fig. 6.1.2. Fig. 6.1.2 Spectrum of a modulated signal The total bandwidth required for AM can be determined from the bandwidth of the audio signal: BAM = 2B. 6.2 Frequency modulation In FM transmission, the frequency of the carrier signal is modulated to follow the changing voltage level (amplitude) of the modulating signal. The peak amplitude and phase of the carrier signal remain constant but as the amplitude of the information signal changes, the frequency of the carrier signal changes correspondingly. FM is normally implemented using voltage controlled oscillator. Fig. 6.2.1 shows the relationship of the modulating signal, the carrier signal and the resultant FM signal.
  • 31. The total bandwidth required for FM can be determined from the bandwidth of the audio signal: BFM = 2(1 + β)B. β is the factor depends on modulation technique. Fig. 6.2.1 Frequency modulation 6.3 Phase modulation In PM transmission, the Phase of the carrier signal is modulated to follow the changing voltage level (amplitude) of the modulating signal. The peak amplitude and frequency of the carrier signal remain constant but as the amplitude of the information signal changes, the phase of the carrier signal changes correspondingly. PM is normally implemented using voltage controlled oscillator along with a derivative. Fig. 6.3.1 shows the relationship of the modulating signal, the carrier signal and the resultant FM signal. In PM the instantaneous change in the carrier frequency is proportional to the derivative of the amplitude of the modulating signal. Fig. 6.3.1 Phase modulation The total bandwidth required for PM can be determined from the bandwidth and maximum amplitude of the modulating signal: BPM = 2(1 + β)B. β is the factor depends on modulation technique. Q. Between AM and FM, which one gives better noise immunity? Ans: FM is more immune to noise than AM, since the power of transmission is independent of the modulation index. 7. Digital-to-analog conversion Quite often we have to send digital data through analog transmission media such as a telephone network. In such situations it is essential to convert digital data to analog signal. Basic approach
  • 32. is shown in Fig. 7.1 This conversion is accomplished with the help of special devices such as modem (modulator-demodulator) that converts digital data to analog signal and vice versa. Fig. 7.1 Conversion of digital data to analog signal Since modulation involves operations on one or more of the three characteristics of the carrier signal, namely amplitude, frequency and phase, three basic encoding or modulation techniques are available for conversion of digital data to analog signals as shown in Fig. 7.1.2. The three techniques, referred to as amplitude shift keying (ASK), frequency shift keying (FSK) and phase shift keying (PSK). There are many situations where ASK and PSK techniques are combined together leading to a modulation technique known as Quardrature Amplitude Modulation (QAM). Fig. 7.2 Types of digital-to-analog modulation 7.1 Amplitude-shift keying (ASK) In amplitude Shift keying, logic levels are represented by different amplitudes of signals. Usually, one amplitude is zero for logic digital logic zero while is logic 1 represented by the actual amplitudes of some sine wave signal. Fig 7.1.1 shows the expected waveforms in ASK. Fig. 7.1.1 Amplitude-shift keying (ASK)
  • 33. Both the frequency and phase remain constant while the amplitude changes. The bandwidth requirement of ASK signal is B= (1+d)S, where S is the signal rate and B is the bandwidth and the value of d is between 0 and 1. This method is very much susceptible to noise and sudden gain changes and hence it is considered as an inefficient modulation technique. 7.2 Frequency-Shift keying (FSK) In this case two binary values are represented carrier frequency. In FSK two carrier frequencies f1 and f2 are used to represent 1 and 0 as shown in the above figure. Here s(t) = A cos 2πfc1t for binary 1 And s(t) = A cos 2πfc2t for binary 0 This method is less susceptible to errors than ASK. It is mainly used in higher frequency radio transmission. Frequency spectrum: FSK may be considered as a combination of two ASK spectra centered around fc1 and fc2, which requires higher bandwidth. The bandwidth = (fc2 - fc1) + Nb. Fig7.2.1 Frequency-Shift keying 7.3. Phase shift Keying (PSK) In this method, the phase of the carrier signal is shifted by the modulated signal with the phase measured relative to the previous bit interval. The binary 0 is represented by sending a signal of the same phase as the preceding one and 1 is represented by sending the signal with an opposite phase to the previous one as shown in Fig. 7.3.1. Fig. 7.3.1 Phase-shift keying In 2-PSK the carrier is the carrier is used to present 0 and 1. s(t) = A cos (2πfct+π) for binary 1 s(t) = A cos (2πfct) for binary 0 The representation is called constellation diagram, which provides a graphical representation of the complex envelope of each possible symbol state. The x-axis of a constellation diagram represents the in-phase component of the complex envelope, and the y-axis represents the quadrature component of the complex envelope. The distance between signals on a constellation diagram indicates how different the modulation waveforms are, and how well a receiver can differentiate between all possible symbols in presence of noise.
  • 34. Fig. 7.3.1 QPSK: For more efficient use of bandwidth Quadrature Phase-shift keying (QPSK) can be used where In 8-PSK phase is shifted by 450 as shown in figure.