SlideShare ist ein Scribd-Unternehmen logo
1 von 8
SIriben Somboon


       Olympic Games are held every 4 years. The heights for men’s high jump in the Olympic
Games are collected from 1896 to 2008. The aim if this task is to consider the winning height for the
men’s high jump in the Olympic Games.

Table 1: A data showing the heights achieved by for men’s high jumped by the gold medalists at
Olympic Games from 1932 to 1980.

Year   1932        1936     1948    1952     1956     1960     1964    1968     1972     1976    1980
Number 1           2        5       6        7        8        9       10       11       12      13
Height 197         203      198     204      212      216      218     224      223      225     236
(cm)


The heights are collected from year 1932 – 1980 for the first set of data. Since the Olympic Games
are held every 4 years, so every 4 years, the number is increasing by 1. Let year 1932 be number 1.
Example is from year 1932 to year 1936, the number is 1 for year 1932 and 2 for year 1936. Olympic
Games were not held in 1940 and 1944 because there were wars during that time (WW2). So the
number skipped from 2 to 5 from year 1936 to 1948.


Figure 1 : A diagram showing the height for men’s high jump in Olympic Games from 1932 to 1980
(number from 1 to 13). X-axis is the number and y-axis is the height in cm that the gold medalists
achieved in each Olympic Games.
According to the figure 1, I observe that the numbers are increasing between each Olympic Games
(except from year 1936 to 1948). The amount that the heights for men’s high jump in the Olympic
Games that are increasing each year is quite constant, so I use a linear line to find the equation of
heights for men’s high jump for Olympic Games. With many points, I have to choose 2 points that
can represent my graph if I want to find the linear equation for this data. I wouldn’t get an accurate
result for this data, so I decided to use a median-median line.

I use a median-median line to find the equation of the line. The equation for median-median line is
y = ax + b. Where “a” = the slope of the median from the data; “b” = y-intercept for the data; “x” =
the number (the year); and “y” = height that the gold medalist achieved in that Olympic Game. The
numbers are divided into 3 groups; in this case 4/3/4 because there are 11 numbers and 11 is not
divisible by 3. The first and the last group must have the same size. Then I find the median for each
group (both the number and the height).

Table 2: Finding median for first group.
Number          1        2          5       6
Height (cm)     197      203        198     204


Median for number =          = 3.5


Median for height =              = 200.5


Table 3: Finding median for middle group.
Number          7        8        9
Height (cm)     212      216      218

Median for middle group is (8,216).

Table 4: Finding median for last group.
Number          10       11        12       13
Height (cm)     224      223       225      236


Median for number =            = 11.5

Median for height =              = 224.5

The median for the first group is 3.5 for number and 200.5 for height (3.5, 200.5). The median for
the middle group is (8, 216). The median for the last group is (11.5, 224.5). To find “a” for the
median-median line equation, I find the slope of the median I got from last group and the first group.
To get “b” for the median-median line equation, I need to find the y-intercept of the line.
To find “a”

           =               =    =3

  “a” =

  To find “b”

                                  =                                        =              =
  190.67

   “b” = 190.67
The median-median line equation is y = 3x + 190.67.Then I graph the line by using my equation that I
found.


Figure 2: A diagram showing the height for men’s high jump in Olympic Games from 1932 to 1980.
The slope of the line Is 3 and the y-intercept is 190.7. This shows that every 4 year (every Olympic
Games) the height for men’s high jump increases by 3 cm and at the year 1932, the height that
should be achieved by the gold medalist is 190.7 cm.
Figure 3: A diagram showing the height for men’s high jump in Olympic Games from 1932 to 1980.
The black line is the line of best fit (linear line). The gray line is from the equation that I got by using
median-median line equation. The slope of the black line is 3.02 and the y-intercept for the black line
is 191.1 cm. This shows that every 4 year (every Olympic Games) the height for men’s high jump
increases by 3.02 cm and at the year 1932, the height that should be achieved by gold medalist is
191.1 cm. The slope of the line Is 3 and the y-intercept is 190.7 cm. This shows that every 4 year
(every Olympic Games) the height for men’s high jump increases by 3 cm and at the year 1932, the
height that should be achieved by the gold medalist is 190.7 cm.

Then to find the differences between the two lines, I use the percent error from my median-median
equation and the line of best fit when I used technology to find the line for this set of data. My
median-median line and the line of best fit that the computer found has the percent error of 0.67%.
The limitation for my model is as time passes, the percent error for my model and the computer
model would be bigger because the slope and y-intercept is higher for the computer model than my
model.

To find the percent error:

        x 100 =         x 100 = 0.67%
Another function that models this data is quadratic equation. I use quadratic equation because the
height for men’s high jump in the Olympic Games is increasing for most of the Olympic Games.


Figure 4: A diagram showing the height for men’s high jump in Olympic Games from 1932 to 1980.
The gray line is the equation median-median line. The black line is a quadratic function that models
the data. The slope of the line Is 3 and the y-intercept is 190.7. This shows that every 4 year (every
Olympic Games) the height for men’s high jump increases by 3 cm and at the year 1932, the height
that should be achieved by the gold medalist is 190.7 cm. The “a” value for the black line is 0.1807,
“b” is 0.5004 and “c” is 197.3. This shows that according to the black curve, at year 1932, the height
that should be achieved by the gold medalists is 197.3 cm.

The differences between the median-median line and the quadratic curve are the y-intercept is
different and the quadratic line is closer to the points than the median-median line. The y-intercept
for the median-median line is 191.1 and the y-intercept for the quadratic line is 197.3.The quadratic
line is closer to the points than the median-median line because the median-median line has the R2
of 0.883 and the quadratic line has the R2 of 0.924. This shows that the quadratic line is closer to the
points than the median-median line. The quadratic line also has a limit from 1           13 because if
there is no limit for the quadratic line, in a few decades, the height that should be achieved by gold
medalists at the Olympic Games would be too high.
If the game is held in 1940 and 1944, I use both the median-median line and the quadratic line to
estimate the winning heights that would have been if the games are held.

Table 5: A table showing the heights estimation for men’s high jump if the game is held in 1940 and
1944. The estimation heights for men’s high jump in year 1940 and 1944 are calculated by using
median-median line and quadratic line.

Year   Number                                         Height (cm)
                 Median-median line      Quadratic line             Height       % Height difference
                 Y = 3.02x + 191.1       Y = 0.1807x2 + 0.5004x +   difference   (compare to
                                         197.3                                   Quadratic line)
1940      3      200.16                  200.43                     0.27         0.13%
1944      4      203.10                  202.19                     0.91         0.45%

The estimated winning heights if the Olympic Game in 1940 is 200.4 cm and 202.2 cm in year 1994.
The quadratic line is being used instead of median-median line because the quadratic line is closer to
the points in the data than median-median line. Also when I plugged 6 for “x” (year 1956) in both
equations, for the median-median line, I got 209.2 cm; for quadratic line, I got 206.8 cm. This shows
that the quadratic line give more similar number to the data than the median-median line.

Table 6: A table showing the heights estimation for men’s high jump if the game is held in 1984 and
2016. The estimation heights for men’s high jump in year 1940 and 1944 are calculated by using
median-median line and quadratic line.

Year   Number                                         Height (cm)
                 Median-median line      Quadratic line             Height       % Height difference
                 Y = 3.02x + 191.1       Y = 0.1807x2 + 0.5004x +   difference   (compare to
                                         197.3                                   Quadratic line)
1984      14     233.38                  239.72                     6.34         2.72%
2016      20     251.5                   279.59                     28.09        11.17%

By using the median-median line, in 1984, the predicted height achieved by gold medalists in the
Olympic Games is 233.4 cm. In 2016, the predicted height achieved by gold medalists in the Olympic
Games is 251.5 cm. By using the quadratic line, in 1984, the predicted height achieved by gold
medalists in the Olympic Games is 239.7 cm. In 2016, the predicted height achieved by gold
medalists in the Olympic Games is 279.6 cm. When I used the quadratic line to estimate the height
that gold medalists can achieve in 2016, the answer comes out to be 279.6 cm which is quite high for
me. In 32 years (8 Olympic Games), the height that gold medalists can achieve from 1984 to 2016
increases by 18.1 cm by using median-median line. The height that gold medalists can achieve from
1984 to 2016 increase by 39.9 cm by using quadratic line. There is also a higher percentage height
difference between the median-median line and the quadratic line in year 2016 than in year 1984.
This means that one line (the quadratic line) is increasing a lot more than another line (median-
median line).
Table 7: A data showing the heights achieved by for men’s high jump by the gold medalists at
Olympic Games from other Olympic Games since 1896.

Year   1896       1904    1908     1912   1920    1928    1984    1988     1992    1996    2000    2004     2008
Number -9         -7      -6       -5     -3      -1      14      15       16      17      18      19       20
Height 190        180     191      193    193     194     235     238      234     239     235     236      236
(cm)


Table 8: A table showing the estimated heights achieved for men’s high jump by gold medalists in
the Olympic Games since 1896 and the collected data for men’s high jumped by gold medalists in
Olympic Games.

                                                           Height difference from the         % difference
 Year                            Height (cm)                      collected data        from the collected data
         Number                  Median-                    Median-                      Median-
                    Collected    median      Quadratic      median          Quadratic    median       Quadratic
                      data       Model        Model          Model            Model       Model         Model
 1896       -9        190        163.92       207.43          26.08           -17.43     15.91%         8.40%
 1904       -7        180        169.96       202.65          10.04           -22.65      5.91%        11.18%
 1908       -6        191        172.98       200.80          18.02            -9.80     10.42%         4.88%
 1912       -5        193          176        199.32           17              -6.32      9.66%         3.17%
 1920       -3        193        182.04       197.43          10.96            -4.43      6.02%         2.24%
 1928       -1        194        188.08       196.98          5.92             -2.98      3.15%         1.51%
 1984       14        235        233.38       239.72          1.62             -4.72      0.69%         1.97%
 1988       15        238         236.4       245.46           1.6             -7.46      0.69%         3.04%
 1992       16        234        239.42       251.57          -5.42           -17.57      2.26%         6.98%
 1996       17        239        242.44       258.03          -3.44           -19.03      1.42%         7.37%
 2000       18        235        245.46       264.85         -10.46           -29.85      4.26%        11.27%
 2004       19        236        248.48       272.04         -12.48           -36.04      5.02%        13.25%
 2008       20        236         251.5       279.59          -15.5           -43.59      6.16%        15.59%

Median-median function and quadratic function are being used to estimate the heights. The heights
are then compared to the collected data to find the percentage difference estimated data is from
the collected data.

According to table 8, my models (both median-median line and quadratic line) do not fit well when
additional data are being added because the percentage difference the estimated data are from the
collected data is quite big. The height achieved for men’s high jump level off at around 236, it does
not keep on going up, so both of the equations do not fit the additional data because both of the
equations keep on going up.
Figure 5: A diagram showing the height for men’s high jump in Olympic Games since 1896. This line
is a logarithm line where “a” = 54.19 and “b” = 720.

I used a logarithm curve because first the height achieved by the gold medalists in the Olympic
Games for men’s high jump kept on increasing, but since year 1980, there is almost no change in the
heights achieved by gold medalists in the Olympic Games. The overall trend from 1896 to 2008 is the
heights achieved by the gold medalists in the Olympic Games increase until year 1980. These
fluctuations happen because technologies improved, so people have more resources to train with
(so that they could jump higher). There is almost no change in the height achieved by the gold
medalists in the Olympic Games for men’s high jump because technologies have increased the
resources for high jumpers to train to a certain level.

I would modify my graphs (from median-median and quadratic curve) to logarithm because the
height achieved by gold medalists in the Olympic Games did not increase since 1980, so I cannot use
equation that would keep on going up. It is also impossible for human to keep on increasing the
height achieved by the gold medalists in the Olympic Games for men’s high jump.

Weitere ähnliche Inhalte

Was ist angesagt?

Projectionofpointsandlines (1)
Projectionofpointsandlines (1)Projectionofpointsandlines (1)
Projectionofpointsandlines (1)MSTAMIL21
 
03 cameras & their geometry
03 cameras & their geometry03 cameras & their geometry
03 cameras & their geometrySarhat Adam
 
2 Superelevation and Spiral Curve ( by Malyar Talash, Highway Design Manager/...
2 Superelevation and Spiral Curve ( by Malyar Talash, Highway Design Manager/...2 Superelevation and Spiral Curve ( by Malyar Talash, Highway Design Manager/...
2 Superelevation and Spiral Curve ( by Malyar Talash, Highway Design Manager/...Malyar Talash
 
Indirect contouring 31 35 (IIUI)
Indirect contouring 31 35 (IIUI)Indirect contouring 31 35 (IIUI)
Indirect contouring 31 35 (IIUI)civilengineerf14
 
Projection of plane
Projection of planeProjection of plane
Projection of planeSoham Gajjar
 
orthographic projection & auxiliary view
orthographic projection & auxiliary vieworthographic projection & auxiliary view
orthographic projection & auxiliary viewYasir Hashmi
 
Theodolite seting up.pdf
Theodolite seting up.pdfTheodolite seting up.pdf
Theodolite seting up.pdfAlwandBarzani
 
CityGML extension for BIM and IFC
CityGML extension for BIM and IFCCityGML extension for BIM and IFC
CityGML extension for BIM and IFCLéon Berlo
 
Levelling report-1
Levelling report-1Levelling report-1
Levelling report-1tfkc1212
 
Engineeringdrawingi 090303074237-phpapp01
Engineeringdrawingi 090303074237-phpapp01Engineeringdrawingi 090303074237-phpapp01
Engineeringdrawingi 090303074237-phpapp01Christopher Todd
 
Chapter 14 pictorials - 2010
Chapter 14   pictorials - 2010Chapter 14   pictorials - 2010
Chapter 14 pictorials - 2010Shelly Wilke
 
engineering survey 1 report levelling
engineering survey 1 report levellingengineering survey 1 report levelling
engineering survey 1 report levellingYASMINE HASLAN
 
Chapter 4 dimensioning - 2010
Chapter 4   dimensioning - 2010Chapter 4   dimensioning - 2010
Chapter 4 dimensioning - 2010Shelly Wilke
 
Trigonometric levelling jithin
Trigonometric levelling   jithinTrigonometric levelling   jithin
Trigonometric levelling jithinJithin Jose
 

Was ist angesagt? (17)

Projectionofpointsandlines (1)
Projectionofpointsandlines (1)Projectionofpointsandlines (1)
Projectionofpointsandlines (1)
 
03 cameras & their geometry
03 cameras & their geometry03 cameras & their geometry
03 cameras & their geometry
 
2 Superelevation and Spiral Curve ( by Malyar Talash, Highway Design Manager/...
2 Superelevation and Spiral Curve ( by Malyar Talash, Highway Design Manager/...2 Superelevation and Spiral Curve ( by Malyar Talash, Highway Design Manager/...
2 Superelevation and Spiral Curve ( by Malyar Talash, Highway Design Manager/...
 
Indirect contouring 31 35 (IIUI)
Indirect contouring 31 35 (IIUI)Indirect contouring 31 35 (IIUI)
Indirect contouring 31 35 (IIUI)
 
Projection of plane
Projection of planeProjection of plane
Projection of plane
 
orthographic projection & auxiliary view
orthographic projection & auxiliary vieworthographic projection & auxiliary view
orthographic projection & auxiliary view
 
Theodolite seting up.pdf
Theodolite seting up.pdfTheodolite seting up.pdf
Theodolite seting up.pdf
 
CityGML extension for BIM and IFC
CityGML extension for BIM and IFCCityGML extension for BIM and IFC
CityGML extension for BIM and IFC
 
Simple circular curve
Simple circular curveSimple circular curve
Simple circular curve
 
Levelling report-1
Levelling report-1Levelling report-1
Levelling report-1
 
Engineeringdrawingi 090303074237-phpapp01
Engineeringdrawingi 090303074237-phpapp01Engineeringdrawingi 090303074237-phpapp01
Engineeringdrawingi 090303074237-phpapp01
 
Vertical Alignment
Vertical Alignment Vertical Alignment
Vertical Alignment
 
Chapter 14 pictorials - 2010
Chapter 14   pictorials - 2010Chapter 14   pictorials - 2010
Chapter 14 pictorials - 2010
 
engineering survey 1 report levelling
engineering survey 1 report levellingengineering survey 1 report levelling
engineering survey 1 report levelling
 
Chapter 4 dimensioning - 2010
Chapter 4   dimensioning - 2010Chapter 4   dimensioning - 2010
Chapter 4 dimensioning - 2010
 
Master thesis
Master thesisMaster thesis
Master thesis
 
Trigonometric levelling jithin
Trigonometric levelling   jithinTrigonometric levelling   jithin
Trigonometric levelling jithin
 

Andere mochten auch

Ib math studies internal assessment final draft
Ib math studies internal assessment final draftIb math studies internal assessment final draft
Ib math studies internal assessment final draftBilly Egg
 
Math IA
Math IAMath IA
Math IA_kong
 
IB Math Studies IA
IB Math Studies IAIB Math Studies IA
IB Math Studies IAabelkoster
 
Math Statistics IA December 2010
Math Statistics IA December 2010Math Statistics IA December 2010
Math Statistics IA December 2010david1dave
 
Math ia 2
Math ia 2Math ia 2
Math ia 2NonnieZ
 
Color+preference
Color+preferenceColor+preference
Color+preferencesiangzalian
 
Mathematics- IB Math Studies IA
Mathematics- IB Math Studies IAMathematics- IB Math Studies IA
Mathematics- IB Math Studies IAalipinedo
 
Math ia final
Math ia finalMath ia final
Math ia finalmischas
 
International baccalaureate math sl investigation_the correlation between lu...
International baccalaureate math sl  investigation_the correlation between lu...International baccalaureate math sl  investigation_the correlation between lu...
International baccalaureate math sl investigation_the correlation between lu...Felix Dyrek
 
IB math HL IA modeling a functional building
IB math HL IA   modeling a functional buildingIB math HL IA   modeling a functional building
IB math HL IA modeling a functional buildingheejjung
 
Math Internal Assessment
Math Internal AssessmentMath Internal Assessment
Math Internal AssessmentJanniie
 

Andere mochten auch (16)

Ib math studies internal assessment final draft
Ib math studies internal assessment final draftIb math studies internal assessment final draft
Ib math studies internal assessment final draft
 
IA Math
IA MathIA Math
IA Math
 
Math IA
Math IAMath IA
Math IA
 
IB Math Studies IA
IB Math Studies IAIB Math Studies IA
IB Math Studies IA
 
Math Statistics IA December 2010
Math Statistics IA December 2010Math Statistics IA December 2010
Math Statistics IA December 2010
 
Math ia 2
Math ia 2Math ia 2
Math ia 2
 
Color+preference
Color+preferenceColor+preference
Color+preference
 
Math IA
Math IAMath IA
Math IA
 
Ao k math - math ia
Ao k   math - math iaAo k   math - math ia
Ao k math - math ia
 
Mathematics- IB Math Studies IA
Mathematics- IB Math Studies IAMathematics- IB Math Studies IA
Mathematics- IB Math Studies IA
 
Math ia final
Math ia finalMath ia final
Math ia final
 
International baccalaureate math sl investigation_the correlation between lu...
International baccalaureate math sl  investigation_the correlation between lu...International baccalaureate math sl  investigation_the correlation between lu...
International baccalaureate math sl investigation_the correlation between lu...
 
SL Math IA
SL Math IASL Math IA
SL Math IA
 
IB math HL IA modeling a functional building
IB math HL IA   modeling a functional buildingIB math HL IA   modeling a functional building
IB math HL IA modeling a functional building
 
Math IA
Math IAMath IA
Math IA
 
Math Internal Assessment
Math Internal AssessmentMath Internal Assessment
Math Internal Assessment
 

Mehr von siriben94

สี่แผ่นดิน บท10
สี่แผ่นดิน บท10สี่แผ่นดิน บท10
สี่แผ่นดิน บท10siriben94
 
เด็กติดเกม
เด็กติดเกมเด็กติดเกม
เด็กติดเกมsiriben94
 
Folding furniture
Folding furnitureFolding furniture
Folding furnituresiriben94
 
Comparative essay vignette and poem
Comparative essay vignette and poemComparative essay vignette and poem
Comparative essay vignette and poemsiriben94
 
Senior seminar presentation
Senior seminar presentationSenior seminar presentation
Senior seminar presentationsiriben94
 
Senior sem scriptt
Senior sem scripttSenior sem scriptt
Senior sem scripttsiriben94
 
Rashomon essay
Rashomon essayRashomon essay
Rashomon essaysiriben94
 

Mehr von siriben94 (8)

สี่แผ่นดิน บท10
สี่แผ่นดิน บท10สี่แผ่นดิน บท10
สี่แผ่นดิน บท10
 
เด็กติดเกม
เด็กติดเกมเด็กติดเกม
เด็กติดเกม
 
Hiv essay
Hiv essayHiv essay
Hiv essay
 
Folding furniture
Folding furnitureFolding furniture
Folding furniture
 
Comparative essay vignette and poem
Comparative essay vignette and poemComparative essay vignette and poem
Comparative essay vignette and poem
 
Senior seminar presentation
Senior seminar presentationSenior seminar presentation
Senior seminar presentation
 
Senior sem scriptt
Senior sem scripttSenior sem scriptt
Senior sem scriptt
 
Rashomon essay
Rashomon essayRashomon essay
Rashomon essay
 

Kürzlich hochgeladen

Tableaux 9ème étape circuit fédéral 2024
Tableaux 9ème étape circuit fédéral 2024Tableaux 9ème étape circuit fédéral 2024
Tableaux 9ème étape circuit fédéral 2024HechemLaameri
 
08448380779 Call Girls In Lajpat Nagar Women Seeking Men
08448380779 Call Girls In Lajpat Nagar Women Seeking Men08448380779 Call Girls In Lajpat Nagar Women Seeking Men
08448380779 Call Girls In Lajpat Nagar Women Seeking MenDelhi Call girls
 
Croatia vs Albania Clash of Euro Cup 2024 Squad Preparations and Euro Cup Dre...
Croatia vs Albania Clash of Euro Cup 2024 Squad Preparations and Euro Cup Dre...Croatia vs Albania Clash of Euro Cup 2024 Squad Preparations and Euro Cup Dre...
Croatia vs Albania Clash of Euro Cup 2024 Squad Preparations and Euro Cup Dre...Eticketing.co
 
08448380779 Call Girls In Karol Bagh Women Seeking Men
08448380779 Call Girls In Karol Bagh Women Seeking Men08448380779 Call Girls In Karol Bagh Women Seeking Men
08448380779 Call Girls In Karol Bagh Women Seeking MenDelhi Call girls
 
Italy vs Albania Tickets: Italy's Quest for Euro Cup Germany History, Defendi...
Italy vs Albania Tickets: Italy's Quest for Euro Cup Germany History, Defendi...Italy vs Albania Tickets: Italy's Quest for Euro Cup Germany History, Defendi...
Italy vs Albania Tickets: Italy's Quest for Euro Cup Germany History, Defendi...Eticketing.co
 
08448380779 Call Girls In IIT Women Seeking Men
08448380779 Call Girls In IIT Women Seeking Men08448380779 Call Girls In IIT Women Seeking Men
08448380779 Call Girls In IIT Women Seeking MenDelhi Call girls
 
🔝|97111༒99012🔝 Call Girls In {Delhi} Cr Park ₹5.5k Cash Payment With Room De...
🔝|97111༒99012🔝 Call Girls In  {Delhi} Cr Park ₹5.5k Cash Payment With Room De...🔝|97111༒99012🔝 Call Girls In  {Delhi} Cr Park ₹5.5k Cash Payment With Room De...
🔝|97111༒99012🔝 Call Girls In {Delhi} Cr Park ₹5.5k Cash Payment With Room De...Diya Sharma
 
08448380779 Call Girls In International Airport Women Seeking Men
08448380779 Call Girls In International Airport Women Seeking Men08448380779 Call Girls In International Airport Women Seeking Men
08448380779 Call Girls In International Airport Women Seeking MenDelhi Call girls
 
Spain Vs Italy 20 players confirmed for Spain's Euro 2024 squad, and three po...
Spain Vs Italy 20 players confirmed for Spain's Euro 2024 squad, and three po...Spain Vs Italy 20 players confirmed for Spain's Euro 2024 squad, and three po...
Spain Vs Italy 20 players confirmed for Spain's Euro 2024 squad, and three po...World Wide Tickets And Hospitality
 
Dubai Call Girls Bikni O528786472 Call Girls Dubai Ebony
Dubai Call Girls Bikni O528786472 Call Girls Dubai EbonyDubai Call Girls Bikni O528786472 Call Girls Dubai Ebony
Dubai Call Girls Bikni O528786472 Call Girls Dubai Ebonyhf8803863
 
Plan d'orientations stratégiques rugby féminin
Plan d'orientations stratégiques rugby fémininPlan d'orientations stratégiques rugby féminin
Plan d'orientations stratégiques rugby fémininThibaut TATRY
 
CALL ON ➥8923113531 🔝Call Girls Chinhat Lucknow best sexual service
CALL ON ➥8923113531 🔝Call Girls Chinhat Lucknow best sexual serviceCALL ON ➥8923113531 🔝Call Girls Chinhat Lucknow best sexual service
CALL ON ➥8923113531 🔝Call Girls Chinhat Lucknow best sexual serviceanilsa9823
 
Chennai Call Girls Anna Nagar Phone 🍆 8250192130 👅 celebrity escorts service
Chennai Call Girls Anna Nagar Phone 🍆 8250192130 👅 celebrity escorts serviceChennai Call Girls Anna Nagar Phone 🍆 8250192130 👅 celebrity escorts service
Chennai Call Girls Anna Nagar Phone 🍆 8250192130 👅 celebrity escorts servicevipmodelshub1
 
CALL ON ➥8923113531 🔝Call Girls Telibagh Lucknow best Night Fun service 🧣
CALL ON ➥8923113531 🔝Call Girls Telibagh Lucknow best Night Fun service  🧣CALL ON ➥8923113531 🔝Call Girls Telibagh Lucknow best Night Fun service  🧣
CALL ON ➥8923113531 🔝Call Girls Telibagh Lucknow best Night Fun service 🧣anilsa9823
 
CALL ON ➥8923113531 🔝Call Girls Saharaganj Lucknow best Female service 🦺
CALL ON ➥8923113531 🔝Call Girls Saharaganj Lucknow best Female service  🦺CALL ON ➥8923113531 🔝Call Girls Saharaganj Lucknow best Female service  🦺
CALL ON ➥8923113531 🔝Call Girls Saharaganj Lucknow best Female service 🦺anilsa9823
 
Albania Vs Spain Albania is Loaded with Defensive Talent on their Roster.docx
Albania Vs Spain Albania is Loaded with Defensive Talent on their Roster.docxAlbania Vs Spain Albania is Loaded with Defensive Talent on their Roster.docx
Albania Vs Spain Albania is Loaded with Defensive Talent on their Roster.docxWorld Wide Tickets And Hospitality
 

Kürzlich hochgeladen (20)

Call Girls Service Noida Extension @9999965857 Delhi 🫦 No Advance VVIP 🍎 SER...
Call Girls Service Noida Extension @9999965857 Delhi 🫦 No Advance  VVIP 🍎 SER...Call Girls Service Noida Extension @9999965857 Delhi 🫦 No Advance  VVIP 🍎 SER...
Call Girls Service Noida Extension @9999965857 Delhi 🫦 No Advance VVIP 🍎 SER...
 
Tableaux 9ème étape circuit fédéral 2024
Tableaux 9ème étape circuit fédéral 2024Tableaux 9ème étape circuit fédéral 2024
Tableaux 9ème étape circuit fédéral 2024
 
08448380779 Call Girls In Lajpat Nagar Women Seeking Men
08448380779 Call Girls In Lajpat Nagar Women Seeking Men08448380779 Call Girls In Lajpat Nagar Women Seeking Men
08448380779 Call Girls In Lajpat Nagar Women Seeking Men
 
Croatia vs Albania Clash of Euro Cup 2024 Squad Preparations and Euro Cup Dre...
Croatia vs Albania Clash of Euro Cup 2024 Squad Preparations and Euro Cup Dre...Croatia vs Albania Clash of Euro Cup 2024 Squad Preparations and Euro Cup Dre...
Croatia vs Albania Clash of Euro Cup 2024 Squad Preparations and Euro Cup Dre...
 
08448380779 Call Girls In Karol Bagh Women Seeking Men
08448380779 Call Girls In Karol Bagh Women Seeking Men08448380779 Call Girls In Karol Bagh Women Seeking Men
08448380779 Call Girls In Karol Bagh Women Seeking Men
 
Call Girls 🫤 Paharganj ➡️ 9999965857 ➡️ Delhi 🫦 Russian Escorts FULL ENJOY
Call Girls 🫤 Paharganj ➡️ 9999965857  ➡️ Delhi 🫦  Russian Escorts FULL ENJOYCall Girls 🫤 Paharganj ➡️ 9999965857  ➡️ Delhi 🫦  Russian Escorts FULL ENJOY
Call Girls 🫤 Paharganj ➡️ 9999965857 ➡️ Delhi 🫦 Russian Escorts FULL ENJOY
 
Italy vs Albania Tickets: Italy's Quest for Euro Cup Germany History, Defendi...
Italy vs Albania Tickets: Italy's Quest for Euro Cup Germany History, Defendi...Italy vs Albania Tickets: Italy's Quest for Euro Cup Germany History, Defendi...
Italy vs Albania Tickets: Italy's Quest for Euro Cup Germany History, Defendi...
 
08448380779 Call Girls In IIT Women Seeking Men
08448380779 Call Girls In IIT Women Seeking Men08448380779 Call Girls In IIT Women Seeking Men
08448380779 Call Girls In IIT Women Seeking Men
 
Call Girls 🫤 Malviya Nagar ➡️ 9999965857 ➡️ Delhi 🫦 Russian Escorts FULL ENJOY
Call Girls 🫤 Malviya Nagar ➡️ 9999965857  ➡️ Delhi 🫦  Russian Escorts FULL ENJOYCall Girls 🫤 Malviya Nagar ➡️ 9999965857  ➡️ Delhi 🫦  Russian Escorts FULL ENJOY
Call Girls 🫤 Malviya Nagar ➡️ 9999965857 ➡️ Delhi 🫦 Russian Escorts FULL ENJOY
 
🔝|97111༒99012🔝 Call Girls In {Delhi} Cr Park ₹5.5k Cash Payment With Room De...
🔝|97111༒99012🔝 Call Girls In  {Delhi} Cr Park ₹5.5k Cash Payment With Room De...🔝|97111༒99012🔝 Call Girls In  {Delhi} Cr Park ₹5.5k Cash Payment With Room De...
🔝|97111༒99012🔝 Call Girls In {Delhi} Cr Park ₹5.5k Cash Payment With Room De...
 
08448380779 Call Girls In International Airport Women Seeking Men
08448380779 Call Girls In International Airport Women Seeking Men08448380779 Call Girls In International Airport Women Seeking Men
08448380779 Call Girls In International Airport Women Seeking Men
 
Spain Vs Italy 20 players confirmed for Spain's Euro 2024 squad, and three po...
Spain Vs Italy 20 players confirmed for Spain's Euro 2024 squad, and three po...Spain Vs Italy 20 players confirmed for Spain's Euro 2024 squad, and three po...
Spain Vs Italy 20 players confirmed for Spain's Euro 2024 squad, and three po...
 
Dubai Call Girls Bikni O528786472 Call Girls Dubai Ebony
Dubai Call Girls Bikni O528786472 Call Girls Dubai EbonyDubai Call Girls Bikni O528786472 Call Girls Dubai Ebony
Dubai Call Girls Bikni O528786472 Call Girls Dubai Ebony
 
Plan d'orientations stratégiques rugby féminin
Plan d'orientations stratégiques rugby fémininPlan d'orientations stratégiques rugby féminin
Plan d'orientations stratégiques rugby féminin
 
CALL ON ➥8923113531 🔝Call Girls Chinhat Lucknow best sexual service
CALL ON ➥8923113531 🔝Call Girls Chinhat Lucknow best sexual serviceCALL ON ➥8923113531 🔝Call Girls Chinhat Lucknow best sexual service
CALL ON ➥8923113531 🔝Call Girls Chinhat Lucknow best sexual service
 
Call Girls In RK Puram 📱 9999965857 🤩 Delhi 🫦 HOT AND SEXY VVIP 🍎 SERVICE
Call Girls In RK Puram 📱  9999965857  🤩 Delhi 🫦 HOT AND SEXY VVIP 🍎 SERVICECall Girls In RK Puram 📱  9999965857  🤩 Delhi 🫦 HOT AND SEXY VVIP 🍎 SERVICE
Call Girls In RK Puram 📱 9999965857 🤩 Delhi 🫦 HOT AND SEXY VVIP 🍎 SERVICE
 
Chennai Call Girls Anna Nagar Phone 🍆 8250192130 👅 celebrity escorts service
Chennai Call Girls Anna Nagar Phone 🍆 8250192130 👅 celebrity escorts serviceChennai Call Girls Anna Nagar Phone 🍆 8250192130 👅 celebrity escorts service
Chennai Call Girls Anna Nagar Phone 🍆 8250192130 👅 celebrity escorts service
 
CALL ON ➥8923113531 🔝Call Girls Telibagh Lucknow best Night Fun service 🧣
CALL ON ➥8923113531 🔝Call Girls Telibagh Lucknow best Night Fun service  🧣CALL ON ➥8923113531 🔝Call Girls Telibagh Lucknow best Night Fun service  🧣
CALL ON ➥8923113531 🔝Call Girls Telibagh Lucknow best Night Fun service 🧣
 
CALL ON ➥8923113531 🔝Call Girls Saharaganj Lucknow best Female service 🦺
CALL ON ➥8923113531 🔝Call Girls Saharaganj Lucknow best Female service  🦺CALL ON ➥8923113531 🔝Call Girls Saharaganj Lucknow best Female service  🦺
CALL ON ➥8923113531 🔝Call Girls Saharaganj Lucknow best Female service 🦺
 
Albania Vs Spain Albania is Loaded with Defensive Talent on their Roster.docx
Albania Vs Spain Albania is Loaded with Defensive Talent on their Roster.docxAlbania Vs Spain Albania is Loaded with Defensive Talent on their Roster.docx
Albania Vs Spain Albania is Loaded with Defensive Talent on their Roster.docx
 

Math ia #2

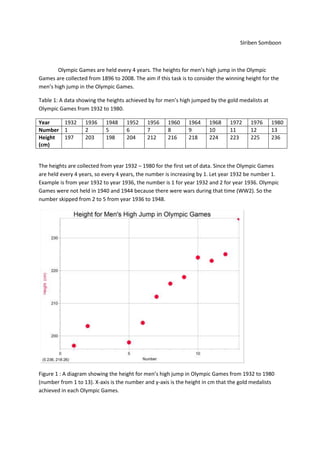
  • 1. SIriben Somboon Olympic Games are held every 4 years. The heights for men’s high jump in the Olympic Games are collected from 1896 to 2008. The aim if this task is to consider the winning height for the men’s high jump in the Olympic Games. Table 1: A data showing the heights achieved by for men’s high jumped by the gold medalists at Olympic Games from 1932 to 1980. Year 1932 1936 1948 1952 1956 1960 1964 1968 1972 1976 1980 Number 1 2 5 6 7 8 9 10 11 12 13 Height 197 203 198 204 212 216 218 224 223 225 236 (cm) The heights are collected from year 1932 – 1980 for the first set of data. Since the Olympic Games are held every 4 years, so every 4 years, the number is increasing by 1. Let year 1932 be number 1. Example is from year 1932 to year 1936, the number is 1 for year 1932 and 2 for year 1936. Olympic Games were not held in 1940 and 1944 because there were wars during that time (WW2). So the number skipped from 2 to 5 from year 1936 to 1948. Figure 1 : A diagram showing the height for men’s high jump in Olympic Games from 1932 to 1980 (number from 1 to 13). X-axis is the number and y-axis is the height in cm that the gold medalists achieved in each Olympic Games.
  • 2. According to the figure 1, I observe that the numbers are increasing between each Olympic Games (except from year 1936 to 1948). The amount that the heights for men’s high jump in the Olympic Games that are increasing each year is quite constant, so I use a linear line to find the equation of heights for men’s high jump for Olympic Games. With many points, I have to choose 2 points that can represent my graph if I want to find the linear equation for this data. I wouldn’t get an accurate result for this data, so I decided to use a median-median line. I use a median-median line to find the equation of the line. The equation for median-median line is y = ax + b. Where “a” = the slope of the median from the data; “b” = y-intercept for the data; “x” = the number (the year); and “y” = height that the gold medalist achieved in that Olympic Game. The numbers are divided into 3 groups; in this case 4/3/4 because there are 11 numbers and 11 is not divisible by 3. The first and the last group must have the same size. Then I find the median for each group (both the number and the height). Table 2: Finding median for first group. Number 1 2 5 6 Height (cm) 197 203 198 204 Median for number = = 3.5 Median for height = = 200.5 Table 3: Finding median for middle group. Number 7 8 9 Height (cm) 212 216 218 Median for middle group is (8,216). Table 4: Finding median for last group. Number 10 11 12 13 Height (cm) 224 223 225 236 Median for number = = 11.5 Median for height = = 224.5 The median for the first group is 3.5 for number and 200.5 for height (3.5, 200.5). The median for the middle group is (8, 216). The median for the last group is (11.5, 224.5). To find “a” for the median-median line equation, I find the slope of the median I got from last group and the first group. To get “b” for the median-median line equation, I need to find the y-intercept of the line.
  • 3. To find “a” = = =3 “a” = To find “b” = = = 190.67 “b” = 190.67 The median-median line equation is y = 3x + 190.67.Then I graph the line by using my equation that I found. Figure 2: A diagram showing the height for men’s high jump in Olympic Games from 1932 to 1980. The slope of the line Is 3 and the y-intercept is 190.7. This shows that every 4 year (every Olympic Games) the height for men’s high jump increases by 3 cm and at the year 1932, the height that should be achieved by the gold medalist is 190.7 cm.
  • 4. Figure 3: A diagram showing the height for men’s high jump in Olympic Games from 1932 to 1980. The black line is the line of best fit (linear line). The gray line is from the equation that I got by using median-median line equation. The slope of the black line is 3.02 and the y-intercept for the black line is 191.1 cm. This shows that every 4 year (every Olympic Games) the height for men’s high jump increases by 3.02 cm and at the year 1932, the height that should be achieved by gold medalist is 191.1 cm. The slope of the line Is 3 and the y-intercept is 190.7 cm. This shows that every 4 year (every Olympic Games) the height for men’s high jump increases by 3 cm and at the year 1932, the height that should be achieved by the gold medalist is 190.7 cm. Then to find the differences between the two lines, I use the percent error from my median-median equation and the line of best fit when I used technology to find the line for this set of data. My median-median line and the line of best fit that the computer found has the percent error of 0.67%. The limitation for my model is as time passes, the percent error for my model and the computer model would be bigger because the slope and y-intercept is higher for the computer model than my model. To find the percent error: x 100 = x 100 = 0.67%
  • 5. Another function that models this data is quadratic equation. I use quadratic equation because the height for men’s high jump in the Olympic Games is increasing for most of the Olympic Games. Figure 4: A diagram showing the height for men’s high jump in Olympic Games from 1932 to 1980. The gray line is the equation median-median line. The black line is a quadratic function that models the data. The slope of the line Is 3 and the y-intercept is 190.7. This shows that every 4 year (every Olympic Games) the height for men’s high jump increases by 3 cm and at the year 1932, the height that should be achieved by the gold medalist is 190.7 cm. The “a” value for the black line is 0.1807, “b” is 0.5004 and “c” is 197.3. This shows that according to the black curve, at year 1932, the height that should be achieved by the gold medalists is 197.3 cm. The differences between the median-median line and the quadratic curve are the y-intercept is different and the quadratic line is closer to the points than the median-median line. The y-intercept for the median-median line is 191.1 and the y-intercept for the quadratic line is 197.3.The quadratic line is closer to the points than the median-median line because the median-median line has the R2 of 0.883 and the quadratic line has the R2 of 0.924. This shows that the quadratic line is closer to the points than the median-median line. The quadratic line also has a limit from 1 13 because if there is no limit for the quadratic line, in a few decades, the height that should be achieved by gold medalists at the Olympic Games would be too high.
  • 6. If the game is held in 1940 and 1944, I use both the median-median line and the quadratic line to estimate the winning heights that would have been if the games are held. Table 5: A table showing the heights estimation for men’s high jump if the game is held in 1940 and 1944. The estimation heights for men’s high jump in year 1940 and 1944 are calculated by using median-median line and quadratic line. Year Number Height (cm) Median-median line Quadratic line Height % Height difference Y = 3.02x + 191.1 Y = 0.1807x2 + 0.5004x + difference (compare to 197.3 Quadratic line) 1940 3 200.16 200.43 0.27 0.13% 1944 4 203.10 202.19 0.91 0.45% The estimated winning heights if the Olympic Game in 1940 is 200.4 cm and 202.2 cm in year 1994. The quadratic line is being used instead of median-median line because the quadratic line is closer to the points in the data than median-median line. Also when I plugged 6 for “x” (year 1956) in both equations, for the median-median line, I got 209.2 cm; for quadratic line, I got 206.8 cm. This shows that the quadratic line give more similar number to the data than the median-median line. Table 6: A table showing the heights estimation for men’s high jump if the game is held in 1984 and 2016. The estimation heights for men’s high jump in year 1940 and 1944 are calculated by using median-median line and quadratic line. Year Number Height (cm) Median-median line Quadratic line Height % Height difference Y = 3.02x + 191.1 Y = 0.1807x2 + 0.5004x + difference (compare to 197.3 Quadratic line) 1984 14 233.38 239.72 6.34 2.72% 2016 20 251.5 279.59 28.09 11.17% By using the median-median line, in 1984, the predicted height achieved by gold medalists in the Olympic Games is 233.4 cm. In 2016, the predicted height achieved by gold medalists in the Olympic Games is 251.5 cm. By using the quadratic line, in 1984, the predicted height achieved by gold medalists in the Olympic Games is 239.7 cm. In 2016, the predicted height achieved by gold medalists in the Olympic Games is 279.6 cm. When I used the quadratic line to estimate the height that gold medalists can achieve in 2016, the answer comes out to be 279.6 cm which is quite high for me. In 32 years (8 Olympic Games), the height that gold medalists can achieve from 1984 to 2016 increases by 18.1 cm by using median-median line. The height that gold medalists can achieve from 1984 to 2016 increase by 39.9 cm by using quadratic line. There is also a higher percentage height difference between the median-median line and the quadratic line in year 2016 than in year 1984. This means that one line (the quadratic line) is increasing a lot more than another line (median- median line).
  • 7. Table 7: A data showing the heights achieved by for men’s high jump by the gold medalists at Olympic Games from other Olympic Games since 1896. Year 1896 1904 1908 1912 1920 1928 1984 1988 1992 1996 2000 2004 2008 Number -9 -7 -6 -5 -3 -1 14 15 16 17 18 19 20 Height 190 180 191 193 193 194 235 238 234 239 235 236 236 (cm) Table 8: A table showing the estimated heights achieved for men’s high jump by gold medalists in the Olympic Games since 1896 and the collected data for men’s high jumped by gold medalists in Olympic Games. Height difference from the % difference Year Height (cm) collected data from the collected data Number Median- Median- Median- Collected median Quadratic median Quadratic median Quadratic data Model Model Model Model Model Model 1896 -9 190 163.92 207.43 26.08 -17.43 15.91% 8.40% 1904 -7 180 169.96 202.65 10.04 -22.65 5.91% 11.18% 1908 -6 191 172.98 200.80 18.02 -9.80 10.42% 4.88% 1912 -5 193 176 199.32 17 -6.32 9.66% 3.17% 1920 -3 193 182.04 197.43 10.96 -4.43 6.02% 2.24% 1928 -1 194 188.08 196.98 5.92 -2.98 3.15% 1.51% 1984 14 235 233.38 239.72 1.62 -4.72 0.69% 1.97% 1988 15 238 236.4 245.46 1.6 -7.46 0.69% 3.04% 1992 16 234 239.42 251.57 -5.42 -17.57 2.26% 6.98% 1996 17 239 242.44 258.03 -3.44 -19.03 1.42% 7.37% 2000 18 235 245.46 264.85 -10.46 -29.85 4.26% 11.27% 2004 19 236 248.48 272.04 -12.48 -36.04 5.02% 13.25% 2008 20 236 251.5 279.59 -15.5 -43.59 6.16% 15.59% Median-median function and quadratic function are being used to estimate the heights. The heights are then compared to the collected data to find the percentage difference estimated data is from the collected data. According to table 8, my models (both median-median line and quadratic line) do not fit well when additional data are being added because the percentage difference the estimated data are from the collected data is quite big. The height achieved for men’s high jump level off at around 236, it does not keep on going up, so both of the equations do not fit the additional data because both of the equations keep on going up.
  • 8. Figure 5: A diagram showing the height for men’s high jump in Olympic Games since 1896. This line is a logarithm line where “a” = 54.19 and “b” = 720. I used a logarithm curve because first the height achieved by the gold medalists in the Olympic Games for men’s high jump kept on increasing, but since year 1980, there is almost no change in the heights achieved by gold medalists in the Olympic Games. The overall trend from 1896 to 2008 is the heights achieved by the gold medalists in the Olympic Games increase until year 1980. These fluctuations happen because technologies improved, so people have more resources to train with (so that they could jump higher). There is almost no change in the height achieved by the gold medalists in the Olympic Games for men’s high jump because technologies have increased the resources for high jumpers to train to a certain level. I would modify my graphs (from median-median and quadratic curve) to logarithm because the height achieved by gold medalists in the Olympic Games did not increase since 1980, so I cannot use equation that would keep on going up. It is also impossible for human to keep on increasing the height achieved by the gold medalists in the Olympic Games for men’s high jump.