SlideShare ist ein Scribd-Unternehmen logo
1 von 7
A Publication of RMLS™, The Source for Real Estate Statistics in Your Community
Residential Review: Metro Portland, Oregon                                                                               February 2010 Reporting Period
February Residential Highlights                           Sale Prices
                                                                                                                                    Inventory in Months*
   Sales activity in the Portland                            T he average sa le pr ice for                                                       2008 2009 2010
metro area improved in February                           February 2010 was down 8.5%                                               January       12.8 19.2 12.6
2010 compared to the same month                           compared to February 2009, while                                          February      10.4 16.6 12.9
a year ago.                                               the median sale price declined                                            March          9.1   12
                                                          9.3%.                                                                     April         10.3   11
   Comparing February 2010
                                                                                                                                    May            9.2 10.2
with February 2009, closed sales                             Month-to-month, the average                                            June           9.5 8.2
increased 18.4%. Pending sales also                       price decreased 3.3% ($273,100                                            July            10 7.3
jumped 45%, and new listings rose                         v. $282,400) and the median fell                                          August         9.9 7.8
12.4%.                                                    2.1% ($235,000 v. $240,000), when                                         September 10.4 7.6
                                                          compa r i ng Febr u a r y 2010 to                                         October       11.1 6.5
    When comparing February 2010
                                                          January 2010.                                                             November        15 7.1
with the month prior, January 2009,                                                                                                 December      14.1 7.7
closed sales grew a slight 2.9%                           Year-to-Date
                                                                                                                                    *Inventory in Months is calculated by dividing
(1,015 v. 986) and pending sales                             Comparing January-February                                             the Active Listings at the end of the month in
were up 20.5% (1,850 v. 1,535). New                       2010 with the same period in                                              question by the number of closed sales for
listings, on the other hand, dropped                      2009, closed sales increased 26.7%.                                       that month.
just 1% (3,902 v. 3,937).                                 Pending sales rose 34.7%, while
                                                                                                                                       Percent Change of 12-Month Sale Price
   At the month’s rate of sales, the                      new listings grew a slight 2.1%                                              Compared With The Previous 12 Months
13,101 active residential listings                        See residential highlights table
                                                                                                                                            Average Sale Price % Change:
would last approximately 12.9                             below.
                                                                                                                                              -11.5% ($287,800 v. $325,200)
months.                                                                                                                                      Median Sale Price % Change:
                                                                                                                                              -10.9% ($245,000 v. $275,000)
                                                                                                                                   For further explanation of this measure, see
                                                                                                                                   the second footnote on page 2.


             Portland Metro
                                                                                                                                                                     Total
             Residential
                                                    New              Pending                Closed              Average                   Median                    Market
             Highlights                         Listings               Sales                 Sales             Sale Price               Sale Price                   Time

                    February                           3,902                1,850                1,015              273,100                  235,000                    150
           2010


                    Year-to-date                       7,918                3,299                2,043              276,300                  236,000                    147
                    February                           3,471                1,276                   857             298,500                  259,000                    153
           2009


                    Year-to-date                       7,754                2,450                1,613              297,900                  255,000                    152
                    February
           Change


                                                      12.4%                45.0%                18.4%                   -8.5%                    -9.3%                -1.5%
                    Year-to-date                        2.1%               34.7%                26.7%                   -7.3%                    -7.5%                -3.4%
                        *Total Market Time is the number of days from when a property is listed to when an offer is accepted on that same property. If a property
                            is re-listed within 31 days, Total Market Time continues to accrue; however, it does not include the time that it was off the market.


                                                          © Copyright RMLS™ 2010. All Rights Reserved.
AREA REPORT • 2/2010
     AREA REPORT ● 1/2010& Portland Metro Area
      Metro Portland ● Adjacent Regions,                                                                                                                                                                                                                                                                                                                                                                      Oregon
                                                                                                                                                                                                         RESIDENTIAL                                                                                                                                                                                       COMMERCIAL                                       LAND                            MULTIFAMILY

                                                                                                       Current Month                                                                                                                                                                                   Year-To-Date                                                                                          Year-To-Date                            Year-To-Date                             Year-To-Date


                                                                                                                            Pending Sales 2010 v. 20091


                                                                                                                                                                                                                                                                          Pending Sales 2010 v. 2009


                                                                                                                                                                                                                                                                                                                                                                         Avg. Sale Price % Change2
                                                                  Expired/Canceled Listings


                                                                                                   Pending Sales 2010


                                                                                                                                                                                                                                                Pending Sales 2010
                                                                                                                                                                                                      Total Market Time 4
                                                                                                                                                                             Average Sale Price


                                                                                                                                                                                                                                                                                                                                Average Sale Price


                                                                                                                                                                                                                                                                                                                                                                                                                    Average Sale Price


                                                                                                                                                                                                                                                                                                                                                                                                                                                              Average Sale Price


                                                                                                                                                                                                                                                                                                                                                                                                                                                                                                    Average Sale Price
                                                                                                                                                                                                                                                                                                                                                     Median Sale Price
                               Active Listings


                                                 New Listings3


                                                                                                                                                          Closed Sales


                                                                                                                                                                                                                                                                                                            Closed Sales


                                                                                                                                                                                                                                                                                                                                                                                                     Closed Sales


                                                                                                                                                                                                                                                                                                                                                                                                                                             Closed Sales


                                                                                                                                                                                                                                                                                                                                                                                                                                                                                   Closed Sales
                                                                                                                                                                                                                            New Listings
     141


               N Portland                425              145                           73                        88          41.9%                                 41        238,300                              74               299                      154                36.3%                                      73    239,600              225,000                 -10.8%                     -                               -             5             74,000                  2           272,600
     142


               NE Portland               971              391                   141                          176              33.3%                                 99        275,000                         114                   757                      326                25.4%                               202          274,800              243,800                 -10.7%                           1     600,000                           8       121,400                   10              323,400
     143


               SE Porltand        1,329                   464                   197                          273              56.9%                             139           227,400                         119                   921                      461                30.2%                               292          226,700              197,900                 -11.7%                           3     211,700                           4             66,600              11              455,000

               Gresham/
     144


               Troutdale                 942              241                   109                          125              33.0%                                 78        196,700                         162                   545                      226                41.3%                               151          204,200              190,000                 -14.2%                           1     255,200                           8             78,600                  1           212,000
               Milwaukie/
     145


               Clackamas                 968              274                           97                   138              22.1%                                 69        250,300                         136                   611                      239                21.9%                               136          252,700              235,000                        -8.2%                     1           95,000                      7       117,900                       1           130,000
               Oregon City/
     146


               Canby                     807              215                           86                        82          78.3%                                 48        274,400                         149                   421                      160                44.1%                               118          251,300              221,400                 -11.4%                           2           45,000                      8       160,700                       2           378,300
               Lake Oswego/
     147


               West Linn                 981              251                   104                               84          52.7%                                 45        457,700                         153                   535                      154                49.5%                                      96    432,200              360,000                        -9.7%                     2     370,000                           3       198,300                 -                                 -
     148


               W Portland         1,612                   462                   235                          179              67.3%                             100           408,300                         208                   920                      317                49.5%                               213          415,200              315,000                 -10.8%                     -                               -             1       146,000                       4           818,900
     149


               NW Wash Co.               502              191                           83                        98          40.0%                                 49        349,700                         144                   350                      162                38.5%                                      95    361,600              340,000                        -9.8%               -                               -             4       161,000                 -                                 -

               Beaverton/
     150


               Aloha              1,047                   370                   148                          206              56.1%                             108           237,100                         168                   767                      354                38.3%                               198          238,500              217,600                 -12.2%                           1     255,000                           2       103,800                       4           153,000

               Tigard/
     151


               Wilsonville        1,095                   318                   117                          128              24.3%                                 80        314,500                         184                   647                      259                35.6%                               170          313,800              295,500                        -8.5%                     1     245,000                           3       150,800                       5           289,000
               Hillsboro/
     152


               Forest Grove              900              275                           83                   146              50.5%                                 66        227,200                         138                   513                      246                24.9%                               135          242,900              213,000                 -10.9%                     -                               -             6             96,700                  4           167,700
     153


               Mt. Hood                  136                 25                         17                              6     20.0%                                      8    238,400                         228                          43                        13         30.0%                                      14    260,700              227,500                        -1.4%               -                               -             3       114,000                 -                                 -
     155


               Columbia Co.              477              111                           45                        40          66.7%                                 34        202,000                         183                   217                              78         32.2%                                      59    189,200              184,000                 -14.6%                     -                               -             2       121,000                       1           155,000
     156


    Grand Yamhill Co.
          Total                   909
                               13,101                169
                                                  3,902                99
                                                                    1,634                              81
                                                                                                    1,850                     30.6%
                                                                                                                              -4.1%                           51
                                                                                                                                                           1,015              190,000
                                                                                                                                                                              273,100                         154
                                                                                                                                                                                                              150               372
                                                                                                                                                                                                                              7,918                   150
                                                                                                                                                                                                                                                    3,299                   35.1%
                                                                                                                                                                                                                                                                           -85.7%                                91
                                                                                                                                                                                                                                                                                                              2,043              198,000
                                                                                                                                                                                                                                                                                                                                 276,300              190,000
                                                                                                                                                                                                                                                                                                                                                      236,000                 -16.0%
                                                                                                                                                                                                                                                                                                                                                                              -11.5%                        1
                                                                                                                                                                                                                                                                                                                                                                                                           13        285,000                        3
                                                                                                                                                                                                                                                                                                                                                                                                                                                   67           67,300
                                                                                                                                                                                                                                                                                                                                                                                                                                                               115,800                 -45                   -
                                                                                                                                                                                                                                                                                                                                                                                                                                                                                                         356,500
     168-178


               Marion/Polk
               Counties           1,070                240                                    99                  80          66.7%                                 42        274,200                         177                   439                      142                42.0%                                      87    235,800              196,000                 -14.9%                     -                    -                        5       177,800                       4           170,800
     180-195


               North Coastal
               Counties           1,340                209                                    99                  63          85.3%                                 51        264,500                         210                   428                      135                80.0%                                      87    256,800              210,000                 -15.9%                     -                    -                        8       218,100                 -                      -

1
    Percent change in number of pending sales this year compared to last year. The Current Month section compares February 2010 with February 2009. The Year-To-
    Date section compares year-to-date statistics from February 2010 with year-to-date statistics from February 2009.
2
    % Change is based on a comparison of the rolling average sale price for the last 12 months (3/1/09-2/28/10) with 12 months before (3/1/08-2/28/09).
3
    As of October 2007, the way that New Listing data is generated has changed to ensure accuracy.
4
    Total Market Time is the number of days from when a property is listed to when an offer is accepted on that same property. If a property is re-listed within 31 days,
    Total Market Time continues to accrue; however, it does not include the time that it was off the market.


                                                                                                                                                                                                                                                                      2
                                                                                                                                                                                                  © Copyright RMLS™ 2010. All Rights Reserved.
ACTIVE
                             Active Residential Listings
                                                                                                                      RESIDENTIAL
20000                                                                                                                  LISTINGS
18000                                                                                                                  PORTLAND, OR
16000
                                                                                                                 This graph shows the active
14000
12000                                                                                                            residential listings over the
10000
 8000
                                                                                                                 past three calendar years
 6000                                                                                                            in the greater Portland,
 4000
                                                                                                                 Oregon metropolitan area.


                                      2008          2009               2010


    TOTAL ACTIVE
                                                                              Total Active Listings
      LISTINGS
        PORTLAND, OR          25000
                              22500
This graph shows the          20000

total active listings over    17500
                              15000
the past three calendar       12500

years in the greater          10000
                               7500
Portland, Oregon               5000

metropolitan area.

                                                 Total Active Listings 2008         Total Active Listings 2009          Total Active Listings 2010


                                                                                                                    NEW LISTINGS
                                        New Listings
                                                                                                                      PORTLAND, OR
  6,000                                                                                                          This graph shows the
  5,000
                                                                                                                 new residential listings
  4,000
                                                                                                                 over the past three
  3,000

  2,000
                                                                                                                 calendar years in the
  1,000                                                                                                          greater Portland, Oregon
        0                                                                                                        metropolitan area.


                                       2008          2009              2010


                                                                         3
                                              © Copyright RMLS™ 2010. All Rights Reserved.
PENDING LISTINGS
                                     Pending Sales
                                                                                                          PORTLAND, OR

2,500
                                                                                                  This graph represents

2,000
                                                                                                  monthly accepted offers
                                                                                                  in the Portland, Oregon
1,500
                                                                                                  metropolitan area over
1,000
                                                                                                  the past three calendar
 500
                                                                                                  years.
   0


                                     2008         2009          2010


   CLOSED SALES
                                                                             Closed Sales
        PORTLAND, OR
This graph shows the         2,500

closed sales over the past   2,000

three calendar years in      1,500

the greater Portland,        1,000

Oregon metropolitan           500

area.                           0


                                                                            2008           2009   2010


                             Average Market Time                                                         DAYS ON MARKET
 180
                                                                                                           PORTLAND, OR
 160                                                                                              This graph shows the
 140
 120                                                                                              average market time for
 100
  80                                                                                              sales in the Portland,
  60
  40
                                                                                                  Oregon metropolitan area.
  20                                                                                              *As of August 2008, graph
   0
                                                                                                  now reports “Total Days
                                                                                                  on Market” - for details
                                      2008
                                      2009 TMT
                                                           2008 TMT
                                                           2010 TMT
                                                                                                  read footnotes on page 2.


                                                                 4
                                            © Copyright RMLS™ 2010. All Rights Reserved.
AVERAGE SALE                                    This graph represents the average sale price for all homes sold in the Portland,
    PRICE                                       Oregon metropolitan area.
  PORTLAND, OR


                                                                           Average Sale Price

 $400,000


 $350,000


 $300,000


 $250,000


 $200,000


 $150,000


 $100,000
            Jan-00

                     Jul-00

                              Jan-01

                                       Jul-01

                                                Jan-02

                                                         Jul-02

                                                                  Jan-03

                                                                           Jul-03

                                                                                    Jan-04

                                                                                              Jul-04

                                                                                                       Jan-05

                                                                                                                Jul-05

                                                                                                                         Jan-06

                                                                                                                                  Jul-06

                                                                                                                                           Jan-07

                                                                                                                                                    Jul-07

                                                                                                                                                             Jan-08

                                                                                                                                                                      Jul-08

                                                                                                                                                                               Jan-09

                                                                                                                                                                                        Jul-09

                                                                                                                                                                                                 Jan-10
                      Median Sale Price: Portland, OR & Clark Co., WA
                                                                                                                                                                                                 MEDIAN SALE
                                                                                                                                                                                                    PRICE
260000                                                                                                                                                                                            PORTLAND, OR
240000                                                                                                                                                                                  This graph shows the
220000
                                                                                                                                                                                        median sale price over
200000
                                                                                                                                                                                        the past 12 months in the
180000

160000                                                                                                                                                                                  greater Portland, Oregon
140000                                                                                                                                                                                  metropolitan area and
120000                                                                                                                                                                                  Clark County.
100000
         MAR         APR           MAY          JUNE JULY                   AUG              SEPT        OCT             NOV        DEC             JAN         FEB

                                                  Clark County                       Metro Portland, OR


                                                                                                          5
                                                                       © Copyright RMLS™ 2010. All Rights Reserved.
MEDIAN SALE PRICE
February 2010                                                                                                  SW
                                                                                           WAShINGTON


                                                                $225,000                                                     $130,000

                                                                Woodland                                                N/NE Clark County


                                                                                                           $199,900
PORTLAND                                                                    $295,000                    Battle Ground
                                                                    Ridgefield/La Center

 METRO                                 $182,000
                                    Columbia County
                                                                            $265,000                                     $264,000
                                                                            Salmon Creek                                Brush Prairie
                                                                               $227,300                                  Hockinson
                                                                                Felida
                                                                                       $180,000
                       $337,500                                                          Hazel     $180,000
                                                                                                   5 Corners
                                                                                          Dell
                                                                                                     Orch.
                 North Washington County                                               Minnehaha
                                                                             $171,900                    $180,000
                       Sauvie Island
                                                                            Cent. Vancouver            Cascade Park
                                                                                          $175,000
                                                                                             Heights
                                                               $237,300
                                                                                                                                  $290,000
                                                               N Portland
                                                                                                                                  Camas/Washougal
                                                                                $245,000
                                                                                NE
       $206,500                                                                 Portland
                                                                $331,300
        Hillsboro                                                  West                                         $186,000
                                                                                $209,900                         Gresham
      Forest Grove                                                Portland
                                           $214,000                             SE                               Troutdale
                                                                                Portland                          Sandy
                                           Beaverton
                                                                                                                  Corbett
                                             Aloha                               $230,000                        Fairview                  $227,500
                                                                                 Milwaukie/Gladstone/
                                                                                                                                            Mt. Hood:
                                                                                 Boring/Clackamas
                                                                                                                                             Zigzag
                                                                                 Estacada
                                               $300,000           $400,000                                                                  Welches
                                                                                                                                         Rhododendron
                                             Tigard/Tualatin
                                                                                                                                            Wemme
                                               Sherwood           Lake Oswego                                                              Brightwood
                                               Wilsonville        West                                                                  Government Camp
                                                                   Linn
      $179,000
    Yamhill County                                                                  $241,300
                                                                                   Oregon City
                                                                                     Canby
                                                                                    Molalla
                                                                                  Beavercreek


                                                                  6
                                           © Copyright RMLS™ 2010. All Rights Reserved.
MULTIPLE LISTING SERVICE


             Corporate
                                                     MEDIAN SALE                         This graph represents the median sale price for all
    825 NE Multnomah, Suite 270                     PRICE CONDOS                         condos sold in the last three calendar years in the
        Portland, OR 97232
          (503) 236-7657                               PORTLAND, OR
        Fax: (503) 230-0689                                                              Portland, Oregon metropolitan area.
       Southwest Washington
      1514 Broadway, Suite 101
        Vancouver, WA 98663                                                         Median Condo Sale Price
           (360) 696-0718
         Fax: (360) 696-9342
                                                 $250,000
               Salem
   2110 Mission St. SE, Suite 305
         Salem, OR 97302                         $225,000
          (503) 587-8810
        Fax: (503) 585-3817
        Lane County: Eugene                      $200,000
        2139 Centennial Plaza
         Eugene, OR 97401
                                                 $175,000
           (541) 686-2885
         Fax: (541) 484-3854
        Lane County: Florence                    $150,000
             PO Box 414
         Florence, OR 97439
           (541) 902-2560
         Fax: (541) 902-1341
           Douglas County                                                                      2008        2009            2010
         3510 NE Edenbower
         Roseburg, OR 97470
            (541) 673-3571
         Fax: (541) 673-6581
             Curry County
             PO Box 6307
         Brookings, OR 97415
                                                  ACTIVE & CLOSED                     This graph shows the number of active and closed
            (541) 469-0219                            CONDOS
         Fax: (541) 469-9695                                                          condos in the Portland, Oregon metropolitan area.
            Mid-Columbia                               PORTLAND, OR
            PO Box 1088
        Hood River, OR 97031
           (541) 436-2956
         Fax: (541) 387-6657                                                            Active & Closed Condos
           Eastern Oregon
             PO Box 751
        Hermiston, OR 97838                         2,500
           (541) 567-5186
         Fax: (541) 289-7320
                                                    2,000
            Coos County
    1946 Sherman Ave., Suite 101
       North Bend, OR 97459                         1,500
          (541) 751-1070
        Fax: (541) 751-1083
                                                    1,000

    The statistics presented in Market
Action are compiled monthly based on                  500
figures generated by RMLS™.
    Statistics reflect reported activity for
                                                        0
the greater Portland, Oregon metropolitan
area, to include Multnomah, Washington,
Clackamas, Yamhill, & Columbia counties;
Lane, Douglas, Coos & Curry Counties in                                               Active Listings       Closed Sales
Oregon; portions of other Oregon Counties;
and Clark, Cowlitz & Pacific Counties in
Washington.
   RMLS™ was formed by area Boards and
Associations of REALTORS® in 1991.                                                             Gary Whiting, Chairman of the Board
    E-mail subscriptions are available for
$45 per year by contacting RMLS™, (503)
                                                                                               Kurt von Wasmuth, President/CEO
236-7657. Reproduction of any portion of                                                       Natalie Middleton, Editor
this copyrighted material is prohibited                                                        Kelsey Brunson, Assistant Editor
without prior approval of RMLS™.


                                                            © Copyright RMLS™ 2010. All Rights Reserved.

Weitere ähnliche Inhalte

Andere mochten auch

Portland, OR area Real Estate Summary Sept 2013
Portland, OR area Real Estate Summary Sept 2013Portland, OR area Real Estate Summary Sept 2013
Portland, OR area Real Estate Summary Sept 2013Bill McKee
 
Rules For Radicals Slide Summary For Afp Final
Rules For Radicals Slide Summary For Afp FinalRules For Radicals Slide Summary For Afp Final
Rules For Radicals Slide Summary For Afp FinalBill McKee
 
Attribuzione Causale1
Attribuzione Causale1Attribuzione Causale1
Attribuzione Causale1psociale
 
Attribuzione Causale2
Attribuzione Causale2Attribuzione Causale2
Attribuzione Causale2psociale
 
Platform Description
Platform DescriptionPlatform Description
Platform DescriptionPlarent Ymeri
 
Tatsuo Nakajima
Tatsuo NakajimaTatsuo Nakajima
Tatsuo NakajimaPersuasive
 
E Learning @ Qite
E Learning @ QiteE Learning @ Qite
E Learning @ QiteQPoint
 
DS Expo2009 Bfdv6
DS Expo2009 Bfdv6DS Expo2009 Bfdv6
DS Expo2009 Bfdv6hpatel
 
Atteggiamenti
AtteggiamentiAtteggiamenti
Atteggiamentipsociale
 

Andere mochten auch (12)

Portland, OR area Real Estate Summary Sept 2013
Portland, OR area Real Estate Summary Sept 2013Portland, OR area Real Estate Summary Sept 2013
Portland, OR area Real Estate Summary Sept 2013
 
Rules For Radicals Slide Summary For Afp Final
Rules For Radicals Slide Summary For Afp FinalRules For Radicals Slide Summary For Afp Final
Rules For Radicals Slide Summary For Afp Final
 
Attribuzione Causale1
Attribuzione Causale1Attribuzione Causale1
Attribuzione Causale1
 
Attribuzione Causale2
Attribuzione Causale2Attribuzione Causale2
Attribuzione Causale2
 
Literacy
LiteracyLiteracy
Literacy
 
Platform Description
Platform DescriptionPlatform Description
Platform Description
 
Tatsuo Nakajima
Tatsuo NakajimaTatsuo Nakajima
Tatsuo Nakajima
 
Concepts I Teach
Concepts I TeachConcepts I Teach
Concepts I Teach
 
Ichiro Satoh
Ichiro SatohIchiro Satoh
Ichiro Satoh
 
E Learning @ Qite
E Learning @ QiteE Learning @ Qite
E Learning @ Qite
 
DS Expo2009 Bfdv6
DS Expo2009 Bfdv6DS Expo2009 Bfdv6
DS Expo2009 Bfdv6
 
Atteggiamenti
AtteggiamentiAtteggiamenti
Atteggiamenti
 

Kürzlich hochgeladen

Call Girls in Inderpuri Delhi 💯Call Us 🔝8264348440🔝
Call Girls in Inderpuri Delhi 💯Call Us 🔝8264348440🔝Call Girls in Inderpuri Delhi 💯Call Us 🔝8264348440🔝
Call Girls in Inderpuri Delhi 💯Call Us 🔝8264348440🔝soniya singh
 
Call Girls In The Lalit New Delhi ❤️8860477959 Good Looking Escorts In 24/7 D...
Call Girls In The Lalit New Delhi ❤️8860477959 Good Looking Escorts In 24/7 D...Call Girls In The Lalit New Delhi ❤️8860477959 Good Looking Escorts In 24/7 D...
Call Girls In The Lalit New Delhi ❤️8860477959 Good Looking Escorts In 24/7 D...lizamodels9
 
The Omaxe State Dwarka Delhi-broucher.pdf.pdf
The Omaxe State Dwarka Delhi-broucher.pdf.pdfThe Omaxe State Dwarka Delhi-broucher.pdf.pdf
The Omaxe State Dwarka Delhi-broucher.pdf.pdfkratirudram
 
Prestige Rainbow Waters Raidurgam, Gachibowli Hyderabad E- Brochure.pdf
Prestige Rainbow Waters Raidurgam, Gachibowli Hyderabad E- Brochure.pdfPrestige Rainbow Waters Raidurgam, Gachibowli Hyderabad E- Brochure.pdf
Prestige Rainbow Waters Raidurgam, Gachibowli Hyderabad E- Brochure.pdffaheemali990101
 
Shapoorji Pallonji Parkwest Sequoia Tower Bangalore.pdf
Shapoorji Pallonji Parkwest Sequoia Tower Bangalore.pdfShapoorji Pallonji Parkwest Sequoia Tower Bangalore.pdf
Shapoorji Pallonji Parkwest Sequoia Tower Bangalore.pdfashiyadav24
 
MADHUGIRI FARM LAND BROCHURES (11)_compressed (1).pdf
MADHUGIRI FARM LAND BROCHURES (11)_compressed (1).pdfMADHUGIRI FARM LAND BROCHURES (11)_compressed (1).pdf
MADHUGIRI FARM LAND BROCHURES (11)_compressed (1).pdfknoxdigital1
 
LCAR Unit 22 - Leasing and Property Management - 14th Edition Revised.pptx
LCAR Unit 22 - Leasing and Property Management - 14th Edition Revised.pptxLCAR Unit 22 - Leasing and Property Management - 14th Edition Revised.pptx
LCAR Unit 22 - Leasing and Property Management - 14th Edition Revised.pptxTom Blefko
 
Call Girls in Kashmiri Gate Delhi 💯Call Us 🔝8264348440🔝
Call Girls in Kashmiri Gate Delhi 💯Call Us 🔝8264348440🔝Call Girls in Kashmiri Gate Delhi 💯Call Us 🔝8264348440🔝
Call Girls in Kashmiri Gate Delhi 💯Call Us 🔝8264348440🔝soniya singh
 
call girls in Shahdara (DELHI) 🔝 >༒9953330565🔝 genuine Escort Service 🔝✔️✔️
call girls in Shahdara (DELHI) 🔝 >༒9953330565🔝 genuine Escort Service 🔝✔️✔️call girls in Shahdara (DELHI) 🔝 >༒9953330565🔝 genuine Escort Service 🔝✔️✔️
call girls in Shahdara (DELHI) 🔝 >༒9953330565🔝 genuine Escort Service 🔝✔️✔️9953056974 Low Rate Call Girls In Saket, Delhi NCR
 
Call Girls In Mayur Vihar-1 Delhi ❤️8860477959 Good Looking Escorts In 24/7 D...
Call Girls In Mayur Vihar-1 Delhi ❤️8860477959 Good Looking Escorts In 24/7 D...Call Girls In Mayur Vihar-1 Delhi ❤️8860477959 Good Looking Escorts In 24/7 D...
Call Girls In Mayur Vihar-1 Delhi ❤️8860477959 Good Looking Escorts In 24/7 D...lizamodels9
 
Covid 19 and Market Impact during the Pandemic
Covid 19 and Market Impact during the PandemicCovid 19 and Market Impact during the Pandemic
Covid 19 and Market Impact during the PandemicTim Wilmath
 
Sobha Aranya Sector 80 Gurgaon E- Brochure.pdf
Sobha Aranya Sector 80 Gurgaon E- Brochure.pdfSobha Aranya Sector 80 Gurgaon E- Brochure.pdf
Sobha Aranya Sector 80 Gurgaon E- Brochure.pdffaheemali990101
 
Affordable and Quality Construction SVTN's Signature Blend of Cost-Efficiency...
Affordable and Quality Construction SVTN's Signature Blend of Cost-Efficiency...Affordable and Quality Construction SVTN's Signature Blend of Cost-Efficiency...
Affordable and Quality Construction SVTN's Signature Blend of Cost-Efficiency...AditiAlishetty
 
Rustomjee The Panorama At Pali Hill, Bandra West, Mumbai - Brochure.pdf
Rustomjee The Panorama At Pali Hill, Bandra West, Mumbai - Brochure.pdfRustomjee The Panorama At Pali Hill, Bandra West, Mumbai - Brochure.pdf
Rustomjee The Panorama At Pali Hill, Bandra West, Mumbai - Brochure.pdfmonikasharma630
 
SSPL The Strand Abodes Kharadi Pune Brochure.pdf
SSPL The Strand Abodes Kharadi Pune Brochure.pdfSSPL The Strand Abodes Kharadi Pune Brochure.pdf
SSPL The Strand Abodes Kharadi Pune Brochure.pdfabbu831446
 
Brigade Neopolis Kokapet, Hyderabad E- Brochure
Brigade Neopolis Kokapet, Hyderabad E- BrochureBrigade Neopolis Kokapet, Hyderabad E- Brochure
Brigade Neopolis Kokapet, Hyderabad E- Brochurefaheemali990101
 
9990771857 Call Girls in Noida Sector 10 Noida (Call Girls) Delhi
9990771857 Call Girls in Noida Sector 10 Noida (Call Girls) Delhi9990771857 Call Girls in Noida Sector 10 Noida (Call Girls) Delhi
9990771857 Call Girls in Noida Sector 10 Noida (Call Girls) Delhidelhimodel235
 
Purva Palm Hills Devanahalli, Bangalore E- Brochure.pdf
Purva Palm Hills Devanahalli, Bangalore E- Brochure.pdfPurva Palm Hills Devanahalli, Bangalore E- Brochure.pdf
Purva Palm Hills Devanahalli, Bangalore E- Brochure.pdffaheemali990101
 

Kürzlich hochgeladen (20)

Call Girls in Inderpuri Delhi 💯Call Us 🔝8264348440🔝
Call Girls in Inderpuri Delhi 💯Call Us 🔝8264348440🔝Call Girls in Inderpuri Delhi 💯Call Us 🔝8264348440🔝
Call Girls in Inderpuri Delhi 💯Call Us 🔝8264348440🔝
 
Call Girls In The Lalit New Delhi ❤️8860477959 Good Looking Escorts In 24/7 D...
Call Girls In The Lalit New Delhi ❤️8860477959 Good Looking Escorts In 24/7 D...Call Girls In The Lalit New Delhi ❤️8860477959 Good Looking Escorts In 24/7 D...
Call Girls In The Lalit New Delhi ❤️8860477959 Good Looking Escorts In 24/7 D...
 
9953056974 Low Rate Call Girls In Saket, Delhi NCR
9953056974 Low Rate Call Girls In Saket, Delhi NCR9953056974 Low Rate Call Girls In Saket, Delhi NCR
9953056974 Low Rate Call Girls In Saket, Delhi NCR
 
The Omaxe State Dwarka Delhi-broucher.pdf.pdf
The Omaxe State Dwarka Delhi-broucher.pdf.pdfThe Omaxe State Dwarka Delhi-broucher.pdf.pdf
The Omaxe State Dwarka Delhi-broucher.pdf.pdf
 
Prestige Rainbow Waters Raidurgam, Gachibowli Hyderabad E- Brochure.pdf
Prestige Rainbow Waters Raidurgam, Gachibowli Hyderabad E- Brochure.pdfPrestige Rainbow Waters Raidurgam, Gachibowli Hyderabad E- Brochure.pdf
Prestige Rainbow Waters Raidurgam, Gachibowli Hyderabad E- Brochure.pdf
 
Shapoorji Pallonji Parkwest Sequoia Tower Bangalore.pdf
Shapoorji Pallonji Parkwest Sequoia Tower Bangalore.pdfShapoorji Pallonji Parkwest Sequoia Tower Bangalore.pdf
Shapoorji Pallonji Parkwest Sequoia Tower Bangalore.pdf
 
MADHUGIRI FARM LAND BROCHURES (11)_compressed (1).pdf
MADHUGIRI FARM LAND BROCHURES (11)_compressed (1).pdfMADHUGIRI FARM LAND BROCHURES (11)_compressed (1).pdf
MADHUGIRI FARM LAND BROCHURES (11)_compressed (1).pdf
 
LCAR Unit 22 - Leasing and Property Management - 14th Edition Revised.pptx
LCAR Unit 22 - Leasing and Property Management - 14th Edition Revised.pptxLCAR Unit 22 - Leasing and Property Management - 14th Edition Revised.pptx
LCAR Unit 22 - Leasing and Property Management - 14th Edition Revised.pptx
 
Call Girls in Kashmiri Gate Delhi 💯Call Us 🔝8264348440🔝
Call Girls in Kashmiri Gate Delhi 💯Call Us 🔝8264348440🔝Call Girls in Kashmiri Gate Delhi 💯Call Us 🔝8264348440🔝
Call Girls in Kashmiri Gate Delhi 💯Call Us 🔝8264348440🔝
 
call girls in Shahdara (DELHI) 🔝 >༒9953330565🔝 genuine Escort Service 🔝✔️✔️
call girls in Shahdara (DELHI) 🔝 >༒9953330565🔝 genuine Escort Service 🔝✔️✔️call girls in Shahdara (DELHI) 🔝 >༒9953330565🔝 genuine Escort Service 🔝✔️✔️
call girls in Shahdara (DELHI) 🔝 >༒9953330565🔝 genuine Escort Service 🔝✔️✔️
 
Call Girls In Mayur Vihar-1 Delhi ❤️8860477959 Good Looking Escorts In 24/7 D...
Call Girls In Mayur Vihar-1 Delhi ❤️8860477959 Good Looking Escorts In 24/7 D...Call Girls In Mayur Vihar-1 Delhi ❤️8860477959 Good Looking Escorts In 24/7 D...
Call Girls In Mayur Vihar-1 Delhi ❤️8860477959 Good Looking Escorts In 24/7 D...
 
Covid 19 and Market Impact during the Pandemic
Covid 19 and Market Impact during the PandemicCovid 19 and Market Impact during the Pandemic
Covid 19 and Market Impact during the Pandemic
 
Sobha Aranya Sector 80 Gurgaon E- Brochure.pdf
Sobha Aranya Sector 80 Gurgaon E- Brochure.pdfSobha Aranya Sector 80 Gurgaon E- Brochure.pdf
Sobha Aranya Sector 80 Gurgaon E- Brochure.pdf
 
Affordable and Quality Construction SVTN's Signature Blend of Cost-Efficiency...
Affordable and Quality Construction SVTN's Signature Blend of Cost-Efficiency...Affordable and Quality Construction SVTN's Signature Blend of Cost-Efficiency...
Affordable and Quality Construction SVTN's Signature Blend of Cost-Efficiency...
 
Rustomjee The Panorama At Pali Hill, Bandra West, Mumbai - Brochure.pdf
Rustomjee The Panorama At Pali Hill, Bandra West, Mumbai - Brochure.pdfRustomjee The Panorama At Pali Hill, Bandra West, Mumbai - Brochure.pdf
Rustomjee The Panorama At Pali Hill, Bandra West, Mumbai - Brochure.pdf
 
SSPL The Strand Abodes Kharadi Pune Brochure.pdf
SSPL The Strand Abodes Kharadi Pune Brochure.pdfSSPL The Strand Abodes Kharadi Pune Brochure.pdf
SSPL The Strand Abodes Kharadi Pune Brochure.pdf
 
Brigade Neopolis Kokapet, Hyderabad E- Brochure
Brigade Neopolis Kokapet, Hyderabad E- BrochureBrigade Neopolis Kokapet, Hyderabad E- Brochure
Brigade Neopolis Kokapet, Hyderabad E- Brochure
 
9990771857 Call Girls in Noida Sector 10 Noida (Call Girls) Delhi
9990771857 Call Girls in Noida Sector 10 Noida (Call Girls) Delhi9990771857 Call Girls in Noida Sector 10 Noida (Call Girls) Delhi
9990771857 Call Girls in Noida Sector 10 Noida (Call Girls) Delhi
 
young call girls in Lajpat Nagar,🔝 9953056974 🔝 escort Service
young call girls in Lajpat Nagar,🔝 9953056974 🔝 escort Serviceyoung call girls in Lajpat Nagar,🔝 9953056974 🔝 escort Service
young call girls in Lajpat Nagar,🔝 9953056974 🔝 escort Service
 
Purva Palm Hills Devanahalli, Bangalore E- Brochure.pdf
Purva Palm Hills Devanahalli, Bangalore E- Brochure.pdfPurva Palm Hills Devanahalli, Bangalore E- Brochure.pdf
Purva Palm Hills Devanahalli, Bangalore E- Brochure.pdf
 

Portland Or Metro home sales, listings and stats

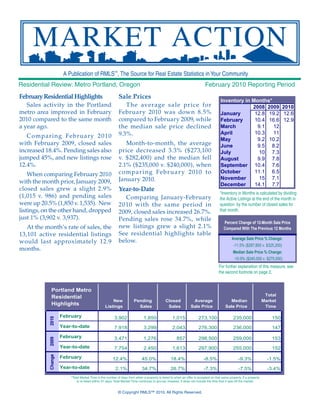
  • 1. A Publication of RMLS™, The Source for Real Estate Statistics in Your Community Residential Review: Metro Portland, Oregon February 2010 Reporting Period February Residential Highlights Sale Prices Inventory in Months* Sales activity in the Portland T he average sa le pr ice for 2008 2009 2010 metro area improved in February February 2010 was down 8.5% January 12.8 19.2 12.6 2010 compared to the same month compared to February 2009, while February 10.4 16.6 12.9 a year ago. the median sale price declined March 9.1 12 9.3%. April 10.3 11 Comparing February 2010 May 9.2 10.2 with February 2009, closed sales Month-to-month, the average June 9.5 8.2 increased 18.4%. Pending sales also price decreased 3.3% ($273,100 July 10 7.3 jumped 45%, and new listings rose v. $282,400) and the median fell August 9.9 7.8 12.4%. 2.1% ($235,000 v. $240,000), when September 10.4 7.6 compa r i ng Febr u a r y 2010 to October 11.1 6.5 When comparing February 2010 January 2010. November 15 7.1 with the month prior, January 2009, December 14.1 7.7 closed sales grew a slight 2.9% Year-to-Date *Inventory in Months is calculated by dividing (1,015 v. 986) and pending sales Comparing January-February the Active Listings at the end of the month in were up 20.5% (1,850 v. 1,535). New 2010 with the same period in question by the number of closed sales for listings, on the other hand, dropped 2009, closed sales increased 26.7%. that month. just 1% (3,902 v. 3,937). Pending sales rose 34.7%, while Percent Change of 12-Month Sale Price At the month’s rate of sales, the new listings grew a slight 2.1% Compared With The Previous 12 Months 13,101 active residential listings See residential highlights table Average Sale Price % Change: would last approximately 12.9 below. -11.5% ($287,800 v. $325,200) months. Median Sale Price % Change: -10.9% ($245,000 v. $275,000) For further explanation of this measure, see the second footnote on page 2. Portland Metro Total Residential New Pending Closed Average Median Market Highlights Listings Sales Sales Sale Price Sale Price Time February 3,902 1,850 1,015 273,100 235,000 150 2010 Year-to-date 7,918 3,299 2,043 276,300 236,000 147 February 3,471 1,276 857 298,500 259,000 153 2009 Year-to-date 7,754 2,450 1,613 297,900 255,000 152 February Change 12.4% 45.0% 18.4% -8.5% -9.3% -1.5% Year-to-date 2.1% 34.7% 26.7% -7.3% -7.5% -3.4% *Total Market Time is the number of days from when a property is listed to when an offer is accepted on that same property. If a property is re-listed within 31 days, Total Market Time continues to accrue; however, it does not include the time that it was off the market. © Copyright RMLS™ 2010. All Rights Reserved.
  • 2. AREA REPORT • 2/2010 AREA REPORT ● 1/2010& Portland Metro Area Metro Portland ● Adjacent Regions, Oregon RESIDENTIAL COMMERCIAL LAND MULTIFAMILY Current Month Year-To-Date Year-To-Date Year-To-Date Year-To-Date Pending Sales 2010 v. 20091 Pending Sales 2010 v. 2009 Avg. Sale Price % Change2 Expired/Canceled Listings Pending Sales 2010 Pending Sales 2010 Total Market Time 4 Average Sale Price Average Sale Price Average Sale Price Average Sale Price Average Sale Price Median Sale Price Active Listings New Listings3 Closed Sales Closed Sales Closed Sales Closed Sales Closed Sales New Listings 141 N Portland 425 145 73 88 41.9% 41 238,300 74 299 154 36.3% 73 239,600 225,000 -10.8% - - 5 74,000 2 272,600 142 NE Portland 971 391 141 176 33.3% 99 275,000 114 757 326 25.4% 202 274,800 243,800 -10.7% 1 600,000 8 121,400 10 323,400 143 SE Porltand 1,329 464 197 273 56.9% 139 227,400 119 921 461 30.2% 292 226,700 197,900 -11.7% 3 211,700 4 66,600 11 455,000 Gresham/ 144 Troutdale 942 241 109 125 33.0% 78 196,700 162 545 226 41.3% 151 204,200 190,000 -14.2% 1 255,200 8 78,600 1 212,000 Milwaukie/ 145 Clackamas 968 274 97 138 22.1% 69 250,300 136 611 239 21.9% 136 252,700 235,000 -8.2% 1 95,000 7 117,900 1 130,000 Oregon City/ 146 Canby 807 215 86 82 78.3% 48 274,400 149 421 160 44.1% 118 251,300 221,400 -11.4% 2 45,000 8 160,700 2 378,300 Lake Oswego/ 147 West Linn 981 251 104 84 52.7% 45 457,700 153 535 154 49.5% 96 432,200 360,000 -9.7% 2 370,000 3 198,300 - - 148 W Portland 1,612 462 235 179 67.3% 100 408,300 208 920 317 49.5% 213 415,200 315,000 -10.8% - - 1 146,000 4 818,900 149 NW Wash Co. 502 191 83 98 40.0% 49 349,700 144 350 162 38.5% 95 361,600 340,000 -9.8% - - 4 161,000 - - Beaverton/ 150 Aloha 1,047 370 148 206 56.1% 108 237,100 168 767 354 38.3% 198 238,500 217,600 -12.2% 1 255,000 2 103,800 4 153,000 Tigard/ 151 Wilsonville 1,095 318 117 128 24.3% 80 314,500 184 647 259 35.6% 170 313,800 295,500 -8.5% 1 245,000 3 150,800 5 289,000 Hillsboro/ 152 Forest Grove 900 275 83 146 50.5% 66 227,200 138 513 246 24.9% 135 242,900 213,000 -10.9% - - 6 96,700 4 167,700 153 Mt. Hood 136 25 17 6 20.0% 8 238,400 228 43 13 30.0% 14 260,700 227,500 -1.4% - - 3 114,000 - - 155 Columbia Co. 477 111 45 40 66.7% 34 202,000 183 217 78 32.2% 59 189,200 184,000 -14.6% - - 2 121,000 1 155,000 156 Grand Yamhill Co. Total 909 13,101 169 3,902 99 1,634 81 1,850 30.6% -4.1% 51 1,015 190,000 273,100 154 150 372 7,918 150 3,299 35.1% -85.7% 91 2,043 198,000 276,300 190,000 236,000 -16.0% -11.5% 1 13 285,000 3 67 67,300 115,800 -45 - 356,500 168-178 Marion/Polk Counties 1,070 240 99 80 66.7% 42 274,200 177 439 142 42.0% 87 235,800 196,000 -14.9% - - 5 177,800 4 170,800 180-195 North Coastal Counties 1,340 209 99 63 85.3% 51 264,500 210 428 135 80.0% 87 256,800 210,000 -15.9% - - 8 218,100 - - 1 Percent change in number of pending sales this year compared to last year. The Current Month section compares February 2010 with February 2009. The Year-To- Date section compares year-to-date statistics from February 2010 with year-to-date statistics from February 2009. 2 % Change is based on a comparison of the rolling average sale price for the last 12 months (3/1/09-2/28/10) with 12 months before (3/1/08-2/28/09). 3 As of October 2007, the way that New Listing data is generated has changed to ensure accuracy. 4 Total Market Time is the number of days from when a property is listed to when an offer is accepted on that same property. If a property is re-listed within 31 days, Total Market Time continues to accrue; however, it does not include the time that it was off the market. 2 © Copyright RMLS™ 2010. All Rights Reserved.
  • 3. ACTIVE Active Residential Listings RESIDENTIAL 20000 LISTINGS 18000 PORTLAND, OR 16000 This graph shows the active 14000 12000 residential listings over the 10000 8000 past three calendar years 6000 in the greater Portland, 4000 Oregon metropolitan area. 2008 2009 2010 TOTAL ACTIVE Total Active Listings LISTINGS PORTLAND, OR 25000 22500 This graph shows the 20000 total active listings over 17500 15000 the past three calendar 12500 years in the greater 10000 7500 Portland, Oregon 5000 metropolitan area. Total Active Listings 2008 Total Active Listings 2009 Total Active Listings 2010 NEW LISTINGS New Listings PORTLAND, OR 6,000 This graph shows the 5,000 new residential listings 4,000 over the past three 3,000 2,000 calendar years in the 1,000 greater Portland, Oregon 0 metropolitan area. 2008 2009 2010 3 © Copyright RMLS™ 2010. All Rights Reserved.
  • 4. PENDING LISTINGS Pending Sales PORTLAND, OR 2,500 This graph represents 2,000 monthly accepted offers in the Portland, Oregon 1,500 metropolitan area over 1,000 the past three calendar 500 years. 0 2008 2009 2010 CLOSED SALES Closed Sales PORTLAND, OR This graph shows the 2,500 closed sales over the past 2,000 three calendar years in 1,500 the greater Portland, 1,000 Oregon metropolitan 500 area. 0 2008 2009 2010 Average Market Time DAYS ON MARKET 180 PORTLAND, OR 160 This graph shows the 140 120 average market time for 100 80 sales in the Portland, 60 40 Oregon metropolitan area. 20 *As of August 2008, graph 0 now reports “Total Days on Market” - for details 2008 2009 TMT 2008 TMT 2010 TMT read footnotes on page 2. 4 © Copyright RMLS™ 2010. All Rights Reserved.
  • 5. AVERAGE SALE This graph represents the average sale price for all homes sold in the Portland, PRICE Oregon metropolitan area. PORTLAND, OR Average Sale Price $400,000 $350,000 $300,000 $250,000 $200,000 $150,000 $100,000 Jan-00 Jul-00 Jan-01 Jul-01 Jan-02 Jul-02 Jan-03 Jul-03 Jan-04 Jul-04 Jan-05 Jul-05 Jan-06 Jul-06 Jan-07 Jul-07 Jan-08 Jul-08 Jan-09 Jul-09 Jan-10 Median Sale Price: Portland, OR & Clark Co., WA MEDIAN SALE PRICE 260000 PORTLAND, OR 240000 This graph shows the 220000 median sale price over 200000 the past 12 months in the 180000 160000 greater Portland, Oregon 140000 metropolitan area and 120000 Clark County. 100000 MAR APR MAY JUNE JULY AUG SEPT OCT NOV DEC JAN FEB Clark County Metro Portland, OR 5 © Copyright RMLS™ 2010. All Rights Reserved.
  • 6. MEDIAN SALE PRICE February 2010 SW WAShINGTON $225,000 $130,000 Woodland N/NE Clark County $199,900 PORTLAND $295,000 Battle Ground Ridgefield/La Center METRO $182,000 Columbia County $265,000 $264,000 Salmon Creek Brush Prairie $227,300 Hockinson Felida $180,000 $337,500 Hazel $180,000 5 Corners Dell Orch. North Washington County Minnehaha $171,900 $180,000 Sauvie Island Cent. Vancouver Cascade Park $175,000 Heights $237,300 $290,000 N Portland Camas/Washougal $245,000 NE $206,500 Portland $331,300 Hillsboro West $186,000 $209,900 Gresham Forest Grove Portland $214,000 SE Troutdale Portland Sandy Beaverton Corbett Aloha $230,000 Fairview $227,500 Milwaukie/Gladstone/ Mt. Hood: Boring/Clackamas Zigzag Estacada $300,000 $400,000 Welches Rhododendron Tigard/Tualatin Wemme Sherwood Lake Oswego Brightwood Wilsonville West Government Camp Linn $179,000 Yamhill County $241,300 Oregon City Canby Molalla Beavercreek 6 © Copyright RMLS™ 2010. All Rights Reserved.
  • 7. MULTIPLE LISTING SERVICE Corporate MEDIAN SALE This graph represents the median sale price for all 825 NE Multnomah, Suite 270 PRICE CONDOS condos sold in the last three calendar years in the Portland, OR 97232 (503) 236-7657 PORTLAND, OR Fax: (503) 230-0689 Portland, Oregon metropolitan area. Southwest Washington 1514 Broadway, Suite 101 Vancouver, WA 98663 Median Condo Sale Price (360) 696-0718 Fax: (360) 696-9342 $250,000 Salem 2110 Mission St. SE, Suite 305 Salem, OR 97302 $225,000 (503) 587-8810 Fax: (503) 585-3817 Lane County: Eugene $200,000 2139 Centennial Plaza Eugene, OR 97401 $175,000 (541) 686-2885 Fax: (541) 484-3854 Lane County: Florence $150,000 PO Box 414 Florence, OR 97439 (541) 902-2560 Fax: (541) 902-1341 Douglas County 2008 2009 2010 3510 NE Edenbower Roseburg, OR 97470 (541) 673-3571 Fax: (541) 673-6581 Curry County PO Box 6307 Brookings, OR 97415 ACTIVE & CLOSED This graph shows the number of active and closed (541) 469-0219 CONDOS Fax: (541) 469-9695 condos in the Portland, Oregon metropolitan area. Mid-Columbia PORTLAND, OR PO Box 1088 Hood River, OR 97031 (541) 436-2956 Fax: (541) 387-6657 Active & Closed Condos Eastern Oregon PO Box 751 Hermiston, OR 97838 2,500 (541) 567-5186 Fax: (541) 289-7320 2,000 Coos County 1946 Sherman Ave., Suite 101 North Bend, OR 97459 1,500 (541) 751-1070 Fax: (541) 751-1083 1,000 The statistics presented in Market Action are compiled monthly based on 500 figures generated by RMLS™. Statistics reflect reported activity for 0 the greater Portland, Oregon metropolitan area, to include Multnomah, Washington, Clackamas, Yamhill, & Columbia counties; Lane, Douglas, Coos & Curry Counties in Active Listings Closed Sales Oregon; portions of other Oregon Counties; and Clark, Cowlitz & Pacific Counties in Washington. RMLS™ was formed by area Boards and Associations of REALTORS® in 1991. Gary Whiting, Chairman of the Board E-mail subscriptions are available for $45 per year by contacting RMLS™, (503) Kurt von Wasmuth, President/CEO 236-7657. Reproduction of any portion of Natalie Middleton, Editor this copyrighted material is prohibited Kelsey Brunson, Assistant Editor without prior approval of RMLS™. © Copyright RMLS™ 2010. All Rights Reserved.