Israel overview v3
•
0 gefällt mir•673 views

Israel Overview. The urban planning perspective.

Empfohlen
Weitere ähnliche Inhalte
Was ist angesagt?
Was ist angesagt? (20)
Ähnlich wie Israel overview v3
Ähnlich wie Israel overview v3 (20)
Mehr von Nachman Shelef
Mehr von Nachman Shelef (20)
Kürzlich hochgeladen
Kürzlich hochgeladen (20)
Israel overview v3
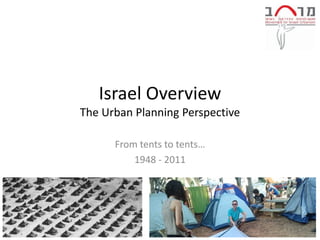
- 1. Israel Overview The Urban Planning Perspective From tents to tents… 1948 - 2011
- 2. Ancient Cities … easily recognizable names, most are active cities today, some are archeological sites. Source for most of our World Heritage Sites: • Jerusalem, • Acre, • Massada, • The white City of Tel Aviv, • The Biblical Tels (Megiddo, Hazor, Lachish, Beersheba), • The Incense Route and Desert Towns (Mamshit, Ovdat, Shivta, Nizana).
- 3. Independence and the Sharon Plan 1952 • Main objectives – Settle the many immigrants and refugees in housing – Disperse the population to fill the entire area of the newly formed state IPhP 1952
- 4. Independence and the Sharon Plan 1952 IPhP 1952
- 5. IPhP 1952 NOP 31 1993 IMP 2020 1997 NOP 35 2005
- 6. National Outline Plan 35 – 2005 Main Objectives • Fully and flexibly provide for the varied demands. • Narrow the gaps between groups and regions: cultural diversity & instrumental collaboration. • Strengthen cities and discourage suburban sprawl. • Preserve open space, agriculture, rural landscapes and cultural heritage. • Accelerate development of Public Transport. • Attend to neighboring populations and areas. • Sustainably utilize environmental resources. • Establish a clear and recognizable Spatial Structure: – Emphasis on Jerusalem, the Negev and the Galilee. – Four metropolitan regions. – The National Green Spine and Green Buffers NOP 35 2005
- 7. Facts & Figures 2009 City Population Density [pop/sqKm] Jerusalem 773,000 6,175 • Population of 7.6 Million, Growth 1.8% Tel Aviv-Yafo 403,700 7,792 Haifa 265,600 3,853 • Urban 92% in: 220 Cities and Towns Rishon LeZiyyon 228,200 3,887 • Agricultural 8% in: 985 Villages Petah Tiqwa 209,600 5,841 Ashdod 206,400 4,043 • Area: 22,150 SqKm, Be'er Sheva 194,300 1,654 Holon 184,700 9,760 Density of • Average Density: 329 Per/SqKm Netanya 183,200 6,327 Bene Beraq 154,400 21,031 leading world cities High country density but Ramat Gan 145,000 8,908 Manhattan 32,000 Bat Yam 130,000 15,913 Ville de Paris 24,000 low city density Rehovot 112,700 4,890 Barcelona Eixample 35,000 London Camden 14,000 Ashqelon 111,900 2,340
- 9. Growth in Israel 2010 2030 7.6M 10M • Population 2.3M 3.3M • Households • Area • Cars 2M ~5M • Vehicle Km 34B 70B Traveled
- 10. Israeli Economy
- 11. WEF Global Competitiveness Index 2009-2010 The World Economic Forum ranked Israel 27th out of 134 countries for 2009-2010 Source: World Economic Forum, Global Competitiveness Index, 2009-2010
- 12. Tel-Aviv – the 52nd largest metro economy in the world and #50 in GDP per capita Tel-Aviv Metro Area 43% of Population on 7% of Area produces 59% of GDP
- 13. LED in the Context of Cities LED in a Great City LED in the Region of a Great City LED in a Town Outside a Great City Region LED in a City that is not Great Beer-Sheba
- 14. The Great City LED in a Great City LED in the Region of a Great City LED in a Town Outside a Great City Region LED in a City that is not Great
- 15. in the Region of a Great City Beer-Sheba
- 16. Cities that are not Great Beer-Sheba
- 17. Towns Outside a Great City Region Beer-Sheba
- 18. Due to their poor design - Most Israeli cities do not provide their residents with the economic, social and cultural opportunities to realize their full potential as individuals or as a community. We can do much better!!!
- 19. The Social Justice Movement • Started as a housing crisis. – What did not lead to the crisis? – What did lead to the crisis? – What can be done differently? – What additional budgets are needed? – What can be the role of NGOs?
- 20. What did not lead to the crisis? • It is not a lack of land designated and marketed for building – There is more land designated for building than is need for the next 20 years • It is not a failure of the “free market” – There is no free market in the Israeli real-estate market, it is all centrally controlled • It is not the failure of the bureaucracy to approve enough plans – There are approved plans for over 160,000 dwelling units that no-one wants to build
- 21. What did lead to the crisis? 1. Limits on urban development that do not enable reaching the necessary density for success and prosperity of cities. 2. Mass development of car dependent sleep only suburbs that require their residents to buy cars and waste time and money every day on them. 3. Urban planning that encourages and facilitates construction on open space at the edge of towns while neglecting the inner cities. 4. Design that encourages use of private vehicles and inefficient public transportation based on outdated concepts. 5. Archaic planning system, hierarchical, cumbersome and not committed to the residents nor to promoting the true interests of the state.
- 22. What can be done differently? 1. Urban densification in the periphery and intermediate cities. 2. Changes in the urban density policies of Tama35. 3. Preference and promotion for the development of the older neighborhoods in the city centers rather than in open areas outside the city. 4. Reducing standards and expropriations for "public purposes" in municipal plans. 5. Development of efficient, frequent and convenient public transport. 6. Build neighborhoods with a wide variety of residence types rather than homogeneous neighborhoods for the rich. 7. Reforming the planning system and empowering the local planning committees.
- 23. What additional budgets are needed? • The 52B ₪ annual building budget is plenty! • The issue is how it is used not how do we increase it.
- 24. What can be the role of NGOs? • Be the catalyst for social change of a social problem that cuts across all populations but afflicts marginalized populations the most – Awareness • Affordable access to opportunities is tightly linked to city design • Grass roots level as well as government – Tools • For building cities and towns around people not cars • For participatory planning, budgeting and governance • Model projects based on tools – Policies • Research to inform policy makers • Lobbying for policy change and participating in committees – Processes • Translate new policies to processes • Training on new policies and processes
- 26. Israel Overview nachman@miu.org.il 2011