WJEC Geography notes for G2
•Als ODP, PDF herunterladen•
32 gefällt mir•27,828 views

This document provides information on types of human settlements from megacities to hamlets. It discusses features of different settlement sizes and their typical populations. Models of urban structure are also summarized, including Burgess, Hoyt, Harris-Ullman, and Mann's models. The advantages and limitations of each model are highlighted. Further topics covered include studentification, ghettoization, counter-urbanization, and inner city decline. Case studies are presented on London Docklands as an example of regeneration.

Empfohlen
Weitere ähnliche Inhalte
Was ist angesagt?
Was ist angesagt? (20)
Andere mochten auch
Andere mochten auch (13)
Ähnlich wie WJEC Geography notes for G2
Ähnlich wie WJEC Geography notes for G2 (20)
Kürzlich hochgeladen
Kürzlich hochgeladen (20)
WJEC Geography notes for G2
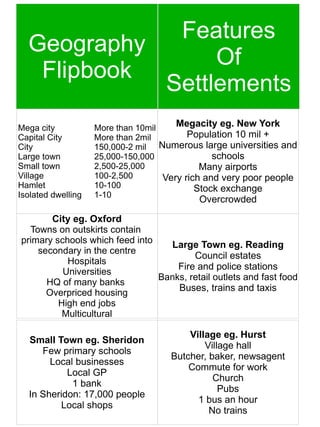
- 1. Features Geography Of Flipbook Settlements Mega city More than 10mil Megacity eg. New York Capital City More than 2mil Population 10 mil + City 150,000-2 mil Numerous large universities and Large town 25,000-150,000 schools Small town 2,500-25,000 Many airports Village 100-2,500 Very rich and very poor people Hamlet 10-100 Stock exchange Isolated dwelling 1-10 Overcrowded City eg. Oxford Towns on outskirts contain primary schools which feed into Large Town eg. Reading secondary in the centre Council estates Hospitals Fire and police stations Universities Banks, retail outlets and fast food HQ of many banks Overpriced housing Buses, trains and taxis High end jobs Multicultural Village eg. Hurst Small Town eg. Sheridon Village hall Few primary schools Butcher, baker, newsagent Local businesses Commute for work Local GP Church 1 bank Pubs In Sheridon: 17,000 people 1 bus an hour Local shops No trains
- 2. Rural-Urban Continuum No human inhabited place is truly urban or truly rural, they are all shades of grey within the Structure continuum, though many are closer to one than the other. Of there are not always clear boundaries, but may be some Settlements indicating factors eg. Population Burgess Model The model is based on 1920s Chicago and show the centre of the city is the oldest, most economic district. The inner city has factories and industry, with the next ring providing working class residential areas. middle class and commuters live in the out-most rings. Advantages of Burgess Most older areas are based on a similar structure Limitations of Burgess Hoyt Sector Model The model is very old and many The model is a modified version things have changed socially of the Burgess model and since then allowed for city development New working and housing and the expansion of zones trends have developed and outward progression of Every city is different growth. It also shows it isn't The model may be as simple as just rings. oversimplifying cities.
- 3. Advantages of Hoyt It looks at the effect of transport and communication links Some cities do seem to follow the model Harris-Ullman Model Limitations of Hoyt It says that even though a city may There is no reference to have began with a CBD, other smaller CBD's develop on the outskirts of the the physical environment city near the more valuable There is no reference to out of housing areas to allow shorter town services commutes from the outskirts of the The growth of a sector can be city. This creates nodes or nuclei in stopped with land use leapfrogging other parts of the city besides the out of the inner city CBD thus the name multiple nuclei model. Advantages of Harris-Ullman It is suitable for big, expanding cities It is clear to understand It was the first model to consider then complexity of a city rather than simplifying it Mann's Model Limitations of Harris-Ullman Combines the sector theory with It assumes that land is flat with the concentric zone model. an equal distribution of Four basic sectors are postulated: resources and workers. middle class, lower middle class, It doesn't work as well in working class, and lower working smaller settlements class. Each sector displays four zones.
- 4. Advantages of Mann's More up to date than the other models Can be adapted to fit cities Limitations of Mann's Social and Doesn't fit all cities or urban areas Cultural Structure Studentification Studentification: Social impacts Studentification is a large influx Graduation celebrations of students moving into an area, Students having fun Socializing at parties often to be closer to a Drunk and disorderly behaviour university and may seem to Illegal activity take over the area, changing Obesity from fast food social, economic and Need for more police environmental aspects of it. Spread of STDs Studentification: Economic impacts University gets more students and more money Studentification: Environmental Impacts Increased income for bars Vandalizing public property Fast food outlets make lots Horrible eyesores of money Vermin and maggots from litter Increased house prices More pollution Paying to enforce law Houses abandoned after term use only
- 5. Studentification Case Study Studentification Case Study Swansea – Brynmill & Uplands Swansea – Brynmill & Uplands Noise problem 7/95 houses have permanent Litter and damages problems residents in Bryn road Houses damaged Sleepless nights for residents Backyards used as dumps University isn't perceived as Neglected and run down Doing enough to control students properties 18,000 students and only Unkempt gardens 3,500 rooms Studentification Case Study Studentification Case Study Swansea – Brynmill & Uplands Swansea – Brynmill & Uplands Families moving out as more Attracts investment students move in Provides new jobs A minority of the students are Cheap tuition fees make the Causing problems and altering Perception of students in Area attractive General Can't force students to live Contrast between term time On campus And non term time Wheelie bin fights and ASB Ghettoisation Studentification Case Study An area is isolated for residence Swansea – Brynmill & Uplands Pubs converted into bars by only people of one ethnic, Increase in fast food religious or national group. The Increase in cheap booze Most famous historical ghettos Diversification of services Were those that Nazis kept Multi-occupancy Jews in, but now many different House stock rehabilitation People are kept in various ghettos For different reasons. Mann's Model Ghettoisation: Causes Combines the sector theory with Prejudice towards a certain the concentric zone model. group Four basic sectors are postulated: A misconception or incorrect middle class, lower middle class, perspective of a group working class, and lower working A segregation of peoples class. Each sector displays four zones.
- 6. Ghettoisation: Social impacts Ghettoisation: Economic impacts High crime rate High cost on hospitals Discrimination Money to replace areas damaged Unemployment in conflicts Illiteracy Poverty Conflictc Ghettoisation Case Study Southall Less than 12% of the population Ghettoisation: Environmental Impacts Derelict buildings Is white. Urban decay Over 55% of the population is Indian or Pakistani It is home to one of the largest Sikh temples outside of India Ghettoisation Case Study Ghettoisation Case Study Small Heath, Birmingham Southall The population is mainly of The culture of the area has been Pakistani (51%) and Bangladeshi heavily swayed to a more (9%) descent, while people Asian theme of White British ethnicity is 22%. The sign at the train station is There are many mosques and written in both English and The majority of the population is Punjabi Muslim It has a bad reputation Push factors High crime rate Cost of living Migration Lack of services Drought Flooding Poverty War
- 7. Pull factors Counter-urbanisation Better environment Decentralisation of population Ability to commute to work from large urban areas to smaller Better transport links ones or rural areas. Thought to be a result of both improved Better services communication Cheaper cost of living and connectivity as well as a More space reaction against the problems More suited to needs associated with large urban areas Counter-urbanisation Case Study Cardiff - Llantwit Major Why Counter-urbanisation Cardiff docks reached its peak in Areas are more accessible now 1913, exporting 13.5 mil tonnes of There are better services and coal facilities This dropped rapidly after WWII There is available housing and, coupled with the closure of the The local environment is East Moor Steelworks, unemployment rose attractive Low income, racial prejudice and ageing housing rose Counter-urbanisation Case Study Counter-urbanisation Case Study Cardiff - Llantwit Major Cardiff - Llantwit Major Llantwit major offered employment By the 1970s, people were moving in Industrial Estates, building on away from the bay as an “area of Brownfield sites and businesses discard” It has very good access These urban “refugees” bought As it is brownfield, planning property in fairly close Llantwit restrictions are relaxed Major (15 miles) and commuted The rural environment provides a to jobs in central Cardiff nicer place to work Why Sub-urbanisation Sub-urbanisation The area is more accessible than The process by which people, it used to be factories, offices and shops There is more space to expand move out from the central It is a more pleasant environment areas of cities and into the suburbs. People have the ability to commute or even work from home
- 8. Re-urbanisation the process whereby towns and Why Re-urbanisation cities which have been experiencing The area may have been a loss of population are able to regenerated/gentrified It is closer to work and services reverse the decline and begin to There is better education grow again. Some form of New malls and shopping centres redevelopment is often have been developed required to start re-urbanisation. Re-urbanisation Case Study Re-urbanisation Case Study London Docklands London Docklands In the 1950s, the docks had become Population had declined derelict and abandoned Employment was in decline An increase in ship size meant 95%+ of housing was rented and they found it difficult to come including high density terraced down the river houses and large estates Containerisation meant few dominated by high rise blocks dockers were needed with large Shopping faciliities were limited cranes used to lift containers Lack of open space and recreation from ships Re-urbanisation Case Study Re-urbanisation Case Study London Docklands - Environmental London Docklands - Economic More pedestrian areas were £1120 was invested from the developed public sector 150 ha of open space was made £8420 was invested from the 17 conversational areas were set private sector up Unemployment fell from 14% to 7.4 100,000 trees were planted 100,000 commuters travel on a The Docklands Light Railway was daily basis developed with 126 stops Businesses doubled from 1160 to 2360 Re-urbanisation Case Study Re-urbanisation Case Study London Docklands - Successes London Docklands - Social It provided trade for local shopkeepers There was a wide range of social, 15,200 new houses were built environmental and economic benefits 17,000 new jobs were created Accessibility in and out of the Population doubled from 35,000 docklands was greatly improved to 70,000 It addressed the land, housing and A new shopping centre was built commercial problems the area had previously faced
- 9. Re-urbanisation Case Study London Docklands - Failures It didn't actually help the original Nappy Valley eg. Battersea residents of the area – many found Nappy Valley is a term or it to be too expensive to stay and had epithet applied to various to move places to denote a particularly It completely changed the job structure high local reproductive of the area from secondary to tertiary There was a reduction in a feeling demographic profile. of community in the area Consequences of Nappy Valley Why is there a Nappy Valley? There are more parent and toddler An area with vast amounts of groups mothers already living there will There are many good nurseries attract other mothers looking for a There is increased sales for cafés secure environment for their children and restaurants The area caters specifically for House prices may rise mothers with “Cafe culture” and Childless couples or singles may many schools and mother and move away toddler groups The area may become overcrowded Paedophiles may prey on the area Retirement areas eg. Dorset Why is there a Retirement Area? Retirement areas is a term or The elderly move to better areas to epithet applied to various enjoy retirement places to denote a particularly The impact of the ageing population from the baby boom is starting low local reproductive Some areas offer a better suited demographic profile with the lifestyle to the elderly majority of residents being The may want a prettier environment older than 65 for their last years. eg. With a beach Consequences of Retirement Areas Elderly are less likely to litter There is more use of public transport More jobs are available for the younger people that are there Inner City Decline Pressure on social services and healthcare Tax increase to support them Possible abuse and discrimination More vunerable people
- 10. Causes of Inner City Decline Lack of investment It is easier to outsource than have Consequences of Inner City Decline people from the inner city working Those who can afford to leave do, New industries don't want to locate leaving just the poorest people in the inner city in the already declining inner city It may get a bad reputation as a slum People are able to suburbanise and There is even less investment and it counterurbanise so live in other areas declines further instead There is a poor physical environment Gentrification A process by which run-down houses Regeneration and redevelopment in an inner city or other neglected area The improvement of old houses are improved by better off (affluent) people who move there in and the addition of amenities order to have easier access to the in an attempt to bring new life jobs and services of the city centre. to old inner city areas. The 'improving' social group changes attract more people of the similar wealthier social group. Regeneration Case Study Regeneration Case Study London Docklands London Docklands In the 1950s, the docks had become Population had declined derelict and abandoned Employment was in decline An increase in ship size meant 95%+ of housing was rented and they found it difficult to come including high density terraced down the river houses and large estates Containerisation meant few dominated by high rise blocks dockers were needed with large Shopping faciliities were limited cranes used to lift containers Lack of open space and recreation from ships Regeneration Case Study Regeneration Case Study London Docklands - Environmental London Docklands - Economic More pedestrian areas were £1120 was invested from the developed public sector 150 ha of open space was made £8420 was invested from the 17 conversational areas were set private sector up Unemployment fell from 14% to 7.4 100,000 trees were planted 100,000 commuters travel on a The Docklands Light Railway was daily basis developed with 126 stops Businesses doubled from 1160 to 2360
- 11. Regeneration Case Study Regeneration Case Study London Docklands - Successes London Docklands - Social It provided trade for local shopkeepers There was a wide range of social, 15,200 new houses were built environmental and economic benefits 17,000 new jobs were created Accessibility in and out of the Population doubled from 35,000 docklands was greatly improved to 70,000 It addressed the land, housing and A new shopping centre was built commercial problems the area had previously faced Regeneration Case Study London Docklands - Failures It didn't actually help the original residents of the area – many found it to be too expensive to stay and had to move It completely changed the job structure CBD of the area from secondary to tertiary There was a reduction in a feeling of community in the area Pedestrianising and upgrading Competition with out of town These may make areas like the Shopping centres high street more attractive to Out of town shopping centres people and may change their offer things that require more space mind about going to out of town and may not be available in CBDs shopping centres instead. It makes There is less traffic to get to the area it easier to move around, there are These big shopping centres may often parking areas available offer other facilities such as swimming surrounding the pedestrian areas pools as well as shops People go to them and not the CBD and the do not need to look out when moving between shops. CBD Case Study – Reading The abandoned brewery and transport depot were replaced with shops Retail parks, the oracle and broad street mall were developed Broad street became pedestrianised CCTV was installed to make it safer It has some of the most secure car parks It is one of the top 10 shopping areas
- 12. Changes in the RUF Rural There are new developments as land is cheaper and both housing and commercial developers want to Urban make money out of it Transport links are being built in it It offers more space for services Fringe that can't be built in centres Urban sprawl is taking over areas around cities Pull Factors Push Factors Cheaper land Expensive land and cost of living Less planning permissions Strict planning permission More open space Having to build up, not out Ability for houses to have gardens No chance for gardens Can house transport links Loud High crime rate RUF Case Study – South London Motorways: M25 Airports: Gatwick Theme Park: Chessington Race Courses: Epsom Golf courses Rural Commuter towns: Leatherhead Villages: Brockham Settlements Cemeteries Prisons: Feltham Reasons for decline Second home owners buying Decline in rural areas properties but not contributing at all Population becoming smaller to the local community or businesses Local services and businesses Commuters using services in town closing rather than local ones Less education facilities Young people moving into the No jobs available towns and cities, leaving a small working population with limited skills
- 13. Rural Decline Case Study Rural Decline Case Study Helford Isle of Purbeck 70% of homes are empty for much The Isle of Purbeck has become a of the year favoured retirement area, so the The milkwoman only has 1 customer average age is above the national There is conflict over the planning With people migrating in, house of a jetty: fisherman think it is vital, prices go up and young residents second home owners think it's an leave eyesore There is a decline of traditional 2HO place demands on the area services as new people move in even when they aren't there Growth and urbanisation People are moving more towards town and cities than the traditional rural areas, so some rural areas are becoming more urbanised Demographic Change to cater for the new demand. eg. Twyford is more accessible, Leatherhead has become a commuter town for London and Llantwit Major For Cardiff. Birth Rate Population Change (natural) The number of live births per 1000 The difference in number between women between 15-45 per year. those who are born and those who die in a year. Additional effects of migration are not Death Rate included. The number of deaths per 1000 people per year. Infant Mortality Demographic The number of babies dying before their first birthday per Transition 1000 live births. Model
- 14. Stage 2: Bangladesh Birth Rate: 22.98/1000 Death Rate: 5.75/1000 Population Growth: 2.4% Life Expectancy: 70.06 years Infant Mortality Rate: 48.99/1000 Reasons for Bangladesh Stage 3: Brazil Birth rate: Lack of contraception Birth Rate: 17.48/1000 Death rate: Higher chance of Death Rate: 6.38/1000 living if they didn't die as an infant Population Growth:1.102% Infant mortality rate: High levels of tetanus, prematurity, pneumonia Life Expectancy: 72.79 years and malnutrition. Infant Mortality Rate: 20.5/1000 Reasons for Brazil Birth rate: People are beginning to have less need of children for Stage 4: United Kingdom labour and want to have one to Birth Rate: 12.27/1000 give them a better life Death Rate: 9.33/1000 Death rate: New medicine and Population Growth: 0.553% surgery is allowing people to live longer Life Expectancy: 80.17 years Infant mortality rate: Rising income Infant Mortality Rate: 4.56/1000 and better healthcare mean less infants are dying Reasons for United Kingdom Birth rate: People are waiting till they're older or not having children Stage 5: Japan Death rate: People are starting to Birth Rate: 7.53/1000 have self destructive tendancies Death Rate: 10.09/1000 such as smoking or eating junk Population Growth: -0.2% Infant mortality rate: Hospital Life Expectancy: 83.91 years standards have improved highly Infant Mortality Rate: 2.21/1000 enough that we can combat many things that may otherwise kill infants
- 15. Reasons for Japan Implications of change Birth rate:There is an ageing Larger dependant population population so less fertile people More debt for future generations to available to have children and some support the current one Are waiting longer or not having kids Less working age citizens means Death rate: The Japanese have less potential economic growth always had good diets and Possible encouragement of hospital advances can combat more immigration Infant mortality rate: There is a very More demands on healthcare and small amount that medical advances social services can't prevent Rising taxes Voluntary Migration People move anywhere they want to because of all the pull factors Migration that it offers. It may be to send money home in the case of economic migrants, for holidays, missionary work or educational reasons. Voluntary Migration: Push and pull May prefer the other country Family may live there Voluntary Migration: Examples More work Poole, Dorset for retirees (15.93%) Cheaper 31,689,000 Mexicans in USA Better place to bring up family 2,000 a week move from Ireland Crime to Australia Bad area Unemployment Lack of healthcare Forced Migration: Push and pull Safety Political stability Forced Migration Better quality of life People have no other option Freedom of speech but to leave a place eg. Refugees Marriage for love, not arranged leaving a place to avoid further Conflict prosecution War Threat to life and/or property Lost everything eg. In hurricane
- 16. Forced Migration: Examples 7.4 mil people left Rwanda after genocide Internal Migration 10,671 people living in UK after the People move for various reasons Sudanese civil war within the same country. 56,000 Afghans living in the UK Internal Migration: Push and pull Low crime Internal Migration: Examples Quiet and peaceful People from Northern England Good services moving to Southern England Plenty of jobs In 2004, 259,000 left North and Cheaper 239,600 moved just to South East High crime Southern Italians moving to North Expensive Chinese rural-urban migration Overcrowded 126 mil moved in 2004 Bad services High unemployment International Migration: Push and pull Better quality of life Better healthcare International Migration More jobs People move for various reasons Better education to different countries. Poverty Poor healthcare and QoL Unemployment Less sophisticated education facilities International Migration: Examples 240 mil world wide in 2010 2009 estimate for Indians in UK: 1,414,100 Permanent Migration 2001 census: 140,201 South Moving with the intention of staying Africans in UK (avoiding high crime there with a visa that will allow rate) residence if it is abroad. 2010 estimate: 1,192,879 British in Australia 1/3 of Poland's population migrates each year
- 17. Permanent Migration: Push and pull Permanent Migration: Examples Nicer area Retirees in Poole, Dorset Family live there 800,000 permanent British residents High crime rate in Spain Poor facilities 11,000 Czech's in Canada 1969 Temporary Migration: Push and pull Family are there Temporary Migration Nicer environment Moving for an allocated space of Possible employment time with the intention of coming Holidays back. Low income Unemployment Inadequate healthcare Impacts on host country: Social Temporary Migration: Examples Stops rural depopulation Going to work on an oil right in the Creates a diverse culture Atlantic Ocean Migrants tend to be working age - Swansea for university students counteracts ageing problem 2010: 238,000 came to the UK to Original residents may resent migrants study Migrants belief/religion/tradition may 2005: 1,500 asylum seekers arrived differ from the locals in the UK each day (565,000 total) It is mostly men that migrate, leading to a gender imbalance Impacts on host country: Economic Impacts on host country: Environmental Migrants help the economy Barn conversion and other regeneration Migrants fill the skills gap makes use of old rural buildings Poor neighbouring countries bear Gentrification may take place the heaviest burden Rural urban migration creates ghettoisation Unemployment in the host country Shortage of resources eg. Water in may become higher with more Costa Del Sol with demand for pools competition for jobs Mexico-USA migration has forced the US to build a large, unsightly wall to try Cost of housing asylum seekers - to limit illegal migration. £430,000 to detain 73 people
- 18. Impacts on origin country: Social Impacts on origin country: Economic Raised status of women, gain of Migration led to a decrease in autonomy and management skills Poverty and unemployment New ideas from new migrants Increased taste – Western services Migrants send over $20 bil back Improved support of democracy annually In dictatorial countries, only a few have Philippines received $12.8 bil in 2008 Access to profitable economic sectors India received £20 bil in 2005 So there is more poor people Most skilled workforce leaves Gender imbalance Buganda lost 20% of educated If many doctors move out, there is a Population in the past 10 years higher death rate Impacts on origin country: Environmental Voluntary Migration: Mexico to US Outmigration reduces pressure on the land and resources 2000km being built between US Money returned can be invested in and Mexico improving infrastructure 900,000 Mexicans migrate to the Abandoned land can be returned to nature US annually Rural depopulation means the land has Illegal migration is a huge problem to change a second time US border patrol guards try to Water supply problems and diseases control the migration spread with loss of healthcare and sanitation Detention centres need to be built 850,000 Mexicans were caught in in intervening places 1995 Voluntary Migration: Mexico to US Push and Pull factors Impacts on USA 1800 per doctor Border patrol and prisons cost GNP: $3750 millions 55% Literacy $6 billion sent from US to Mexico Life expectancy: 72 years annually 40% unemployed Migrants will work for less 400 per doctor Cultural and racial issues GNP: $24750 Mexican culture has enriched 99% Literacy Life expectancy: 76 years border states Many jobs Incidents of TB increased Impacts on Mexico Shortage of economically active Men migrate and leave women unmarried Young people migrate, leaving the old and the very young Legal and illegal immigrants send back $6 billion a year Villages like Santa Ines have lost 2/3 of their inhabitants
- 19. Voluntary Migration: Africa to Europe Push and Pull factors Voluntary Migration: Sub Saharan Life expectancy: 47 years Africa to Europe 2.3% growth People from poor African countries 65.7% Literacy try to come through Spain, the HIV prevalence: 5.8% Internet usage: 29/1000 Canary islands and Italian islands Life expectancy: 80 years They leave through Libya and 0.6% growth Morocco 98.9% Literacy HIV prevalence: 0.3% Internet usage: 439.4/1000 Impacts on Europe 120,000 illegal immigrants deported Impacts on Africa from Spain in 2002 Loss of skilled workers Tighter security at certain points 1 in 10 people crossing die just changes where people are Having to build detention centres deporting from eg. in Manila, Morocco Millions are spent in processing fees Refugees and Asylum seekers Asylum seeker: A refugee who has arrived at their desired country Refugees and Asylum seekers and asks to seek asylum. If they Refugee: A person who has been are granted it, they become forced to leave their country in refugees again, within the new order to escape war, persecution, country. They are not allowed to or natural disaster. work for 2 years and must live on benefits to prove they are not economic migrants. Forced Migration: Uganda to UK Uganda to UK: Push and pull Idi Amin came to power in 1971 Dictatorial regime In 1972 he gave all Asians an Major financial instability ultimatum to leave within 90 days High death rate He ran a regime of people who Many people disappearing disagreed with him simply Stable democratic government disappearing or dying in “accidents” Better economics More than 50,00 fled Uganda, with Lower death rate 30,000 coming to the UK Safety
- 20. Impacts on UK (Uganda) Impacts on Uganda High unemployment rate Loss of working population Tension between races Further pressure from economic Fear that temporary settlements failures would become permanent Major economic failure as many eg. Stradishall camp businesses were owned by the Many more people living on benefits Asians who had been forced to and requiring welfare leave Forced Migration: Zimbabwe to UK Zimbabwe to UK: Push and pull Mugabe came to power in 1980 One party state He set up a 1 party dictatorial state High death rate He has threatened many groups, Political instability forcing them to leave and causing Civil war financial instability in some areas Stable government of the economy Better finances Any political opposition is dealt with Safety violently Lower death rate Sanctions have been imposed Impacts on UK (Zimbabwe) High unemployment rate Impacts on Zimbabwe Tension between races Loss of working population Fear that temporary settlements Major economic failure would become permanent Economic problem made worse Many more people living on benefits by sanctions imposed by UN and requiring welfare Gender imbalance in the DTM Gender In stage 2 of the DTM, there is often a high infant mortality rate, and this effects males more than females. Structures Later in life, many women are dying in childbirth though a few men do still die from high labour jobs.
- 21. Gender imbalance in the DTM Gender imbalance in the DTM In stage 4 of the DTM, the job In stage 3 of the DTM, countries like sectors of the country has changed China may recognize the population and there is less need for labour, problem yet still have a need for removing the preference for males. labour. This may lead to a preference Medicine has advanced enough for for males and either abortions of childbirth related deaths to be female foetuses or female minimal. Women naturally live longer infanticide than men, so the very oldest people are women. Gender Imbalance Case Study: China Why was the policy needed? Gender imbalance in the DTM Food shortages became a major In stage 5 of the DTM, women are problem as more had to be still generally living longer, there provided to keep up with the is no preference over gender or demand of a quickly growing intervention dependant on this and population. there is nothing during their lifetimes Unemployment became a serious problem that should wipe out more of one andincreases with population growth. Unemployment rose from 1.8% in gender than the other. 1985 to 2.9%and is predicted to keep growing. Gender Imbalance Case Study: China The one child policy Gender Imbalance Case Study: China Concessions and variations It was introduced in 1978 The policy is not as strictly enforced in rural It was only fully implemented in areas so people living there may often have 2 urban areas Parents who are both only children themselves Many in rural areas may have 2 may have 2 children children Divorced and remarried women may have It changes the sex ratio as boys are children if they didn't in a previous relationship Couples may have another child if the first favoured,so if it is found out to be a girl, is mentally handicapped or dies parents may tryto abort, kill it at birth Ethnic minorities are exempt from the policies or simply not report it. Gender Imbalance Case Study: ChinaGender Imbalance Case Study: China Implications of the sex ratio Age related problems There will be a shortfall of women The baby boom of 1962-1973 will create a retirement bulge in the 2030s. in the important fertile age group Over 65s could make 25% of the population There is currently a 106:100 ratio of Number of retired will go from 1 in 25 to 1 in 4 men to women Children are seen as an investment for old age There will be too many dependants Young men may find it difficult to Children will be unable to fulfil social obligations find a partner The gap between desire for children and Prostitution may rise the policy will eventually narrow
- 22. Gender Imbalance Case Study: China Gender Imbalance Case Study: China Shanghai is China's leading Success or failure economic city, experiencing Population growth reduced by 300 million phenomenal economic Rate of natural increase 1.7% in 2007 growth. There are fears the one Birth control targets are being reached child policy may bring down Food security became an issue as arable this fortune. land is still limited China may still face water shortages The TFR for Shanghai is 0.8 and population has been decreasing since 1993 Gender Imbalance Case Study: China Shanghai was the first city where, Gender Imbalance Case Study: China if both parents are only children, In the long term, the one child they may have 2 children. They policy could cause a labour are currently looking at shortage with too amendments for educated many elderly dependents couples, one partner being an only child and where two divorcees remarry. Philippines: POPCOM – Why? Demographic 85 million people living on 11 islands 142.2 mil predicted by 2050 Changes and Debt problem and high demands on healthcare and education Policies United nations declaration 1970 Martial law in 1972 made contraceptives available Philippines: POPCOM Positives and Negatives Philippines: POPCOM – Evaluation Dropped birth rate from 3% to 2.4% Though it has dropped, it's still Decline in the TFR very high Went from 6 children per woman to 3.5 Many still follow religion and use It clashes with the roman catholic only traditional methods, which religion prominent in the country often fail Even though birth rate has dropped, Abortion is still illegal and 12% of it's still high maternal deaths are due to home With each change of government, the induced abortions policy is changed
- 23. Uganda: ABC – Why? Uganda: ABC To encourage Abstinence, Being Positives and Negatives HIV prevalence fell from 15% to 5% faithful and using a Condom HIV testing for pregnant women has To reduce sexual incidents causing increased to 80% HIV Condoms are widely available Ugandan teachers are instructed to Grant of $70 million Less than 1/5 of Ugandan children that discuss abstinence only, not condoms need treatment get it Free prevention of mother-to-child Healthcare providers can't handle the transmission services amount of people and have to turn them away The initial drug role out was slow Uganda: ABC – Evaluation Pro-abstinence organizations use Uganda as an example to show Kenya: National Family Program – Why? success, but ignore the other methods Population growth needed to be The being faithful and avoiding reduced from 3.3% to 3% casual sex part of the policy had a Trying to reduce to TFR big initial impact, but slowly faded To reduce child mortality The number of condoms rose from 1.5 mil to 10 mil between 1992 and 1996 Kenya: National Family Program Positives and Negatives Child mortality rates have decreased Kenya: NFP – Evaluation In 1998, TFR had fallen to 4.7 Population growth has carried on Contraceptive use increased to 38.3% increasing Fertility and population growth rates Economy has run into difficulties both increased Fertility rate has increased 24% of women don't use it 44% of under 15s need future health Singapore – Why? Total Fertility Rate of 1.3 children Singapore 10% of the population are already Positives and Negatives over 65 More people will work longer Equalised payable age for men and The average life expectancy at birth women is 79 years Short term solution Couples get childcare allowances More money will be spent Encourages immigration Immigration doesn't help with the Promotes increased retirement ageing population age
- 24. Singapore – Evaluation They get more workers Singapore is able to maintain its Norway – Why? productive edge against other To encourage women to have more nations kids Higher taxes To prevent the dependency ratio More need for facilities for elderly from increasing National population does not increase Norway Positives and Negatives 10 months 100% pay Norway – Evaluation 12 months 80% pay Helped maintain a stable fertility Stayed at a steady 1.8 children per woman 5/6 women between 30-39 are employed rate Greater gender equality Encouraged women to have more 1992-1997 TFR dropped 2.1-1.5 children Target TFR of 2.1 is still not acheived Causes of Low Fertility Rates It is more acceptable for women to Ageing have children later or not at all Many women are choosing career over family Population An ageing population leaves less people available to have children Baby boomers of the 1960s are just coming up to retirement age Consequences Ageing population: Case Study: UK Old people commit crime less, so TFR is 1.8 so growth is falling national crime rates may drop People may have to retire later Society may become more cohesive Taxes are going to rise to support Many old people volunteer the dependant population More money will be put into leisure The elderly are costing massive Pensions are more of a burden amounts: the retirement age was The ability to care for the elderly set in the 1880s when people were decreases as average household size Does only expected to live to 68, now There are going to be sharp rises in they're living till 80, they are on Healthcare costs pensions for 15 years