2013 מצגת שינויי האקלים מהקוטב צפוני לכיכר תחריר
•Download as PPT, PDF•
1 like•1,271 views

שינויי האקלים זה לא משהוא רחוק אלא משפיע כאן ועכשיו המצגת מתארת את הנושאים הבסיסיים של שינויי האקלים ותוך כדי יכך עונה לרוב הטענות של מכחישיי האקלים שינוי אקלים שינויי אקלים השפעות שינויי האקלים

Recommended
Recommended
More Related Content
Featured
Featured (20)
2013 מצגת שינויי האקלים מהקוטב צפוני לכיכר תחריר
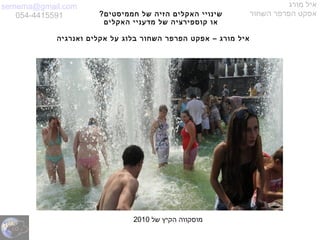
- 1. semema@gmail.com 054-4415591 מורג איל השחור הפרפר אפקט?חממיסטים של הזיה האקלים שינויי האקלים מדעניי של קוספירציה או של הקיץ מוסקווה2010 ואנרגיה אקלים על בלוג השחור הפרפר אפקט – מורג איל
- 2. semema@gmail.com 054-4415591 מורג איל השחור הפרפר אפקט האקלים שינויי בנושא מצגת האוירית בתעשיה אביטל גבי עם פנל עבור במקור הוכנה פורום בכל חלקה או המצגת כל את להציג הרשות ניתנת המקור ציון תוך שהוא אקלים בנושא בלוג השחור הפרפר אפקט – מורג איל ואנרגיה ולהוסיף לשפר מקווה אני בעתיד
- 3. semema@gmail.com 054-4415591 מורג איל השחור הפרפר אפקט משמעותי אקלים שינוי יש האם א חלק ישראל מערבי הצפון המעבר - הארקטי הקרח אוסטרליה גרמניה קנדה העולמיות הטמפרטורות ההוקי ליגת
- 4. semema@gmail.com 054-4415591 מורג איל השחור הפרפר אפקט מתחמם שהאקלים האישית ההרגשה המטאורולוגי השרות בישראל האויר מזג של חדשי סיכום הממוצע מעל אדוםממוצע אפור לממוצע מתחת כחול ינוא סיכום2010 דצמ סיכום2009 נובמ סיכום2009 אוקט סיכום2009 ספט סיכום2009 אוגו סיכום2009 יולי סיכום2009 יוני סיכום2009 מאי סיכום2009 אפר סיכום2009 מרץ סיכום2009 פבר סיכום2009 ינוא סיכום2009 דצמ סיכום2009 נובמ סיכום2009 אוקט סיכום2009 ספט סיכום2009 אוגו סיכום2009 יולי סיכום2010 יוני סיכום2011 מאי סיכום2011 אפר סיכום2011 מרץ סיכום2011 פבר סיכום2011 ינוא סיכום2011 דצמ סיכום2010 נובמ סיכום2010 אוקט סיכום2010 ספט סיכום2010 אוגו סיכום2010 יולי סיכום2010 יוני סיכום2010 מאי סיכום2010 אפר סיכום2010 מרץ סיכום2010 פבר סיכום2010 יולי סיכום2009 יוני סיכום2009 מאי סיכום2009 אפר סיכום2009 מרץ סיכום2009 פבר סיכום2009 ינוא סיכום2009 נובמ סיכום2008 אוקט סיכום2008 ספט סיכום2008 אוגו סיכום2008 יולי סיכום2008 יוני סיכום2008 מאי סיכום2008 אפר סיכום2008 מרץ סיכום2008 פבר סיכום2008 ינוא סיכום2008 דצמ סיכום2007 נובמ סיכום2007 אוקט סיכום2007 ספט סיכום2007 אוגו סיכום2007 יולי סיכום2007 יוני סיכום2007 מאי סיכום2007 אפר סיכום2007 מרץ סיכום2007 פבר סיכום2007 ינואר סיכום2007 דצמ סיכום2006 נובמ סיכום2006 אוקט סיכום2006 ספט סיכום2006 אוגו סיכום2006 יולי סיכום2006 יוני סיכום2012 מאי סיכום2012 אפר סיכום2012 מרץ סיכום2012 פבר סיכום2012 ינוא סיכום2012 דצמ סיכום2011 נובמ סיכום2011 אוקט סיכום2011 ספט סיכום2011 אוגו סיכום2011
- 5. semema@gmail.com 054-4415591 מורג איל השחור הפרפר אפקט של הממוצעת היומית הטמפרטורה הפרש5,שנה בכל ,התחנות של שנתי הרב מהממוצע2991-2972. של רץ ממוצע מוצג ()בירוק השנתי הגרף על22.()בשחור שנה המטאורולוגי השירות ממצאי בישראל אקלימיים שינויים2011
- 6. semema@gmail.com 054-4415591 מורג איל השחור הפרפר אפקט אוסטרליהמהממוצע הטמפרטורה של סטיה
- 7. semema@gmail.com 054-4415591 מורג איל השחור הפרפר אפקט קנדה
- 8. semema@gmail.com 054-4415591 מורג איל השחור הפרפר אפקטלבדיחה הפכה כמעט בוונקובר החורף אוליפידתבגלל לפני הרישומים תחילת מאז ביותר החם החורף114שנהאשר של החורף הקודם מהשיאן חם יותר הרבה היה1998
- 9. semema@gmail.com 054-4415591 מורג איל השחור הפרפר אפקטיותר מקרוב הלפידשלג ללא
- 10. semema@gmail.com 054-4415591 מורג איל השחור הפרפר אפקט בקנדה בחורף הזמן לאורך השינוי2.8-ה מסוף 40
- 11. semema@gmail.com 054-4415591 מורג איל השחור הפרפר אפקט הצפוניים המעברים
- 12. semema@gmail.com 054-4415591 מורג איל השחור הפרפר אפקט הצפוניים המעברים UK NL יפאן מערבי צפון מזרחי צפון ברינג מצרי
- 13. semema@gmail.com 054-4415591 מורג איל השחור הפרפר אפקט קוק גימס
- 14. semema@gmail.com 054-4415591 מורג איל השחור הפרפר אפקטארצות ומגליי ספינות עוד של מתקופתו תמונה William Baffin 1624 John Davis 1550-1605Hugh Willoughby 1553 Discovery 1610-1611 H.Hadson 1773 English expedition to Spitsbergen
- 15. semema@gmail.com 054-4415591 מורג איל השחור הפרפר אפקטפרנסיס מימיי החל .למזרח לשוט האפשרות את וחסם הארקטי האוקינוס את כיסה הימי הקרח עשרות .מערבי הצפון המעבר תפס הלב תשומת רוב את .צפוני מעבר למצוא נסיונות נעשו דרייק שבתמונה למצב הגיע מהן גדול וחלק מעבר את למצוא ניסו ספינות HMS_Assistance_(1850)
- 16. semema@gmail.com 054-4415591 מורג איל השחור הפרפר אפקט HMS Investigator לא אחד אף להבדיל אבל השלישי החורף לפני לשחררן ניתן יהיה שלו היה נראה כאשר חורפים שני לאחר ננטשו פרנקלין של הספינות גם מלשחות נעלמו המזרחי במעבר גם .פרנקלין של מהמישלחת שרד2בשנת1912(HMS Investigator)
- 17. semema@gmail.com 054-4415591 מורג איל השחור הפרפר אפקט פרנקלין משלחת של הסוף
- 18. semema@gmail.com 054-4415591 מורג איל השחור הפרפר אפקט אחד בקיץ עברה אשר הראשונה היאכטה המעברים שני את
- 19. semema@gmail.com 054-4415591 מורג איל השחור הפרפר אפקט משנת1979הארקטי הקרח שטח של מלווינים מדידות יש
- 20. semema@gmail.com 054-4415591 מורג איל השחור הפרפר אפקטימי קרח
- 21. semema@gmail.com 054-4415591 מורג איל השחור הפרפר אפקט פוחת הקרח עובי
- 23. semema@gmail.com 054-4415591 מורג איל השחור הפרפר אפקט'הטמפ אנומלית2010
- 24. semema@gmail.com 054-4415591 מורג איל השחור הפרפר אפקטעולמית תמונה עדיפה אבל קיימים4העולמית הטמפרטורה של נתונים מסדי של התרשיםNSAA - GISS
- 25. semema@gmail.com 054-4415591 מורג איל השחור הפרפר אפקט" " " "גייט קליימט ב שהתפרסמו אלו האקלים מדעני על סמכו הכל לא אבל The Berkeley Earth Surface Temperature study
- 26. semema@gmail.com 054-4415591 מורג איל השחור הפרפר אפקטעולמית תמונה עדיפה אבל קיימים4העולמית הטמפרטורה של נתונים מסדי של התרשיםNSAA - GISS
- 27. semema@gmail.com 054-4415591 מורג איל השחור הפרפר אפקטנסוגים ביבשה מקורם אשר הקרחונים של המכריע רובם גם משנת תמונה מויר הקרחון למשל-1941Muir
- 28. semema@gmail.com 054-4415591 מורג איל השחור הפרפר אפקטMuir-2004המקום מאותו התמונה
- 29. semema@gmail.com 054-4415591 מורג איל השחור הפרפר אפקטמפטגוניה אופסלה מקרחון תמונה
- 30. semema@gmail.com 054-4415591 מורג איל השחור הפרפר אפקט קיטרק והקרחוןKyetrakמההימלאיה
- 31. semema@gmail.com 054-4415591 מורג איל השחור הפרפר אפקט נדידת :ל באביב הטמפרטורה בין לקשר מגרמניה דוגמה החי עולם על גם משפיעה התחממות -כ למעשה העלים והנצת הגוזלים בקיעת הצפורים90%אשר שינויי מראות אשר בטבע מהתופעות הצפויי את תואם השינויי האקלים לשינויי קשור להיות יכול Of the more than 29,000 observational data series, from 75 studies, that show significant change in many physical and biological systems, more than 89% are consistent with the direction of change expected as a response to warming Anomalies of phenological phases in Germany correlate with anomalies of mean spring air temp T & NAO index Phenological phases: spring arrival in birds, island of Helgoland, North Sea; hatching in ycatchers (Ficedula hypoleuca), Northern Germany;̄
- 32. semema@gmail.com 054-4415591 מורג איל השחור הפרפר אפקט מיוחד דבר ושום זמנית בעליה רק מדובר בכלל אולי 'וגו חדש אין 2010 1900
- 33. semema@gmail.com 054-4415591 מורג איל השחור הפרפר אפקט ההוקי ליגת פרוקסי
- 34. semema@gmail.com 054-4415591 מורג איל השחור הפרפר אפקט Proxy-based reconstructions of hemispheric and global surface temperature variations over the past two millennia -Mann 2008 PANAS
- 35. semema@gmail.com 054-4415591 מורג איל השחור הפרפר אפקט להתחממות הסיבות : 'ב חלק ? השמש ? המים ? חמצני דו פחמן
- 36. semema@gmail.com 054-4415591 מורג איל השחור הפרפר אפקטהשמש בעצמת השינוי אולי
- 37. semema@gmail.com 054-4415591 מורג איל השחור הפרפר אפקט הטמפטורה על משפיעה השמש כיצד סוונסמרק-שביב לפי פעילות השמש קרינה קוסמית ענניםטמפרטורה פעילות השמש
- 38. semema@gmail.com 054-4415591 מורג איל השחור הפרפר אפקט השמש לא למה הגלובלית והטמפרטורה קוסמית קרינה השמש כתמי
- 39. semema@gmail.com 054-4415591 מורג איל השחור הפרפר אפקט החממה אפקט
- 40. semema@gmail.com 054-4415591 מורג איל השחור הפרפר אפקטהאלקטרומגנטי הספקטרום לבסיס נחזור תחילה
- 41. semema@gmail.com 054-4415591 מורג איל השחור הפרפר אפקט בלבד בטמפרטורה תלויה שחור גוף קרינת יותר קצר גל באורך הקרינה של העוצמה שיא יותר חם הפולט שהגוף ככול שמש מיליון פי (מוקטנת) הארץ כדור
- 42. semema@gmail.com 054-4415591 מורג איל השחור הפרפר אפקט 'הטמפ קיים היה לא החממה אפקט אם היתה כדה"א של הממוצעת18מתחת לאפס ולא15. האפס מעל מעלות חממה גזי מהשמש קרינה חוזרתקרינה את מקבלת האדמה המוחזרת + הישירה הקרינה
- 43. semema@gmail.com 054-4415591 מורג איל השחור הפרפר אפקט לא הם החממה גזי – חנקן78% – חמצן21% - ארגון1% סה”כ100% )(כמעט 400ppm שלCOלאחר להרוג עלולים3שעות
- 44. semema@gmail.com 054-4415591 מורג איל השחור הפרפר אפקט הקרינה בליעת
- 45. semema@gmail.com 054-4415591 מורג איל השחור הפרפר אפקט חממה גזי - מיםH2O - חמצני דו פחמןCO2 – מיתןCH4 ישנוספים
- 46. semema@gmail.com 054-4415591 מורג איל השחור הפרפר אפקט מים באטמוספירה העיקרי החממה גז הם מים אדי 80%-ו מהמסה ~90%החממה גזי של מהנפח העננים עם יחד75%החממה מאפקט ~ (העננים ללא50%~)
- 47. semema@gmail.com 054-4415591 מורג איל השחור הפרפר אפקט באטמוספירה המים כמות את לשנות קשה
- 48. semema@gmail.com 054-4415591 מורג איל השחור הפרפר אפקט ? עולה המים אדיי כמות למה אבל
- 49. semema@gmail.com 054-4415591 מורג איל השחור הפרפר אפקט עליה מגמת קיץ ירידה חורף ה תחמוצת דופחמן CO2
- 50. semema@gmail.com 054-4415591 מורג איל השחור הפרפר אפקט הזה תחמוצת הדו של מקורו ?געש הרי פינטובו
- 51. semema@gmail.com 054-4415591 מורג איל השחור הפרפר אפקט העולמית 'הטמפ את להוריד יכולים געש הרי -אויר זהום חלקיקיי של פליטות גםGlobal Dimming פינטובו אגונג Ruapehu 1952ארוע אויר זהום בלונדון בעולם אויר זהום תקנות
- 52. semema@gmail.com 054-4415591 מורג איל השחור הפרפר אפקט מחמיץ ?האוקינוס
- 53. semema@gmail.com 054-4415591 מורג איל השחור הפרפר אפקט בדלקים השימוש על נתונים נפט–4028טון מיליון – פחם3556ל ערך שווהנפט טון מיליון גז–3169נפט טון למיליון ערך שווה ברוא עקב הפליטות את מוסיפים כאשר מקבלים מקורות ושאר חקלאות יערות 8.4±0.5PgCאו8400פחמן של טון מיליון פי ובערך3חמצני הדו הפחמן משקל -פי בערך זה2שנוספה מהכמות האנושיות הפליטות לכן לאטמוספרה -ה רמת את להעלות כדיי מספיקותCO2 ?מהפליטות חצי הלכו לאן היחידה השאלה
- 54. semema@gmail.com 054-4415591 מורג איל השחור הפרפר אפקט-ה של האנטרופוגניות הפליטות הגיעו לאןCO2 בשנים(2000-2009) 1.1±0.7 PgC y-1 + 7.7±0.5 PgC y-1 4.1±0.1 PgC y-1 47% 2.4 PgC y-1 27% Calculated as the residual of all other flux components 26% 2.3±0.4 PgC y-1 Average of 5 models Global Carbon Project 2010; Updated from Le Quéré et al. 2009, Nature Geoscience; Canadell et al. 2007, PNAS
- 55. semema@gmail.com 054-4415591 מורג איל השחור הפרפר אפקט Global Carbon Project 2010 העולמי הפחמן מאזן נטו תנועות
- 56. semema@gmail.com 054-4415591 מורג איל השחור הפרפר אפקטAtmospheric CO2 Concentration Data Source: Pieter Tans and Thomas Conway, 2010, NOAA/ESRL 1970 – 1979: 1.3 ppm y-1 1980 – 1989: 1.6 ppm y1 1990 – 1999: 1.5 ppm y-1 2000 - 2009: 1.9 ppm y-1 2009 1.62 2008 1.80 2007 2.14 2006 1.84 2005 2.39 2004 1.60 2003 2.19 2002 2.40 2001 1.89 2000 1.22 December 2009: 387.2 ppm September 2010 (preliminary): 389.2 ppm 39% above pre-industrial Annual Mea Growth Rate (ppm y-1 ) GLOBAL MONTHLY MEAN CO2 2006 2007 2008 2009 2010 2011 November2010 PartsPerMillion(ppm) 390 388 386 384 382 380 378
- 57. semema@gmail.com 054-4415591 מורג איל השחור הפרפר אפקטהיחסC13/C12מעדיפים צמחיםC12בכל לכן של יותר נמוך אחוז יש המאובן הדלקC12 Figure 2: Annual global CO2 emissions from fossil fuel burning and cement manufacture in GtC yr?1 (black), annual averages of the 13C/12C ratio measured in atmospheric CO2 at Mauna Loa from 1981 to 2002 (red). ). The isotope data are expressed as 13C(CO2) ‰ (per mil) deviation from a calibration standard. Note that this scale is inverted to improve clarity. (IPCC AR4)
- 58. semema@gmail.com 054-4415591 מורג איל השחור הפרפר אפקט י היחסC13/C12מעדיפים צמחיםC12בכל לכן של יותר נמוך אחוז יש המאובן הדלקC12
- 59. semema@gmail.com 054-4415591 מורג איל השחור הפרפר אפקט יכול הפחמן האם ההתחממות את להסביר ?הגלובלית
- 60. semema@gmail.com 054-4415591 מורג איל השחור הפרפר אפקט ממוחשבים מודלים
- 61. semema@gmail.com 054-4415591 מורג איל השחור הפרפר אפקט מאנארקטיקה קרח גלעיני
- 62. semema@gmail.com 054-4415591 מורג איל השחור הפרפר אפקטקרח תקופות
- 63. semema@gmail.com 054-4415591 מורג איל השחור הפרפר אפקט CO2-CH4באטמוספירה חמצני דו פחמן
- 65. semema@gmail.com 054-4415591 מורג איל השחור הפרפר אפקט IPCC 2007 הטמפרטורה עליית תחזית
- 66. semema@gmail.com 054-4415591 מורג איל השחור הפרפר אפקט המיתן הידרט
- 67. semema@gmail.com 054-4415591 מורג איל השחור הפרפר אפקט השפעות 1חיים בעלי . 2הוריקנים . 3בצורות . 5שריפות .
- 68. semema@gmail.com 054-4415591 מורג איל השחור הפרפר אפקט מחמיץ האוקינוס
- 69. semema@gmail.com 054-4415591 מורג איל השחור הפרפר אפקטדגים אלמוגים אצות coccolithophores foraminifer
- 70. semema@gmail.com 054-4415591 מורג איל השחור הפרפר אפקט ביפאן נומורה מדוזות האקלים שינויי רק לא המדוזות את מעודדת הטמפרטורה עליית אבל
- 71. semema@gmail.com 054-4415591 מורג איל השחור הפרפר אפקט חדרה רבין אורות2011
- 72. semema@gmail.com 054-4415591 מורג איל השחור הפרפר אפקט המדעי שמם לפי הדובים את זהו חידה Ursus arctos horribilis Ursus sapiens Ursus maritimus
- 73. semema@gmail.com 054-4415591 מורג איל השחור הפרפר אפקט Ursus arctos horribilis איום-גריזלי צפוני דב Ursus sapiens נבון דב Ursus maritimus הימי דוב
- 74. semema@gmail.com 054-4415591 מורג איל השחור הפרפר אפקטאת מוצאים אשר הקוטב דובי של בהקשר התפרסם הימי הקרח הקרח עם יחד מצטצמת ואוכלוסיתם עליו טרפם USS Honolulu (SSN 718) while surfaced 280 miles from the North Pole.
- 76. semema@gmail.com 054-4415591 מורג איל השחור הפרפר אפקט גשם של מקומית והתמעטות ההתחממות בעקבות אזורים יבוש הברית ארצות פוניקס
- 77. semema@gmail.com 054-4415591 מורג איל השחור הפרפר אפקט Dust Bowl – Dallas, South Dakota 1936
- 78. semema@gmail.com 054-4415591 מורג איל השחור הפרפר אפקט ההררי האורן חיפושית
- 79. semema@gmail.com 054-4415591 מורג איל השחור הפרפר אפקטהברית בארצות שריפות
- 80. semema@gmail.com 054-4415591 מורג איל השחור הפרפר אפקט ? ובישראל
- 82. semema@gmail.com 054-4415591 מורג איל השחור הפרפר אפקטשריפות
- 83. semema@gmail.com 054-4415591 מורג איל השחור הפרפר אפקט בתמונה בטקסס פוגע איקה הוריקנים
- 84. semema@gmail.com 054-4415591 מורג איל השחור הפרפר אפקט The increasing intensity of the strongest tropical cyclones-. Elsner et al , Nature 455, 92-95 (4 September 2008 :חמישונים לפי ההוריקנים בעוצמת השינוי בתרשים dהברית )ארצות האטלנטי האוקינוס )בצפון fובורמה )בנגלדש ההודי האוקינוס )בצפון
- 85. semema@gmail.com 054-4415591 מורג איל השחור הפרפר אפקט שטפונות
- 86. semema@gmail.com 054-4415591 מורג איל השחור הפרפר אפקט מצרים לדוגמה :המשמעות BBC News - World food prices at fresh high, says UN This is because wildfires last year in Russia, which accounts for 11% of global exports, resulted in an export ban, the institute's director of markets, trade and institutions, Maximo Torero, told the BBC The recent floods in Australia, which also accounts for 11% of global exports, has compounded the problem, he said Droughts in Argentina, the world's second biggest exporter of corn behind the US, have also pushed the price up, Mr Torero said. July 31, 2010 -- Dry grass burns near the town of Voronezh, some 294 miles south of Moscow. The drought-driven fires have spread quickly across more than 200,000 acres in recent days in the midst of a record heat wave and severe drought that have plagued Russia for weeks. Read More
- 87. semema@gmail.com 054-4415591 מורג איל השחור הפרפר אפקט המזון מחירי עליית של התוצאה
- 89. semema@gmail.com 054-4415591 מורג איל השחור הפרפר אפקטההקשבה על תודה מורג איל השחור הפרפר אפקט - בלוג semema@gmail.com 054-4415591
- 90. semema@gmail.com 054-4415591 מורג איל השחור הפרפר אפקט ארקטית הגברה
- 91. semema@gmail.com 054-4415591 מורג איל השחור הפרפר אפקט ארקטית הגברה
- 92. semema@gmail.com 054-4415591 מורג איל השחור הפרפר אפקט בגרנלנד אלבדו שינוי
Editor's Notes
- Residue is included in the land sink
- The annual growth rate of atmospheric CO2 was 1.6 ppm in 2009, below the average for the period 2000-2008 of 1.9 ppm per year (ppm = parts per million). The mean growth rate for the previous 20 years was about 1.5 ppm per year. This increase brought the atmospheric CO2 concentration to 387 ppm by the end of 2009, 39% above the concentration at the start of the industrial revolution (about 280 ppm in 1750). The present concentration is the highest during at least the last 2 million years. The increase in atmospheric CO2 of 3.4±0.1 Pg C yr−1 in 2009 was among the lowest since 2000. This cannot be explained by the decrease in CO2 emissions alone but is mainly caused by an increase in the land and ocean CO2 sinks in response to the tail of the La Niña event that perturbed the global climate system from mid 2007 until early 2009. Accumulation of atmospheric CO2 is the most accurately measured quantity in the global carbon budget with an uncertainty of about 4%. The estimated uncertainty in the global annual mean growth rate is 0.07 ppm/yr. The data is provided by the US National Oceanic and Atmospheric Administration Earth System Research Laboratory.