Strategie grains
•
2 gefällt mir•1,517 views

Monthly report, Strategie grains. Overview of the European grain market in term of production/surface/output. Mail me if you wish to get the latest report for free.

Empfohlen
Weitere ähnliche Inhalte
Ähnlich wie Strategie grains
Ähnlich wie Strategie grains (20)
Strategie grains
- 1. Nineteenth year - No 221 / 12 May 2011 - English version © 2011 Tallage SAS. All rights reserved. No part of this publication may be reproduced, photocopied, stored in a retrieval system or transmitted, in any form or by any means, nor otherwise circulated without the prior consent of the publisher. Action will be taken against any person, company or organisation infringing copyright. The next issue of Stratégie grains will be available on 16 June 2011 stratégiegrains® strategie-grains.com soft wheat 2010/11 2011/12 July-June asof 13/04/11 as of 11/05/11 carry-instock 13.4 8.6 8.7 production 126.4 135.2 131.5 imports 2.3 3.9 3.8 domesticuse 114.3 118.5 117.1 exports 19.1 19.0 16.8 freecarry-outstock 8.7 10.2 10.1 interv.stock carry-outstock 8.7 10.2 10.1 surplus/requiredstock -1.9 -0.7 -0.7 barley 2010/11 2011/12 July-June asof 13/04/11 as of 11/05/11 carry-instock 15.6 8.3 8.2 production 52.9 54.5 54.2 imports 0.2 0.2 domesticuse 55.3 53.9 53.9 exports 5.0 3.4 3.0 freecarry-outstock 7.7 5.2 5.5 interv.stock 0.5 0.5 0.2 carry-outstock 8.2 5.7 5.7 surplus/requiredstock 2.5 0.1 0.5 maize 2010/11 2011/12 October-Sept. asof 13/04/11 as of 11/05/11 carry-instock 6.0 6.1 6.0 ofwhicholdcropmaize 4.0 3.8 3.6 production 54.9 59.5 59.1 imports 6.8 4.6 4.8 domesticuse 61.1 64.5 63.7 exports 1.0 1.0 1.0 freecarry-outstock 3.6 2.4 2.8 stockintervention harvestbefore1Oct 2.3 2.3 2.3 carry-outstock 6.0 4.7 5.1 surplus/requiredstock 1.6 0.0 0.6 Monthly summary 3 European Union wheat,barley and maize output 6 Crop year 2011/12 6 Crop year 2010/11 13 Cereal consumption in the animal feed sector 14 EU27 Industrial feed production 14 Breakdown of raw material consumption in animal feeds in 2011/12 15 Breakdown of raw material consumption in animal feeds in 2010/11 16 European Union wheat balances 19 Supply and internal demand 20 Price comparison between the different origins dated 6/05/2011 23 Intra-EU wheat trade 24 World wheat market 26 Analysis of ending stocks and conclusion 32 European Union barley balances 33 Supply and internal demand 33 Intra-EU barley trade 38 World barley market 38 Analysis of ending stocks and conclusion 42 European Union maize balances 45 Supply and internal demand 48 Intra-EU maize trade 49 World maize market 51 Analysis of ending stock and conclusion 53
- 2. S t r a t é g i e g r a i n s 2 2 1 - 1 2 M a y 2 0 1 1 graphs and tables Graphs Tables 2 Table1.1:area,yieldsandproductionforwheat,barleyandmaize 7 Table1.2:EuropeanUnioncerealproduction2008/09-2011/12(EU27) 8 Table1.3:changesinareaforthemaincrops(EU27) 8 Table1.4:SSPandFranceAgriMerestimatesforcropproductionsinFrance 10 Source:SSPdated5May;FranceAgriMerdated11May2011 10 Tableau1.5:estimatesforpercentageoftotalwheatproductionmeetingcriteriaformillingineachEUcountry(cropyears2008/09,2009/10and 2010/11) 13 Table2.1:changesinEU27industrialcompoundfeedproductionbycountry 14 Table2.2:factorydeliveredpricesforthemainrawmaterials(deliveredBrittany, €/t,wholeprices) 15 Table2.3:factorydeliveredpricesinCatalonia,Spain(€/t) 16 Graphic2.4:elasticityofdemandforgrainsinresponsetopricemovementsinSpain,2011/12(comparisonagainstlastmonth) 17 Table2.4:tonnageofthemainrawmaterialsusedinindustrialfeedsandon-farm(EU27) Table2.5:wheat,barleyandmaizeconsumptioninEUanimalfeeds–industrialandon-farm(Mt) Table3.1:breakdownofEU27importsbycountryoforigin 20 Table3.2:EU27wheatbalanceJuly/June2011/12(kt) 21 Table3.3:EU27wheatbalanceJuly/June2010/11(kt) 22 Table3.4:wheatpricesinvariousEUcountriesasof06/05/2011 24 Table3.5:spreadsbetweenFrenchandUKwheatpricesdated06/05/2011,deliveredItalyandSpain 24 Table3.6:intra-EU27wheattrade2011/12(kt) 25 Table3.7:intra-EU27wheattrade2010/11(kt) 25 Table3.8:FOBpricesofmajorworldwheatoriginsasof06/05/2011 26 Table3.9:worldwheatbalance(softanddurum) 28 Table3.10:estimatedRussian,UkrainianandKazakhstanwheatbalances 28 Table3.12:worldwheatbalance(softanddurum)formainexportingcountries 29 Table3.11: worldimportrequirementsforsoftwheat(excludingproducts)andprojectedexports– Mt—July-June 31 Table3.13:EU27wheat(grain)exporttothirdcountriesbymaindestinations 31 Table3.14:comparisonsofnewcropopenmarketandinterventionprices(06/05/2011) 32 Table4.1:estimatedEUmaltingbarleyproduction(2011/12and2010/11) 34 Table4.2:EU27barleybalanceJuly-June2011/12(kt) 35 Table4.3:EU27barleybalanceJuly-June2010/11(kt) 36 Table4.4:forecastforresaleofinterventionbarleyin2010/11(kt) 37 Table4.5:intra-EU27barleytrade2011/12(kt) 39 Table4.6:intra-EU27barleytrade2010/11(kt) 39 Table4.7:estimatedsupplyanddemandbalancesheetsforthemainimportingcountries 40 Table4.8:worldbarleybalance 40 Table4.9:changesinexportavailabilitiesandimportrequirementsforthemainbarleytradingcountries 40 Table4.10:EU27barleyexportsontheworldmarkettomainthirdcountrydestinations 41 Table4.11:EUbarleyinterventionstockasof06/05/2011 42 Graphic1.1:rainfallvolumesinSpain(mm)inApril 9 Graphic2.1:soymealprices 15 Graphic2.2:soya/wheatpriceratioinFrance 15 Graphic2.3:elasticityofdemandforgrainsinresponsetomaizepricemovementsinFrance,2011/12 (comparisonagainstlastmonth) 17 Graphic3.1:changesinGerman,UKandFrenchwheatprices 23 Graphic3.2:changeinworldwheatpricesonaper-monthbasis(FOBmainoriginsinUS $/t) 27 Graphic3.3:wheatfuturesattheChicagoBoardofTrade 29 Graphic3.4:changesinworldwheatstocks(includingdurumwheat) 30 Graphic4.1:worldbarleyandmaizeprices(FOBmainoriginsinUS$/t) 40 Graphic4.2:wintermaltingbarleypricesinFranceandpremiumsoverfeedbarleyprices 44 Graphic4.3:springmaltingbarleypricesinFranceandpremiumsoverfeedbarleyprices 44 Graphic5.1:Americanmaizeprices(FOBGulf) 51 Graphic5.2:Frenchmaizeprices(€/t) 54
- 3. S t r a t é g i e g r a i n s 2 2 1 - 1 2 M a y 2 0 1 1 monthly summary Monthly summary 3 Production EU cereal harvests revised down Cropyear2011/12 There has been very little rainfall since last month in most European countries and yield potentials for wheat and barley in sev- eral countries have already been impacted. Our forecast for total grain production in the EU therefore decreases by 5.1 Mt this month to 284.7 Mt (compared with 274 Mt in 2010/11). EU soft wheat production registers the largest reduction, dropping 3.6 Mt since last month to 131.5 Mt. This is neverthe- less still larger than last year’s wheat har- vest (126.4 Mt). West EU countries are the worst affected by the deterioration in yield potentials (- 3 Mt), whilst the central European countries have fared better (- 0.3 Mt). We now know the extent of winter- kill in Lithuania, and wheat production is therefore revised down by 0.3 Mt, with the corresponding area reallocated to spring crops. EU barley production is revised down by 0.3 Mt this month to 54.2 Mt (compared with 52.9 Mt in 2010/11). At the EU level, the reduction is small because a sharp de- cline in the west EU countries (- 0.9 Mt) is mostly offset by a rise in estimated pro- duction in Spain (+ 0.4 Mt thanks to good rainfall levels in April) and by a sharp rise for spring barley production in the Baltic countries (+ 0.3 Mt). EU maize grain production is revised down by 0.4 Mt this month to 59.1 Mt (compared with 54.9 Mt in 2010/11) re- flecting adjustments to crop area forecasts. French maize production is revsied down by 0.6 Mt whilst production in the central and southeast EU countries is revised up slightly (+ 0.2 Mt). Lastly, we estimate durum wheat produc- tionat8.3Mt,down0.1Mtsincelastmonth (compared with 9.1 Mt in 2010/11). Cropyear2010/11 Total grain production 2010/11 in the EU is revised up by 0.4 Mt this month to 274Mt(lastyear:291.8Mt).Thisriseisex- plained by a 0.4 Mt increase in soft wheat production to 126.4 Mt (last year: 129.1 Mt), reflecting adjustments for Latvia, Belgium and Romania. Barleyproductionisunchangedat52.9Mt (last year: 61.8 Mt). Maize grain production is revised up by 0.08 Mt this month to 54.9 Mt (last year: 57.4 Mt). EU animal feeds New increase for EU industrial feed production but reduction in demand for ce- reals Cropyear2010/11 Industrial feed output is revised up by 0.4 Mt this month to 137.9 Mt, reflecting the inclusion of the latest data from Germany in our forecasting. Estimated demand for cereals is revised up by 1 Mt this month but remains forecast significantly lower than in 2009/10 (-5.4 Mt). Cropyear2011/12 Estimated feed output in 2011/12 in- creasesinlinewiththismonth’schangesfor 2010/11.Itissettoremainatasimilarlevel to2010/11.Bycontrast,estimatedgrainus- age in animal feeds is forecast to decline in line with this month’s reductions to harvest estimates and hence availabilities for on- farm grain usage. The downward correc- tion concerns wheat and maize. Table4.12:EUbarleypricesasof06/05/2011 42 Table4.13:comparisonofthemaltingbarleysituationin2011/12withsituationsfrom2006/07to2010/11 43 Table5.1:EU27maizebalancesbycountry(kt):October-September2011/12 46 Table5.2:EU27maizebalancesbycountry(kt):October-September2010/11 47 Table5.3:breakdownofEU27imports(byorigin) 48 Table5.6:spreadbetweenmaizeandwheatpricesinFrance 49 Table5.4:intra-EU27maizetradeOctober-September2011/12(kt) 50 Table5.5:intra-EU27maizetradeOctober-September2010/11(kt) 50 Table5.7:USandworldmaizebalancesheets(Mt) 51 Table5.8:maizebalancesheetsforArgentinaandBrazil 52 Table5.9:maizebalancesheetsforRussiaandUkraine(Mt) 52 Table5.10:maizebalancesheetsforChinaandSouthAfrica(Mt) 52 Table5.11:changesinexportavailabilitiesandimportrequirementsformaincountries 52 Table5.12:MaizepricesintheEUasof7/05/2011 53 Table5.13:FrenchandSpanishmaizebalances–July-Junecropyears–for2009/2010,2010/11,2011/12 54 Table5.14:breakdownofEU27maizeinterventionstocksasof7/05/2011(kt) 54
- 4. S t r a t é g i e g r a i n s 2 2 1 - 1 2 M a y 2 0 1 1 monthly summary 4 EU wheat EU wheat stock not set to rise greatly in 2011/12 – outlook for prices essential- ly bullish but movements will hinge on export policies in Russia and Ukraine Cropyear2010/11 EU wheat production in 2010 is revised up by 0.4 Mt although wheat imports fall by 0.3 Mt. Internal demand is revised up by 0.4 Mt (increase in demand in animal feeds offset by a reduction in milling); wheat ex- portsontheworldmarketarereviseddown by0.3Mtthismonthto19.1Mt.EUwheat stock on June 30 2011 therefore remains at a similar level to last month at between 8.5 and 9 Mt, which is almost 2 Mt less than the minimum stock required (to comfort- ably supply the market from June 30 until the next harvest comes in). The situation remains particularly tight in France, UK, Central Europe (Hungary and Poland) and southeast Europe (Romania/Bulgaria). Germany’s balance has tightened since last month. After the upward price movements seen at the beginning of May, this low stock fore- cast should prevent old crop prices fall- ing sharply even though the likelihood of Russia’s and Ukraine’s early return to the market has increased. Cropyear2011/12 EU wheat production in 2011 falls sharply thismonthto131.5Mt(-3.6Mt)duetothe impactofthedroughtinthewestEUcoun- tries and to winterkill losses in Lithuania andPoland.Consequently,projectedwheat usage in on-farm animal feeds falls sharply (-1.3 Mt) but demand for wheat in animal feedsisstillforecasthigherthanin2010/11 (with demand captured from other grains). Demand for human consumption and in- dustrialusageisalsosettobehigherthanin 2010/11 (mainly biofuels sector) although this forecast has not altered significantly since last month. Intra-EU wheat trade is forecast to rise in 2011/12 on account of higher internal demand (Netherlands mainly). Import volumes are set to fall sharply compared with the levels of 2010/11 in Germany and France (assuming that grain quality is in linewiththenorminGermany).UKwheat remains much more competitive than French wheat for export to the south EU export destinations; meanwhile south-east EUwheatiscompetitiveagainstUKwheat (and much cheaper than French wheat) for the south EU. Weestimatethatwheatstocksontheworld market on July 1 2011 will be 20 Mt less than at the start of 2010/11. Global pro- duction is forecast to increase by 28 Mt but our estimate has decreased sharply since last month due to the drought in the EU, delays to plantings in the northern USA and, to a smaller extent in the Black Sea countries. World demand is still forecast high (690 Mt) due to the projected rise in demand for feed wheat at the expense of maize. Global wheat stocks at the end of 2011/12 will therefore decline slightly. World wheat trade in 2011/12 is set to be higher than in 2010/11 due to reduced production in the Middle East and higher animal sector demand in Asia. In this con- text, we still envisage that the world market will require the totality of the EU’s export availability despite the combined 14 Mt in- crease in the availabilities in the Black Sea countries (Russia, Ukraine, Kazakhstan). Since last month we have reduced our fore- cast for EU wheat availability and we now forecast exports at barely 17 Mt. With this level of exports, the outlook for EU wheat is not heavy and stocks will remain low at the end of 2011/12. Generally speaking, this situation should support new crop EU wheat prices, which are much cheaper than US prices. The fact that the outlook on the world market is fairly tight with relatively low stock forecasts is a second support factor. Nevertheless, wheat prices in the EU could still be momentarily influenced downwards when Russia and Ukraine re- sume exports in the summer. EU barley Rather heavy situation for end-2010/11 but much tighter outlook for 2011/12, despite a reduction for projected exports Cropyear2010/11 Little change this month for production, importsandexports.Demandforbarleyfor human consumption and industrial usage has been revised down this month, whilst projected barley usage in animal feeds in- creases. AsofMay6,2.5Mtofbarleyhadbeensold from intervention via traditional tender- ing (out of total estimated sales by June 30, 2011of2.7Mt)and1.6Mtviathefoodaid programme (out of total estimated sales of 2.2 Mt by June 30, 2011). The volume of intra-EU barley trade is es- timated up to 10 Mt to take account of the latest customs statistics. We now estimate a barley surplus of 2.5 Mt (over the level of stock required to com- fortably supply the market until the next harvest arrives) on June 30, 2011, mainly splitbetweenGermany,FranceandPoland. This should exert downward pressure on old crop prices. Cropyear2011/12 EUbarleyproductionin2011/12isrevised down by 0.3 Mt this month to 54.2 Mt, which is 1 Mt more than in 2010. The re- ductionsincelastmonthreflectstheimpact of the dry weather on barley yields. We es- timate malting barley production at 11 Mt (up from 10 Mt in 2010/11). Demand for barley for human consump- tion and industrial usage should slightly increase to 11.4 Mt reflecting increased demandfor maltingbarleyand ona smaller scale, increased demand for barley in bio- ethanol production. Demand for barley in animal feeds is set to fall by 1.7 Mt in 2011/12 to 39.1 Mt; the decline is due to barley’s less competitive position in industrial feeds (demand trans- ferred to wheat and maize).
- 5. S t r a t é g i e g r a i n s 2 2 1 - 1 2 M a y 2 0 1 1 monthly summary 5 Intra-EU barley trade is set to be sharply down on the level of 2010/11, due to high- er domestic availability in Spain and lower projected animal sector demand in the Benelux. Wecurrentlyforecastthatworldbarleypro- duction will increase by 11 Mt, which will offset the reduction in stocks at the begin- ningof2011/12.Consequently,withworld demandsettoincreaseby5Mt,theoutlook for the world barley market in 2011/12 is tight. Barley trade on the world market is set to remain close to the level of 2010/11 at14.6Mt.Thismonthwepublishourfirst breakdown of estimated EU exports on the world market by destination countries; we estimate total EU exports at 3 Mt (down from 5 Mt in 2010/11). This level repre- sents almost all the EU’s exportable surplus (estimated at 3.5 Mt). Hence EU barley supply and demand in 2011/12 is already looking set to balance, except in the east EU countries. This out- look is neutral in terms of new crop barley prices. The reduction in world demand addressed to the EU (due to the rise in Ukrainian availabilities) will be one of the most important factors in terms of limiting the increase potential for EU barley prices. On the other hand, prices have little poten- tial for decrease due to the tight (or at least finely balanced) outlooks for EU wheat and maize supply and demand. Malting barley production is still forecast 1 Mt up on the level of 2010. However, if the dry conditions persist, barley yields could face further reductions and quality could also be affected. The outlook for malting barley in 2011/12 is therefore set to be tighter than in 2010/11. The malting barley premiums have in- creased sharply since last month, reflecting concerns over the lack of rainfall in recent weeks. The premiums are now high and will have little potential for decrease until rains return. EU maize Outlook for 2010/11 remains heavy whilst supply and demand are close to bal- ance for 2011/12 (small surplus); tight world market will support prices Cropyear2010/11 Maize imports are revised down by 0.3 Mt this month to 6.75 Mt, reflecting the fact that imported maize remains uncompeti- tive through the last months of crop year 2010/11; Ukrainian maize is the only ori- gin that is competitive in the EU over this period, and only for south EU import des- tinations. In addition, the risk of trace pres- ence of a GM variety not yet authorised in the EU will restrict the volume of imports from Brazil until August. Demand for maize in the bioethanol sector is revised up a little this month (+0.15 Mt). Demand for maize in animal feeds is re- vised down by 0.3 Mt. Projected EU maize stock on September 30 2011 therefore de- creases slightly this month but the EU bal- ancesheetstillhasapotentialmaizesurplus of 1.6 Mt. The outlook for EU maize therefore re- mains intrinsically bearish. However, the situation on the world market is still ex- tremely tight for 2010/11 and 2011/12 (feed demand currently allotted to maize on the world will need to be rationed and transfer to other grains). If world prices rise from their current levels, imported maize willbecome lessattractivein theEU, which wouldallowtheEUmarkettotightenwith- out a corresponding need for EU prices to decrease significantly. Nevertheless barley intervention stocks will continue to be re- leased onto the internal market generating possible downward pressure on EU maize prices. Cropyear2011/12 Despite a reduction to estimated French maize production this month, we still en- visage that the EU’s maize harvest in 2011 will be significantly better than in 2010 (+4.2 Mt to 59.1 Mt). Imports from third countries are forecast to fall by 2 Mt to 4.8 Mt due to the less competitive position of imported third country maize compared with 2010/11 (based on current prices for November 2011 deliveries). Internal de- mand for maize in the EU is still forecast up by 2.7 Mt compared with 2010/11. Animal sector demand is forecast up by 2.4 Mt, mostly on account of increased maize usage in on-farm feeds and of demand for human consumption and industrial usage (up by 0.3 Mt). EU maize stock is forecast todecreaseby1Mtthrough2011/12to5.1 Mt; this level is significantly greater (+0.6 Mt) than the minimum stock needed to comfortably supply the market until the next harvest arrives. Maize stocks on the world market are fore- cast to rise by 6 Mt in 2011/12 to 115 Mt. However, at this stage, this increase cannot be taken completely for granted because it will depend on a significant rise in produc- tion (+44 Mt to 850 Mt), and at present maize plantings in the USA are badly be- hind schedule; this could mean that esti- mated maize area will need to be reduced if conditions are not ideal for plantings during the next few weeks. Ending stock 2011/12 is currently estimated at 13% of annual global demand, which remains relatively low. Even though rationing of de- mand in animal feeds (over to feed wheat) has already begun, it has not happened to a sufficientextenttoenableworldsupplyand demand to balance. New crop maize prices therefore have no potential for decrease until harvest outcomes are certain. On the contrarytheystillhaveanincreasepotential in order to generate further reductions in demand; this will be intensified if plantings in the USA do not match current forecasts. At present new maize prices in the EU are cheaper than new crop prices. However, the outlook in 2011/12 is now much less heavy than the situation in 2010/11: this price differential should therefore narrow, either via a decrease in old crop prices or an increaseinnewcropprices.Thelattercould be emphasized by the tight situation on the world market. However, if farmers planting intentions in the USA have been fully at- tained by mid-June and the crops develop correctly in Ukraine and Russia, this would generate a less tight outlook for 2011/12, which could allow for a reduction in 2011- crop prices.
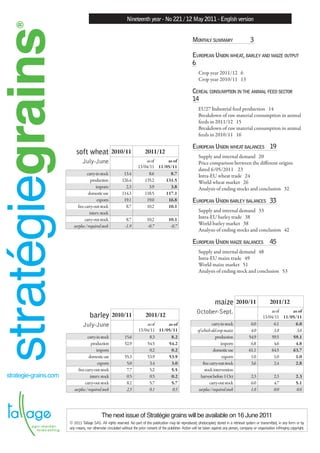
- 6. S t r a t é g i e g r a i n s 2 2 1 - 1 2 M a y 2 0 1 1 european union wheat, barley and maize output European Union wheat,barley and maize output 6 Soft Wheat (Mt) EU 27 Barley (Mt EU 27 Maize (Mt) EU 27 129,1 126,4 131,5 2009/2010 2010/2011 2011/2012 61,8 52,9 54,2 2009/2010 2010/2011 2011/2012 57,4 54,9 59,1 2009/2010 2010/2011 2011/2012 Crop year 2011/12 There has been very little rainfall since last month in most European countries and yield potentials for wheat and barley in several countries have already been impacted. Our forecast for total grain production in the EU therefore decreases by 5.1 Mt this month to 284.7 Mt (compared with 274 Mt in 2010/11). EU soft wheat production registers the largest reduction, dropping 3.6 Mt since last month to 131.5 Mt. This is nevertheless still larger than last year’s wheat harvest (126.4 Mt). West EU countries are the worst affected by the deterioration in yield potentials (- 3 Mt), whilst the central European countries have fared better (- 0.3 Mt). We now know the extent of winterkill in Lithuania, and wheat production is therefore revised down by 0.3 Mt, with the corresponding area reallocated to spring crops. EU barley production is revised down by 0.3 Mt this month to 54.2 Mt (compared with 52.9 Mt in 2010/11). At the EU level, the reduction is small because a sharp decline in the west EU countries (- 0.9 Mt) is mostly offset by a rise in estimated production in Spain (+ 0.4 Mt thanks to good rainfall levels in April) and by a sharp rise for spring barley production in the Baltic countries (+ 0.3 Mt). EU maize grain production is revised down by 0.4 Mt this month to 59.1 Mt (compared with 54.9 Mt in 2010/11) reflecting adjustments to crop area forecasts. French maize production is revsied down by 0.6 Mt whilst production in the central and southeast EU countries is revised up slightly (+ 0.2 Mt). Lastly, we estimate durum wheat production at 8.3 Mt, down 0.1 Mt since last month (compared with 9.1 Mt in 2010/11). Crop year 2010/11 Total grain production 2010/11 in the EU is revised up by 0.4 Mt this month to 274 Mt (last year: 291.8 Mt). This rise is explained by a 0.4 Mt increase in soft wheat production to 126.4 Mt (last year: 129.1 Mt), reflecting adjustments for Latvia, Belgium and Romania. Barley production is unchanged at 52.9 Mt (last year: 61.8 Mt). Maize grain production is revised up by 0.08 Mt this month to 54.9 Mt (last year: 57.4 Mt). Crop year 2011/12 Droughtpersist–rainisnowindispensable In the last issue of Stratégie grains (SG 220), we highlightedhowdryMarchhadbeenthroughout mostofEuropeandthatrainswereurgentlyneeded tomaintainwheatandbarleyyieldpotentials.As thingsturnedout,therewasbarelyanyrainfallin EuropeduringAprilorthebeginningofMay.The rainthatdidfallwaslimitedtotheMediterranean- rim countries and – to a lesser extent – Bulgaria andRomania.AcrossmostoftheEU,cumulative rainfallhasbeenatleast50%lessthantheseasonal normforthistimeofyear.Somerainisexpectedin Europebetweennowandmid-May;itwillneed tobequitesignificanttoproviderespitefromthe stresscurrentlyaffectingthegraincrops. The wheat plants in the EU are mostly in the extension phase and are rapidly approaching ear formation and flowering, thanks to the high temperatures. For most of the EU27 countries (excepttheMediterraneanandBalkancountries), the persistence of a rainfall deficit could mean that plant biomass at flowering is smaller than normal. This handicap is likely to be particularly pronounced in west Europe, where wheat development is the most far advanced and the impact of drought stress is most severe. Any handicaps facing the plants at the present time can still be offset – at least in part – if weather conditionsattheendofthegrowthcycleturnout ideal(humidandcool,withnoexcessiverainfall). By contrast, if the drought persists or if there is a prolongedperiodofverywetweather(aswasthe case in 2007), this could cause a sharp decline in yieldpotentials.Weatherconditionsinthecoming weekswillneedtobeverycloselymonitored. Springbarleyplantingsarenowmostlycompleted intheEU,exceptinthenortherlyregions(suchas Finland)wheretheyarestilltakingplace.Generally speaking, the warm, dry weather has been favourabletoaquickcompletionofspringbarley plantings.Plantemergencehasmostlyhappened veryquicklyandtheyoungplantsnowneedwater. Maize plantings have also progressed at a rapid
- 7. S t r a t é g i e g r a i n s 2 2 1 - 1 2 M a y 2 0 1 1 european union wheat, barley and maize output Thelatestupdatestoourestimatescanbeconsultedonwww.strategie-grains.com.Toaccessthisserviceyouwillneedtosubscribetothe«Crop»module. 7 wheat maize Area(Mha) Yield(t/ha) Production(Mt) Area(Mha) Yield(t/ha) Production(Mt)08/09 09/10 10/11 11/12 08/09 09/10 10/11 11/12 08/09 09/10 10/11 11/12 08/09 09/10 10/11 11/12 08/09 09/10 10/11 11/12 08/09 09/10 10/11 11/12 Germany 3.21 3.21 3.30 3.31 8.09 7.82 7.04 7.45 25.95 25.12 23.24 24.63 0.52 0.46 0.45 0.48 9.81 9.75 8.79 9.63 5.10 4.53 3.99 4.64 Belgium-Lux 0.24 0.23 0.23 0.24 8.16 8.87 8.56 8.40 1.95 2.00 2.00 2.02 0.07 0.07 0.06 0.07 11.89 12.07 11.95 12.32 0.86 0.81 0.75 0.82 Denmark 0.64 0.74 0.76 0.74 7.86 8.04 6.61 7.25 5.02 5.94 5.06 5.36 Spain 1.53 1.23 1.44 1.48 3.66 2.75 3.27 3.32 5.59 3.40 4.69 4.92 0.36 0.35 0.32 0.35 8.92 8.89 9.38 9.07 3.24 3.07 3.01 3.17 France 5.06 4.73 4.92 5.04 7.29 7.66 7.24 7.14 36.90 36.23 35.64 36.01 1.76 1.74 1.55 1.52 9.13 8.90 8.75 9.08 16.04 15.50 13.57 13.80 Greece 0.20 0.21 0.17 0.18 3.02 2.33 2.10 2.48 0.60 0.50 0.36 0.44 0.24 0.19 0.15 0.16 7.61 7.76 7.49 7.64 1.85 1.47 1.12 1.20 Ireland 0.10 0.08 0.07 0.09 9.06 8.12 8.75 8.95 0.95 0.67 0.64 0.78 Italy 0.70 0.61 0.62 0.62 5.38 5.05 5.34 5.29 3.74 3.10 3.32 3.27 1.09 1.00 0.90 0.97 9.52 8.61 9.00 9.06 10.36 8.62 8.11 8.82 TheNetherl. 0.16 0.15 0.15 0.14 8.73 9.29 8.86 8.61 1.37 1.40 1.36 1.23 0.03 0.03 0.02 0.02 11.80 12.78 11.76 11.00 0.35 0.34 0.28 0.26 Portugal 0.09 0.05 0.04 0.04 2.30 1.68 1.44 1.74 0.20 0.09 0.06 0.06 0.11 0.10 0.09 0.10 6.39 6.55 7.01 6.83 0.70 0.63 0.63 0.67 UnitedKingd. 2.08 1.78 1.94 2.01 8.28 7.93 7.67 7.84 17.23 14.08 14.88 15.74 Austria 0.27 0.28 0.28 0.28 5.80 5.07 5.12 5.20 1.58 1.43 1.41 1.47 0.22 0.20 0.20 0.21 11.32 10.83 9.72 10.80 2.45 2.17 1.96 2.30 Finland 0.22 0.22 0.21 0.22 3.64 4.10 3.43 3.83 0.79 0.89 0.72 0.85 Sweden 0.36 0.37 0.40 0.40 6.13 6.10 5.42 5.92 2.20 2.28 2.18 2.35 0.00 0.00 0.00 0.00 6.49 6.40 6.25 6.25 0.01 0.01 0.01 0.01 Poland 2.28 2.35 2.41 2.42 4.07 4.11 3.77 3.92 9.27 9.64 9.08 9.49 0.32 0.27 0.30 0.33 5.81 6.23 5.76 6.14 1.84 1.71 1.73 2.02 Hungary 1.09 1.12 0.98 0.96 4.95 3.84 3.71 4.38 5.40 4.28 3.62 4.19 1.19 1.18 1.06 1.28 7.46 6.40 6.57 6.82 8.90 7.54 6.98 8.74 CzechRepublic 0.76 0.79 0.80 0.83 5.80 5.26 5.00 5.23 4.44 4.17 3.98 4.32 0.11 0.11 0.10 0.12 7.55 8.45 6.70 7.70 0.86 0.89 0.69 0.89 Slovakia 0.36 0.35 0.33 0.33 4.87 4.05 3.59 4.04 1.75 1.41 1.18 1.33 0.15 0.14 0.17 0.20 7.34 6.97 6.10 6.65 1.13 0.99 1.05 1.32 Estonia 0.11 0.11 0.12 0.13 3.18 3.01 2.71 3.01 0.34 0.34 0.32 0.39 Latvia 0.26 0.29 0.30 0.30 4.26 3.63 3.21 3.76 1.09 1.04 0.97 1.14 Lithuania 0.40 0.48 0.52 0.47 4.88 4.54 3.31 3.91 1.97 2.18 1.71 1.84 0.01 0.01 0.01 0.01 4.21 4.33 6.66 5.00 0.03 0.02 0.05 0.04 Slovenia 0.04 0.03 0.03 0.03 4.53 3.96 4.37 4.34 0.16 0.14 0.15 0.13 0.04 0.04 0.04 0.04 7.32 7.84 8.50 8.32 0.32 0.30 0.31 0.30 Cyprus/Malta 0.01 0.01 0.01 0.01 1.77 3.12 2.91 2.57 0.01 0.02 0.02 0.02 Romania 1.95 2.02 1.91 1.94 3.60 2.60 3.12 2.99 7.02 5.25 5.97 5.79 2.25 2.30 2.29 2.50 3.28 3.23 3.82 3.38 7.38 7.44 8.75 8.45 Bulgaria 1.07 1.09 1.01 1.07 4.16 3.25 3.74 3.53 4.46 3.53 3.79 3.79 0.32 0.30 0.32 0.33 3.80 4.37 6.05 4.92 1.22 1.33 1.96 1.64 EU25 20.15 19.44 20.04 20.25 6.38 6.19 5.82 6.02 128.49 120.36 116.61 121.97 6.23 5.88 5.43 5.85 8.67 8.27 8.14 8.37 54.04 48.59 44.22 49.00 EU27 23.17 22.54 22.97 23.26 6.04 5.73 5.50 5.66 139.98 129.13 126.37 131.55 8.80 8.48 8.05 8.68 7.12 6.76 6.83 6.80 62.63 57.36 54.93 59.09 barley Area(Mha) Yield(t/ha) Production(Mt) 08/09 09/10 2010/11 2011/12 08/09 09/10 2010/11 2011/12 08/09 09/10 2010/11 2011/12 wint. spri. total wint. spri. total wint. spri. total wint. spri. total wint. spri. total wint. spri. total Germany 1.96 1.88 1.30 0.35 1.65 1.23 0.35 1.57 6.10 6.54 6.56 4.84 6.20 6.34 4.83 6.01 11.97 12.29 8.55 1.69 10.25 7.78 1.67 9.45 Belgium-Lux 0.06 0.06 0.05 0.01 0.05 0.04 0.01 0.05 7.51 8.01 8.26 5.50 7.95 7.87 5.85 7.64 0.48 0.51 0.38 0.03 0.42 0.35 0.03 0.38 Denmark 0.72 0.59 0.14 0.43 0.57 0.13 0.50 0.63 4.73 5.72 5.47 5.13 5.21 5.55 5.13 5.22 3.40 3.39 0.79 2.20 2.99 0.74 2.56 3.29 Spain 3.49 3.05 0.45 2.42 2.87 0.49 2.57 3.05 3.19 2.33 2.78 2.88 2.87 2.89 3.02 3.00 11.11 7.11 1.25 6.98 8.23 1.41 7.77 9.17 France 1.80 1.88 1.16 0.42 1.58 1.09 0.44 1.54 6.76 6.84 6.51 6.07 6.39 6.48 6.23 6.41 12.17 12.88 7.56 2.54 10.10 7.10 2.77 9.87 Greece 0.12 0.12 0.11 0.11 0.11 0.11 2.85 2.33 1.98 1.98 2.40 2.40 0.33 0.28 0.22 0.22 0.25 0.25 Ireland 0.18 0.19 0.03 0.14 0.16 0.03 0.13 0.16 7.16 6.28 8.59 6.69 7.01 8.36 6.87 7.15 1.30 1.17 0.23 0.92 1.15 0.25 0.89 1.14 Italy 0.32 0.31 0.28 0.28 0.29 0.29 3.80 3.42 3.59 3.59 3.70 3.70 1.23 1.05 0.99 0.99 1.06 1.06 TheNetherl. 0.05 0.04 0.00 0.03 0.03 0.00 0.03 0.03 6.18 6.96 5.90 6.15 6.17 6.29 0.31 0.31 0.04 0.17 0.20 0.02 0.18 0.21 Portugal 0.04 0.04 0.04 0.04 0.03 0.03 2.32 1.70 1.83 1.83 2.05 2.05 0.10 0.07 0.07 0.07 0.07 0.07 UnitedKingd. 1.03 1.14 0.38 0.54 0.92 0.36 0.54 0.91 5.95 5.83 6.37 5.22 5.70 6.38 5.45 5.82 6.14 6.67 2.43 2.81 5.24 2.30 2.97 5.27 Austria 0.19 0.18 0.09 0.08 0.17 0.08 0.07 0.15 5.21 4.60 5.39 3.80 4.61 5.54 3.80 4.69 0.97 0.84 0.46 0.32 0.78 0.44 0.29 0.72 Finland 0.59 0.56 0.42 0.42 0.48 0.48 3.64 3.87 3.21 3.21 3.65 3.65 2.13 2.17 1.34 1.34 1.75 1.75 Sweden 0.40 0.36 0.02 0.29 0.31 0.01 0.33 0.34 4.23 4.69 4.69 3.98 4.03 5.47 4.28 4.33 1.67 1.68 0.08 1.14 1.23 0.08 1.41 1.49 Poland 1.21 1.16 0.21 0.91 1.12 0.17 0.93 1.10 3.00 3.44 3.92 3.00 3.17 3.84 3.11 3.22 3.62 3.98 0.81 2.73 3.54 0.65 2.89 3.54 Hungary 0.33 0.32 0.19 0.10 0.29 0.17 0.10 0.27 4.45 3.32 3.56 3.01 3.36 4.15 3.36 3.85 1.47 1.06 0.66 0.31 0.97 0.69 0.34 1.03 CzechRepublic 0.48 0.45 0.11 0.28 0.39 0.11 0.27 0.38 4.65 4.40 4.50 3.91 4.07 4.54 4.21 4.30 2.24 2.00 0.50 1.09 1.58 0.50 1.15 1.65 Slovakia 0.21 0.20 0.02 0.12 0.14 0.01 0.10 0.11 4.18 3.45 3.07 2.76 2.79 3.86 3.48 3.53 0.89 0.68 0.05 0.34 0.39 0.05 0.34 0.40 Estonia 0.14 0.14 0.00 0.10 0.10 0.00 0.12 0.12 2.56 2.68 2.41 2.41 2.60 2.60 0.35 0.38 0.00 0.25 0.25 0.00 0.30 0.30 Latvia 0.13 0.10 0.01 0.09 0.10 0.01 0.11 0.12 2.34 2.54 1.99 2.02 2.02 2.09 2.45 2.43 0.31 0.27 0.03 0.18 0.21 0.02 0.27 0.29 Lithuania 0.33 0.28 0.01 0.22 0.23 0.00 0.36 0.36 2.95 3.09 2.50 2.36 2.37 2.79 2.80 0.98 0.86 0.04 0.51 0.55 0.01 1.00 1.01 Slovenia 0.02 0.02 0.02 0.00 0.02 0.02 0.00 0.02 3.99 3.52 3.79 4.11 3.78 4.13 0.08 0.07 0.07 0.01 0.08 0.06 0.01 0.08 Cyprus/Malta 0.03 0.02 0.02 0.02 0.03 0.03 1.12 1.85 1.60 1.60 1.75 1.75 0.04 0.04 0.04 0.04 0.04 0.04 Romania 0.39 0.52 0.34 0.18 0.52 0.27 0.18 0.45 3.07 2.28 2.99 1.66 2.54 2.78 1.91 2.44 1.21 1.18 1.02 0.30 1.32 0.76 0.33 1.10 Bulgaria 0.23 0.25 0.22 0.01 0.23 0.18 0.02 0.20 3.96 3.23 3.41 2.68 3.38 3.20 2.56 3.14 0.91 0.82 0.74 0.02 0.77 0.59 0.05 0.64 EU25 13.83 13.11 4.64 6.95 11.59 4.41 7.44 11.85 4.58 4.56 5.44 3.68 4.39 5.41 3.85 4.43 63.28 59.76 25.26 25.56 50.83 23.87 28.59 52.46 EU27 14.45 13.88 5.20 7.13 12.34 4.87 7.63 12.50 4.53 4.45 5.20 3.63 4.29 5.18 3.80 4.34 65.40 61.76 27.03 25.89 52.91 25.22 28.98 54.20 Table1.1:area,yieldsandproductionforwheat,barleyandmaize
- 8. S t r a t é g i e g r a i n s 2 2 1 - 1 2 M a y 2 0 1 1 european union wheat, barley and maize output 8 cereals areas(Mha) chg.vs yields chg.vs production(Mt) chg.vs 2008/09 2009/10 2010/11 2011/12 2010/11 2008/09 2009/10 2010/11 2011/12 2010/11 2008/09 2009/10 2010/11 2011/12 2010/11 softwheat 23.2 22.5 23.0 23.3 1% 6.0 5.7 5.5 5.7 3% 139.9 129.1 126.4 131.5 4% barley 14.5 13.9 12.3 12.5 1% 4.5 4.5 4.3 4.3 1% 65.4 61.8 52.9 54.2 2% maize 8.8 8.5 8.0 8.7 8% 7.1 6.8 6.8 6.8 -0% 62.6 57.4 54.9 59.1 8% durum 3.2 2.9 3.0 2.7 -10% 3.2 2.9 3.0 3.0 1% 10.1 8.5 9.1 8.3 -9% rye 2.7 2.8 2.6 2.5 -2% 3.4 3.4 3.0 3.1 5% 9.3 9.6 7.8 8.0 3% othercereals 7.5 7.4 7.1 7.2 1% 3.3 3.4 3.2 3.3 2% 25.0 25.5 22.9 23.6 3% totalcereals 59.8 58.0 56.1 56.9 1% 5.2 5.0 4.9 5.0 2% 312.3 291.8 274.0 284.7 3,9% areas(kha) commercialcropyears 2008/09 2009/10 2010/11 2011/12 Totalcereals 59810 58040 56120 56940 Totaloilseeds(includedcropsgrownonset-aside) 10670 11260 11630 11620 Totalproteincrops 930 1180 1470 1360 Silage 5160 5300 5650 5790 EUset-aside&fallowland(nonfoodcropsexclud.) 5810 6300 7060 6160 ofwhichEU15set-aside 5600 3990 4350 3890 Sugarbeet 1520 1590 1590 1660 Totalareacultivated+set-aside 83900 83670 83520 83530 Table1.3:changesinareaforthemaincrops(EU27) Source:Stratégiegrains Table1.2:EuropeanUnioncerealproduction2008/09-2011/12(EU27) pace across Europe and are completed, or nearly finished,inFrance,Germany,Italy,Austria,Czech RepublicandHungary.Plantingscontinuesapace inPoland,RomaniaandBulgaria,wheretherather coolandrelativelywetspringhasslowedplanting activities. In those areas affected by drought, rates of maize plant emergence are sometimes uneven.Neverthelessitisstilltooearlytoenvisage a reduction in maize yield potentials; yields will mostly depend on weather conditions during flowering(inJuly)andduringthefinalphaseofthe development. Germany: weather has remained dry Weather update and condition of crops April was very dry in Germany and rainfall was extremely scarce (-58% compared with the seasonal average recorded 1961-1990). Very high temperatures have accompanied the drought; April 2011 is the second hottest April onrecordsince1881.Thesituationisparticularly problematic in the north and east of Germany, whichhavereceivedevenlessrainthanthecentre and south. At our time of writing (May 9), the weather forecast was not especially promising: rainfallwillcontinuetobescarceandtemperatures aresettoremainratherhighatleastuntilafterMay 15. The wheat and barley plants in Germany are still in the extension phase. However, the high temperaturesrecordedinrecentweekshavecaused plant growth rates to accelerate and the growth cycle is now around two weeks in advance of normal;theplantswillshortlybeginearformation. Damageassociatedwithstemextensionoccurring atatimeofdroughtandheatstresscaninpartbe compensatedforifconditionsareidealattheend of the growth cycle (cool and humid without excessive rainfall). By contrast, if the drought continueswhilsttheearformationandflowering takesplace,thisinitialhandicapwillbeintensified andwillgeneratesignificantlossestoyieldpotential forwhichtheplantswillnotbeabletocompensate. Ifthisturnsouttobethecase,thenumberofgrains per ear would be reduced and this component of overall yield could not offset reductions in the number of ears per m2 or low plant biomass (whicharebothlikelytobelowthisyear).Itistoo earlytodefinitivelyenvisageaverysharpfallinyield potentials,butitnowseemsimprobablethathigh wheatyieldswillbeachievedinGermanythisyear. The dry, hot weather has meant that maize plantingshaveprogressedquicklyandasofMay9, plantingactivitieswerealmostfinished. Production We have not changed our estimates for planted areasinGermany. Given the weather situation and outlook in Germany, we have decreased our yield forecasts for all the straw crops. Our yield estimates still have a significant variation potential depending onweatherconditionsinthecomingweeks.Ifthe droughtcontinues,theycouldbesubjecttosharp reduction. Softwheatyieldisreviseddownfrom7.8t/hato 7.45 t/ha. This is still much better than the very low yield obtained in 2010 (7.04 t/ha); in that yearadroughtinAprilwasfollowedbytorrential rains at harvest time, which delayed the harvest andcausedlargelossesofgrainsinthefield.Wheat productionin2011isreviseddownby1.2Mtthis monthto24.63Mt(23.24Mtin2010/11). Winterbarleyyieldisreviseddownfrom6.61t/ ha to 6.34 t/ha (6.56 t/ha in 2010/11). Spring barley yield is revised down from 4.93 t/ha to 4.83 t/ha (4.84 t/ha in 2010/11). Total barley productionisforecastdownby370ktto9.45Mt (-790ktcomparedwith2010/11). Ryeyieldisreviseddownfrom5.18t/hato4.87 t/ha(4.6t/hain2010/11);productionisrevised down from 3.08 Mt to 2.89 Mt (2.85 Mt in 2010/11). Triticale production is revised down from 2.27 Mtpreviouslyto2.18Mt(2.2Mtin2010/11). Oats production is revised down from 0.81 Mt previouslyto0.78Mt(0.6Mtin2010/11). Maize production is forecast stable compared withlastmonthat4.64Mt(3.99Mtin2010/11). Yields will mainly be impacted by weather conditions towards the end of the growth cycle (floweringtoharvest). We now estimate total grain production in Germanyat44.75Mt(43.37Mtin2010/11). Belgium/Luxembourg: harvest forecast revised down slightly As elsewhere in west Europe, Belgium has been facing a drought situation for several weeks. We havereducedouryieldforecastsslightlytoreflect this. We now estimate softwheat production at 2.02Mt(downfrom2.06Mtforecastpreviously) and barley production at 382 kt (down from 399 kt previously and 420 kt in 2010/11). Maizeproductionisforecastat818kt(750ktin 2010/11). We now estimate total grain production in BelgiumandLuxembourgat3.34Mt(compared with3.27Mtin2010/11). Denmark: rainfall scarce MarchwasdryinDenmark,andthelackofrain continued through April, with rainfall in April
- 9. S t r a t é g i e g r a i n s 2 2 1 - 1 2 M a y 2 0 1 1 european union wheat, barley and maize output 9 totalling just 39% of the norm for this month. Due to the fact that crop development is not as far advanced as in the other countries, the dry conditionshavenotyethadtoounfavourablean impact on the crops, especially given that some farmers took the precaution of irrigating crops to limit the drought’s impact. Nevertheless, rains are needed very urgently if a sharp fall in yield potentials,forbothwinterandspringcrops,isto be avoided. We have made small reductions this monthtoouryieldforecasts,toreflecttheprobable smaller plant biomass at flowering. If conditions areverygoodbetweennowandtheharvest,itwill be possible for the plants to compensate for this handicap. Soft wheat yield is revised down from 7.38 t/ ha to 7.25 t/ha (6.61 t/ha in 2010/11). Planted areaisrevisedupby10khato739kha(764kha in2010/11).Productionthereforedecreasesvery slightly from 5.38 Mt to 5.36 Mt (5.06 Mt in 2010/11). For barley, the adjustments to planted area compensate for the small reduction in yield and estimated production therefore remains stable at 3.3Mt(2.99Mtin2010/11),including2.56Mt ofspringbarley(2.2Mtin2010/11). WeestimatetotalgrainproductioninDenmark at9.34Mt(upfrom8.72Mtin2010/11). Spain: beneficial rains Weather update and condition of crops Last month, we highlighted that rainfall levels throughthewinterhadbeensatisfactoryinSpain, althoughtheeastofthecountryhadreceivedless rainthantherestofthecountry. The mean rainfall volume in April (a critical month in terms of yield determination) totalled 49.6 mm, very close to the average of the last 10 years. Aragon and Catalonia again received very little rainfall whereas rainfall levels were good in the main grain producing regions (Andalusia, Extremadura, Castile and Leon and Castile-la Mancha, see graphic 1.1); yield potentials are thereforemaintained.Ifrainfalllevelscontinueto be good through the next few weeks, we could increaseouryieldforecastssignificantly. At the beginning of May, the wheat plants were endingthestemextensionphasewithsomealready beginning to flower in the southern regions; the barleywasnearingtheendofitsfloweringphase. Production At this stage of plant development, the impact of the rains on potential soft wheat yield is still moderate, and we have therefore not altered our yieldforecastof4.92Mt(4.69Mtin2010/11). Durum wheat development is more advanced, partlybecauseitismostlygrowninthesouthern regions; yield potential has increased as a result of the good rainfall levels. Durum wheat yield is revisedupfrom2.3t/hato2.46t/ha(1.93t/hain 2010/11).Productionisrevisedupfrom1Mtto 1.07Mt(0.91Mtin2010/11). Barleyreapsthemaximumbenefitfromtherains and yield is revised up from 2.86 t/ha to 3 t/ha (2.87t/hain2010/11);productionisrevisedup from8.76Mtto9.17Mt(8.23Mtin2010/11). Nochangethismonthforestimatedmaizegrain productionat3.17Mt(3.01Mtin2010/11). We estimate total grain production in Spain at 19.94Mt(upfrom18.29Mtin2010/11). France: drought conditions persist Weather update and condition of crops After a very dry month in March, drought conditionscontinuedthroughApril.Thevolume of rainfall was very much lower than normal throughout France at around 75% less than the norm (recorded 1971-2000) in a good half of the country. The rainfall deficit was particularly pronounced in Normandy, Picardy, in the Paris region, part of the Centre region, Poitou- CharentesandthePaysdeLoire.Thescarcityof rainfall and the high temperatures have already led to the introduction of irrigation restrictions, notablyinPoitou-CharentesandtheParisregion. AtthebeginningofMay,therewasalittlerainfall innorthernFrance,mostlyintheformoflocalised downpours that were insufficient to bring any significant(andmuchneeded)respitetothecrops. Rainfallvolumesareforecasttoremainsmalluntil atleastMay12,whichwillcontributetoafurther intensificationofthestresslevelscurrentlyaffecting thecrops. AsofMay6,Frenchwheathadalmostreachedthe earformationphase,around10to15daysearlier thannormal.Thismeansthattheriskofdamage fromnightfrostswillbemuchhigherduringear formation and flowering, when the plants are extremely sensitive to colder temperatures. We willmonitorthispointclosely,becauseanysudden drop in temperature could impact negatively on earfertility. Meanwhile,thefactthattheentirestemextension phasetookplaceindryconditionswillmeanthat secondary tillers are much less abundant than normal and that the plants face a shortage of nitrogen.Nitrogenthatwasdistributedinthefields didnotdissolvedcorrectlyintothesoilandthusit hasnotbeenproperlyabsorbed.Plantbiomassat flowering will therefore probably be smaller than normal.Thishandicapisnotnecessarilyasetback as far as yield is concerned because if weather conditions are clement at the end of the growth cycle(mildandhumidwithoutexcessiverainfall) theplantswillbeabletocompensateatleastinpart forthisdisadvantage.However,forthisscenarioto playout,asignificantvolumeofrainwillneedto fallverysoon. Meanwhile, the dry weather in April was very favourable in terms of maize plantings. These beganatthebeginningofAprilandwerealmost finishedbythebeginningofMay,around10days earlier than normal. Maize plant emergence has happenedveryquickly. Production Ourcropareaforecaststakeaccountofthelatest estimates published by SSP and FranceAgriMer. This month, we have significantly reduced our yieldforecastsforallthestrawcropstoreflectthe Graphic1.1:rainfallvolumesinSpain(mm)inApril Source:AgenciaEstataldeMeteorologia(AEMET)
- 10. S t r a t é g i e g r a i n s 2 2 1 - 1 2 M a y 2 0 1 1 european union wheat, barley and maize output 10 area(kha) SSP FranceAgriMer May2011 May2011 10/11 11/12 evo. 10/11 11/12 evo. wintersoftwheat 4908 5004 2,0% na na softwheatwint.+spring 4921 5016 1,9% 4921 5018 2,0% winterbarley 1163 1094 -5,9% 1165 1096 -5,9% springbarley 419 453 8,1% 422 455 7,8% barleywint.+spring 1582 1547 -2,2% 1588 1552 -2,3% winterdurum 493 464 -5,9% na na durumwint.+spring 505 471 -6,8% 503 462 -8,2% rye 30 29 -0,7% 30 29 -1,8% winteroats 59 58 -2,0% na na oatswint.+spring 98 95 -3,8% 99 94 -5,8% triticale 382 384 0,6% 378 386 2,1% maize 1571 1563 -0,6% 1543 1520 -1,5% sorghum 52 45 -13,4% 52 45 -13,8% total cereals 9141 9150 0,1% 9113 9104 -0,1% winterrape 1459 1523 4,4% na na rapewint.+spring 1465 1527 4,2% 1457 1520 4,3% sun 695 699 0,6% 698 710 1,7% proteincrops 404 312 -22,7% na na extremelydryweatherconditions. Softwheatyieldfallsfrom7.43t/hato7.14t/ha (7.24 t/ha in 2010/11). Production is therefore revised down by almost 1.5 Mt to 36.01 Mt (35.64Mtin2010/11).Thisestimatehasafurther significantvariationpotentialthatwilldependon weatherconditionsinthecomingweeks.Ifrainfall remainsscarce,yieldpotentialscouldsufferfurther decrease; if conditions at the end of the growth cycleturnouttobeideal(relativelycoolandhumid withoutexcessiverains),yieldscouldincreasealittle. Estimated winter barley yield falls from 6.78 t/ ha to 6.48 t/ha (6.51 t/ha in 2010/11). Spring barleyyielddecreasesfrom6.47t/halastmonth to 6.23 t/ha (6.07 t/ha in 2010/11). We now forecastwinterbarleyproductionat7.1Mt,down from 7.44 Mt previously (7.56 Mt in 2010/11) and spring barley production at 2.77 Mt, down from 2.85 Mt previously (2.54 Mt in 2010/11). As in the case of soft wheat, these estimates have asignificantpotentialforvariationdependingon weatheroutcomesinthenextfewweeks. Durumwheatyieldfallsfrom5.14t/hato4.83 t/ha (5.09 t/ha in 2010/11); production is thus revised down by 140 kt to 2.19 Mt (2.55 Mt in 2010/11). Wehavereducedestimatedmaizegrainareaby70 khathismonthto1.52Mha.Thisestimatereflects thelatestforecastsfromSSPandFranceAgriMer and includes a forecast of 40 kha transfer from maize grain production to silage. This reflects the fact that fodder stocks from 2010 are low. In all probability, it will not be possible to offset this shortfall with increased hay production in 2011.Unlessmaizeyieldsareverygood,livestock farmers (especially in Brittany and the Pays de Loire)willneedtodivertsomemaizegrainfields tosilageproduction.Wewillamendthisforecast to reflect the change in maize yield potentials. Taking account of this smaller maize grain area, productionisreviseddownfrom14.44Mtto13.8 Mt(13.57Mtin2010/11). We now estimate total grain production in Franceat64.97Mt(65.12Mtin2010/11). Greece: no change TemperaturesinGreecewerelowerthannormal in April, causing a slight deceleration in crop development. Rainfall levels were satisfactory at thebeginningofMay. Nochangetoourproduction forecasts: Softwheat:440kt(360ktin2010/11) Barley:250kt(220ktin2010/11) Durumwheat:1Mt(1Mtin2010/11) Maizegrain:1.2Mt(1.12Mtin2010/11) Totalgrainproduction:2.99Mt(2.81Mtin 2010/11). Italy: yields impacted by drought in the north AselsewhereinwestEurope,therehasbeenvery little rainfall in northern Italy. Maize plantings were completed within the ideal timeframe but thenewplantshaveemergedatvariedrates.Crop conditionthereforedependsonplantingdatesand soiltypes. The soft wheat reached flowering at the end of Aprilandthe lack of water has already impacted yield potentials for wheat and barley in the northernItalianregions. Bycontrast,therewasmorerainfallthannormal in the south and the centre during April. Yield potentials are therefore unchanged in the south and remain good in the centre, where plantings tookplaceverylate. Toreflectthissituation,wehaverevisedsoftwheat yield down from 5.38 t/ha to 5.29 t/ha (5.34 t/ hain2010/11).Softwheatproductionisrevised downfrom3.33Mtpreviouslyto3.27Mt(3.32 Mtin2010/11). Durumwheatproductionisreviseddownby10 ktto3.48Mt(3.99Mtin2010/11).Theexpected reduction in durum wheat production is much smaller because this crop is mostly grown in the centreandsouth. Barley yield is revised down from 3.76 t/ha previously to 3.7 t/ha (3.59 t/ha in 2010/11); thisgeneratesanexpectedharvestof1.06Mt(-15 kt since last month) compared with 0.99 Mt in 2010/11). Maizegrainproductionisunchangedthismonth at8.82Mt(8.11Mtin2010/11). WenowestimatetotalgrainproductioninItaly at17.3Mt(17.12Mtin2010/11).. Netherlands: wheat yield revised down slightly TheNetherlandsisalsoextremelydryonaccount ofthelackofrainfall.AtthebeginningofMay,the crops were in a satisfactory state due to existing moisture content in the soil, thanks to good rainfallvolumesthroughtheautumnandwinter. However, this indicates that the plants’ root systems do not extend very deep and that their capacitytoresistdroughtwillbelow. Intermsofdevelopment,thewheatisnowinfull extensionphase,thespringbarleyisemergingand themaizeiscurrentlybeingplanted. Softwheatyieldisreviseddownfrom8.72t/ha to 8.61 t/ha (8.86 t/ha in 2010/11); this would generateaharvestof1.23Mt,downfrom1.25Mt estimatedpreviouslyand1.36Mtin2010/11). No change this month to our other production forecasts: Barley:210kt(200ktin2010/11) Maizegrain:260kt(280ktin2010/11) Wenowestimatetotalgrainproductioninthe Netherlandsat1.78Mt(1.92Mtin2010/11). Portugal: little change LiketheothercountriesofMediterraneanEurope, Portugal received abundant rainfall at the end of April and crop development was good at the Table1.4:SSPandFranceAgriMerestimatesforcrop productionsinFrance Source:SSPdated5May;FranceAgriMerdated11May2011
- 11. S t r a t é g i e g r a i n s 2 2 1 - 1 2 M a y 2 0 1 1 european union wheat, barley and maize output 11 beginningofMay. Maize grain plantings were taking place at this time and we have increased slightly our forecast for maize area by 10 kha to 100 kha (90 kha in 2010/11). We estimate maize grain production at 670 kt, up from 610 kt previously (630 kt in 2010/11). Nochangetoourotherharvestestimates: Softwheat:65kt(thesameasin2010/11) Barley:66kt(75ktin2010/11). WeestimatetotalgrainproductioninPortugalat 0.92Mt(0.88Mtin2010/11). UK: yields impacted by lack of rain Weather update and condition of crops After an unusually dry month of March, the absence of rainfall continued throughout the whole of April (rainfall averaged less than 20 mm, less than 35 % of the seasonal norm). The rainfalldeficitconcernsEnglandandWales,with the southern and eastern regions affected most severely. Wherepossible,farmershavebeenirrigatingcrops to maintain yield potentials. However, in areas oflightsoil,yieldpotentialswerealreadyreduced as of the start of May. In deeper soils, the impact hasbeenlesspronounced.Rainfallinthecoming two weeks will be critical in determining crop developmentoutcomes. At the beginning of May, the winter barley had reached the end of its extension phase (last leaf emergence) following rapid development due to thewarmconditions.Winterwheatdevelopment is also more advanced than in previous years: the earliest sown plants are already at third node emergencewhilstthelastplantssownarenowat theendoftillering. In Scotland, spring barley plantings have been completedinlinewithfarmers’plantingintentions. Production Wehavereducedouryieldforecastsforthestraw cereals. Softwheatyieldisreviseddownfrom8.01t/ha to7.84t/ha(7.67t/hain2010/11);productionis reviseddownfrom16.07Mtpreviouslyto15.74 Mt(14.88Mtin2010/11). Weestimatewinterbarleyyielddownfrom6.58t/ hapreviouslyto6.38t/ha(6.37t/hain2010/11). Winterbarleyproductionisforecastdownby70 ktto2.3Mt(2.43Mtin2010/11).Springbarley registersasmallerreductioninprojectedyieldthis month, dropping from 5.52 t/ha to 5.45 t/ha (5.22t/halastyear);productionisreviseddownby 35ktto2.97Mt(2.81Mtin2010/11). Oatyieldisalsoreviseddownfrom5.94t/hato 5.88 t/ha (5.52 t/ha in 2010/11); this comes in addition to 10 kha decline in estimated area to 115kha(125khain2010/11).Oatproductionis thereforereviseddownby80ktto680kt(685kt in2010/11). WeestimatetotalgrainproductionintheUKat 21.83Mt(20.94Mtin2010/11). Austria: dry conditions recorded Austria is also suffering from a lack of rain; the countrymostrecentlyreceivedsignificantrainsin mid-March. Since thestart ofthe winter,Austria hasonlyreceivedaround50%ofitsnormalrainfall volume.Plantstresshasbeenintensifiedbecauseof high temperatures, which remained above the seasonalaveragethroughoutApril. Despite this, the winter crops remain in good condition: yield potential has not yet suffered a negative impact. Maize plantings have been completed and crop emergence has been satisfactory. No change to our production estimates this month: Softwheat:1.47Mt(1.41Mtin2010/11). Barley:720kt(780ktin2010/11) Maizegrain:2.3Mt(1.96Mtin2010/11) Totalgrainproduction: 5.16 Mt (4.78 Mt en2010/11). Finland: spring crop plantings have started After a very harsh winter in Finland, the snow hasnowcompletelymeltedinthesouthandthe springhasarrived.Vegetationgrowthhasresumed andtheconditionofthewintercropswasdeemed satisfactoryatthebeginningofMay. Spring crop plantings started in good time. On May6,around15%ofplantingshadalreadytaken place and the remaining area should be planted quicklythankstothedry,mildconditionsforecast forthecomingweeks. No change to our production forecasts since last month: Softwheat:0.85Mt(0.72Mtin2010/11) Barley:1.74Mt(1.34Mtin2010/11) Oat:0.94Mt(0.81Mtin2010/11) Total grain production: 3.67 Mt (up from 2.99Mtin2010/11). Sweden: spring crop plantings finished SpringcropplantingswerecompletedinSweden during the last week of April, around a week laterthannormal.RainsatthestartofAprilwere beneficial for the 50 % of fields planted by that stage, and plant emergence was good thanks to the mild temperatures. Since then, conditions have stayed dry and the state of the crops varies significantlyfromplacetoplace. No change to our production forecasts since last month: Softwheat:2.35Mt(2.18Mtin2010/11) Barley:1.49Mt(1.23Mtin2010/11) Oat:0.78Mt(0.56Mtin2010/11) Totalgrainproduction:4.94Mt(4.34Mtin 2010/11). Poland: yield potentials hit by harsh winter Weather update and condition of crops WeatherconditionsstayedcoldinPolandthrough March,butspringhasnowarrived.Temperatures weremilderthannormalthroughthelast10days of April, allowing plant development to progress rapidly and offset several days development shortfall caused by the long winter. Plant developmentwassatisfactoryatthebeginningof Maybutrainsarenowurgentlyneeded,especially in the west, in order to prevent a loss of yield potential. Thewheatplantswerestartingupwardextension at the beginning of May and farmers were just beginningtosowthemaize,althoughnighttime temperatureswerestillcold,fallingbelowfreezing inthecentreofthecountry. Production Poland’sstatisticsofficepublisheditsfirstestimates forwintercropareas;wehavetakenthesefigures intoaccount. Wehavealsoamendedouryieldestimatestoreflect our hypothesis that the minimum temperatures recordedinPolandduringthewinterwillhavehad anegativeimpactonthewintercereals. Softwheatyield is revised down from 4 t/ha to 3.92t/ha(3.77t/hain2010/11)andproduction down from 9.78 Mt to 9.49 Mt (9.08 Mt in 2010/11). Winter barley yield falls from 3.96 t/ha to 3.84 t/ha (3.92 t/ha in 2010/11). Total barley production is now estimated at 3.54 Mt, down from3.56Mtlastmonth(3.55Mtin2010/11). Rye area is revised up by 25 kha this month to 1.4 Mha (the same as in 2010/11); this offsets thesmallfallinestimatedyieldfrom2.42t/hato 2.37 t/ha (2.34 t/ha in 2010/11). Production is unchangedat3.31Mt(3.27Mtin2010/11). Oatproductionisreviseddownby15ktto1.42 Mt(1.33Mtin2010/11). No change for maize grain production this monthat2.02Mt(1.73Mtin2010/11). We now estimate total grain production in Polandat27.53Mt(26.83Mtin2010/11).
- 12. S t r a t é g i e g r a i n s 2 2 1 - 1 2 M a y 2 0 1 1 european union wheat, barley and maize output 12 Hungary: maize plantings completed Weather update and condition of crops Last month, we forecast that farmers’ planting intentions for spring barley would not be fully realised due to the comparatively low level of plantings completed by the end of March. In effect,thedryconditionsinAprilallowedfarmers tocompletespringbarleyplantingstothelevelof their original intentions and also meant that the totalityofmaizeplantingcouldbecompleted.At thebeginningofMay,maizeplantemergencewas satisfactory. The wheat plants were in full extension phase during the first days of May and development is judgedsatisfactory.Theonlyworryconcernsthose fieldsthatwerefloodedlastautumn,wherewheat developmentisverymixed:thisconcernsaround 80khaofwheat,locatedinareaswhereplantswere asphyxiated. Rainfall is now needed in Hungary to prevent a declineinyieldpotentials. Production We have decreased our forecast for soft wheat yield potential to reflect the negative outlook for fieldsinareashitbyflooding;productionisrevised downby35ktthismonthto4.19Mt(3.62Mtin 2010/11). Spring barley area is revised up by 10 kha to 100 kha (the same as in 2010/11). Total barley productionisrevisedupfrom1Mtlastmonthto 1.03Mt(0.97Mtin2010/11). No change for maize grain production this monthat8.74Mt(6.98Mtin2010/11). WeestimatetotalgrainproductioninHungary at14.68Mt(upfrom12.29Mtin2010/11). Czech Republic: beneficial rains at the end of April Weather conditions through April were dry and hotintheCzechRepublic.Farmerswereableto completespringbarleyplantingswithintheideal plantingwindowandindeedmaizegrainplantings werealmostfinishedbythebeginningofMay. Although insufficient to meet requirements, the CzechRepublicreceivedsomerainfallattheend ofApril,whichbroughtsomerespitetothecrops. No change this month to estimated soft wheat productionat4.32Mt(3.98Mtin2010/11). Spring barley production is revised down by 10 khathismonthto270kha(280khain2010/11). Totalbarleyproductionisnowestimatedat1.65 Mt, down from 1.7 Mt previously (1.58 Mt in 2010/11). Maizegrainproductionisrevisedupby30ktthis monthto0.89Mt(0.69Mtin2010/11). We estimate total grain production in Czech Republic at 7.51 Mt (up from 6.88 Mt in 2010/11). Slovakia: small increase for maize Rainfall levels have also been insufficient in Slovakia during the last few weeks; the last significantrainfallwasinmid-March.Attheendof April,cropdevelopmentwasneverthelessjudged satisfactory. The wheat is in full extension phase andrainisnowneededurgentlyifyieldpotentials aretobemaintained. Farmers were able to complete spring barley plantings within the ideal planting window and maizeplantingsarenowalmostfinished. No change this month to estimated soft wheat productionat1.33Mt(1.19Mtin2010/11). Springbarleyproductionisreviseddownby10 khato100kha(125khain2010/11);totalbarley productionisforecastat400kt,downfrom440kt lastmonth(390ktin2010/11). Thischangebenefitsprojectedmaizegrainarea, which increases 10 kha to 200 kha (170 kha in 2010/11).Maizeproductionisnowestimatedat 1.32Mt,upfrom1.26Mtpreviously(1.05Mtin 2010/11). WeestimatetotalgrainproductioninSlovakiaat 3.23Mt(upfrom2.81Mtin2010/11). Lithuania: very significant winterkill Lastmonth,weindicatedthatthewintercropsin Lithuaniahadsufferedsubstantialdamageduring thewinterbutthatitwastooearlytoestimatethe fullextent.Sincethen,Lithuania’sstatisticsofficehas published its estimate of crop losses to winterkill, whichisindeedveryhighthisyear.Inresponseto themilderwinterconditionsofrecentyears,during thelastthreeyearsfarmersinLithuaniahaveopted toplantincreasingwintercropareasintheautumn inordertoobtainbetteryields.However,thisyear the strategy of planting winter rather than spring cropshasnotpaidoff. Wehaveadoptedtheofficialestimatesforwinter losses,whichgeneratesasignificanttransferofcrop areasintospringgrainproduction,forwhichyields arelower.Overall,thechangesmeanthatourcrop areaforecastsarenowsimilartothoseof4or5years ago. Winter wheat area is revised down by 100 kha this month to 260 kha (370 kha in 2010/11); spring wheat area is revised up by 160 kha to 210kha(150khain2010/11).Totalsoftwheat production therefore falls by 320 kt to 1.84 Mt (1.71Mtin2010/11). Winter barley has all but disappeared and therefore spring barley area rises sharply by 125 khato360kha(220khain2010/11).Totalbarley productionisnowestimatedat1Mt,upfrom0.7 Mtpreviously(0.55Mtin2010/11). We now estimate total grain production in Lithuania at 3.45 Mt (up from 2.77 Mt in 2010/11). Romania: maize area revised up slightly RomaniareceivedplentyofrainfallinApril;atthe beginningofMay,allthecropswereinasatisfactory condition. However, temperatures have been cooler than normal and plant development was aroundaweekbehindscheduleatthebeginning ofMay. Thealterationtosoftwheatproductionin2010 impacts yield for2011; it rises from 2.94 t/ha to 2.99t/ha;productiongains90kt,risingto5.79Mt (5.97Mtin2010/11). Springbarleyareaisreviseddownfrom195kha to 175 kha (180 kha in 2010/11). Total barley productionisnowestimatedat1.1Mt,downfrom 1.14Mtlastmonth(1.32Mtin2010/11). Maize grain area benefits from this adjustment, rising from 2.47 Mha to 2.5 Mha (2.29 Mha in 2010/11).Maizegrainproductionisrevisedupby 80ktto8.45Mt(8.75Mtin2010/11). We now estimate total grain production in Romania at 15.84 Mt (down from 16.57 Mt in 2010/11). Bulgaria: development shortfall Temperatures were below the seasonal norm in Bulgaria during April. This slowed winter crop development,whichisnowalmost10daysbehind schedulecomparedwithanormalyearinthewest of the country and 15 to 20 days behind in the east.Wateravailabilitywasnotacauseforconcern duringApril. Therateofmaizeplantingsalsoslowedwhilethe ideal window for plantings closes around May 10. We are currently working on the basis that farmerswillfulfiltheirplantingintentionsgiventhe attractivenessofthiscropinfinancialterms. Nochangetoourproduction estimates: Softwheat:3.79Mt(thesameas2010/11) Barley: 0.64Mt(0.77Mtin2010/11) Maizegrain:1.64Mt(1.96Mtin2010/11) Totalgrainproduction:6.25Mt(6.71Mtin 2010/11).
- 13. S t r a t é g i e g r a i n s 2 2 1 - 1 2 M a y 2 0 1 1 european union wheat, barley and maize output 13 2008/09 2009/10 2010/11 (Mt) Total output % milling Milling output Total output % milling Milling output Total output % milling Milling output Germany 25.95 91% 23.59 25.12 92% 23.04 23.24 43% 9.99 Belgium-Lux 1.95 20% 0.39 2.00 18% 0.36 2.00 19% 0.38 Denmark 5.02 17% 0.85 5.94 15% 0.89 5.06 10% 0.51 Spain 5.59 93% 5.19 3.40 95% 3.23 4.69 93% 4.36 France 36.90 90% 33.21 36.23 82% 29.71 35.64 89% 31.72 Greece 0.53 50% 0.26 0.50 30% 0.15 0.36 30% 0.11 Ireland 0.95 10% 0.10 0.67 10% 0.07 0.64 15% 0.10 Italy 3.74 80% 2.99 3.10 75% 2.33 3.32 75% 2.49 TheNetherl. 1.37 20% 0.27 1.40 18% 0.25 1.36 19% 0.26 Portugal 0.20 95% 0.19 0.09 95% 0.08 0.06 95% 0.06 UnitedKingd. 17.23 25% 4.31 14.08 30% 4.22 14.88 29% 4.31 Austria 1.58 50% 0.79 1.43 60% 0.86 1.41 70% 0.99 Finland 0.79 20% 0.16 0.89 30% 0.27 0.72 67% 0.49 Sweden 2.20 15% 0.33 2.28 15% 0.34 2.18 15% 0.33 Poland 9.27 80% 7.42 9.64 80% 7.71 9.08 45% 4.08 Hungary 5.40 60% 3.24 4.28 60% 2.57 3.62 50% 1.81 CzechRepublic 4.44 91% 4.04 4.17 50% 2.09 3.98 50% 1.99 Slovakia 1.75 80% 1.40 1.41 70% 0.99 1.18 50% 0.59 Estonia 0.34 70% 0.24 0.34 90% 0.31 0.32 70% 0.23 Latvia 1.09 80% 0.87 1.04 97% 1.01 0.97 70% 0.68 Lithuania 1.97 80% 1.58 2.18 95% 2.07 1.71 70% 1.20 Slovenia 0.16 50% 0.08 0.14 50% 0.07 0.15 50% 0.08 Cyprus/Malta 0.01 34% 0.00 0.02 35% 0.01 0.02 20% 0.00 Romania 7.02 35% 2.46 5.25 30% 1.57 5.97 20% 1.19 Bulgaria 4.46 34% 1.52 3.53 35% 1.23 3.79 20% 0.76 EU 27 139.90 68% 95.48 129.13 66% 85.43 126.37 54% 68.70 Tableau1.5:estimatesforpercentageoftotalwheatproductionmeeting criteriaformillingineachEUcountry(cropyears2008/09,2009/10and2010/11) Source:Stratégiegrains Crop year 2010/11 Wheatproductionrevisedup Belgium/Luxembourg: final production estimates published Belgium’s statistics office published its final productionfiguresforthe2010harvest.Wehave adoptedthesefigures. The2010harvestsinBelgiumandLuxembourg nowtotal: Softwheat:2Mt,upfrom1.92Mtpreviously (2Mtin2009/10) Barley:416kt,upfrom400ktpreviously(507 ktin2009/10) Maize:748kt,upfrom671ktpreviously(810 ktin2009/10). Latvia: new official production estimates Latvia’sstatisticsofficepublishednewproduction estimates,whichwehaveadopted. Softwheatrisessharplyby70ktto0.97Mt(1.04 Mtin2009/10). Barleyproductionfallsby10ktto210kt(270kt in2009/10). Romania: wheat production revised up To reflect wheat export volumes shipped by Romaniain2010/11,wehaveincreasedestimated soft wheat production. Yield is revised up from 2.99 t/ha previously to 3.12 t/ha (2.6 t/ha in 2009/10)andproductionnowtotals5.97Mt,up from5.72Mtlastmonth(5.25Mtin2009/10).
- 14. S t r a t é g i e g r a i n s 2 2 1 - 1 2 M a y 2 0 1 1 cereal consumption in the animal feed sector Cereal consumption in the animal feed sector 14 Mt 2008/2009 2009/2010 2010/2011 2011/2012 Tot. cat. pig pou Tot. cat. pig pou Total cat. pig pou Total cat. pig pou Apr11 May11 Apr11 May11 Germany 20.4 6.2 9.0 5.3 20.4 6.0 9.0 5.4 20.6 21.0 6.3 9.3 5.5 20.7 21.1 6.3 9.3 5.5 Belg.-Lux 6.4 1.3 3.8 1.4 6.6 1.2 3.8 1.5 6.6 6.6 1.3 3.8 1.5 6.6 6.6 1.3 3.8 1.5 Denmark 4.6 1.0 3.0 0.6 4.2 0.9 2.8 0.5 4.3 4.3 0.9 2.8 0.5 4.2 4.2 0.9 2.8 0.5 Spain 17.8 3.8 9.6 4.5 17.3 3.7 9.2 4.4 17.2 17.2 3.8 9.0 4.4 17.3 17.3 3.8 9.0 4.5 France 19.8 5.1 6.1 8.6 19.2 4.9 5.8 8.5 19.5 19.5 5.2 5.7 8.7 19.5 19.5 5.3 5.5 8.7 Greece 1.9 0.5 0.7 0.7 1.9 0.5 0.7 0.7 2.0 2.0 0.5 0.8 0.7 2.0 2.0 0.5 0.8 0.7 Ireland 3.0 1.9 0.6 0.5 3.0 1.9 0.6 0.5 3.1 3.1 2.0 0.6 0.5 3.1 3.1 2.0 0.6 0.5 Italy 12.3 3.7 3.2 5.4 12.2 3.5 3.2 5.5 12.1 12.1 3.4 3.2 5.5 12.2 12.2 3.5 3.2 5.6 Netherl. 13.1 3.4 6.0 3.7 12.9 3.4 5.9 3.6 13.0 12.9 3.4 5.9 3.6 12.9 12.9 3.4 5.8 3.6 Portugal 3.2 0.8 1.0 1.4 3.1 0.8 0.9 1.4 3.1 3.1 0.8 0.9 1.4 3.1 3.1 0.8 0.9 1.4 U.King. 12.4 4.7 1.5 6.2 12.9 4.9 1.6 6.4 13.2 13.1 5.0 1.6 6.5 13.3 13.2 4.9 1.7 6.5 Austria 1.1 0.4 0.2 0.4 1.1 0.4 0.2 0.4 1.1 1.1 0.4 0.2 0.5 1.1 1.1 0.4 0.2 0.5 Finland 1.3 0.6 0.4 0.3 1.2 0.6 0.3 0.3 1.2 1.2 0.6 0.3 0.3 1.2 1.2 0.6 0.3 0.3 Sweden 1.9 1.0 0.4 0.5 1.8 0.9 0.4 0.5 1.8 1.8 0.9 0.4 0.5 1.8 1.8 0.9 0.4 0.6 Poland 6.8 0.7 1.6 4.5 7.1 0.7 1.5 5.0 7.2 7.2 0.7 1.5 5.0 7.1 7.1 0.7 1.5 4.8 Hungary 3.8 0.5 1.6 1.7 3.7 0.5 1.5 1.7 3.6 3.6 0.5 1.4 1.7 3.6 3.6 0.5 1.4 1.7 CzechRep. 2.6 0.5 1.0 1.1 2.5 0.5 0.9 1.0 2.5 2.5 0.5 0.9 1.0 2.4 2.4 0.5 0.9 1.0 Slovakia 0.7 0.2 0.2 0.3 0.6 0.2 0.2 0.2 0.6 0.6 0.2 0.2 0.2 0.6 0.6 0.2 0.2 0.3 Estonia 0.2 0.0 0.1 0.0 0.2 0.0 0.1 0.0 0.2 0.2 0.0 0.1 0.0 0.2 0.2 0.0 0.2 0.0 Latvia 0.2 0.0 0.1 0.0 0.2 0.0 0.1 0.0 0.2 0.2 0.0 0.1 0.0 0.2 0.2 0.0 0.1 0.0 Lithuania 0.4 0.1 0.1 0.2 0.4 0.1 0.1 0.2 0.4 0.4 0.1 0.1 0.2 0.4 0.4 0.1 0.1 0.2 Slovenia 0.5 0.1 0.1 0.2 0.5 0.1 0.1 0.3 0.5 0.5 0.1 0.1 0.3 0.5 0.5 0.1 0.1 0.3 Cyprus/Malta 0.2 0.1 0.0 0.1 0.2 0.1 0.0 0.1 0.2 0.2 0.1 0.0 0.1 0.2 0.2 0.1 0.0 0.1 Romania 2.8 0.1 1.2 1.5 2.8 0.1 1.1 1.5 2.7 2.7 0.1 1.1 1.5 2.7 2.7 0.1 1.1 1.5 Bulgaria 0.7 0.0 0.2 0.4 0.6 0.0 0.2 0.4 0.6 0.6 0.0 0.2 0.4 0.6 0.6 0.0 0.2 0.4 EU 27 138.2 37.0 51.7 49.5 136.7 36.0 50.4 50.2 137.5 137.9 36.7 50.4 50.7 137.4 137.8 37.0 50.1 50.8 Crop year 2010/11 Industrial feed output is revised up by 0.4 Mt this month to 137.9 Mt, reflecting the inclusion of the latest data from Germany in our forecasting. Estimated demand for cereals is revised up by 1 Mt this month but remains forecast significantly lower than in 2009/10 (-5.4 Mt). Crop year 2011/12 Estimated feed output in 2011/12 increases in line with this month’s changes for 2010/11. It is set to remain at a similar level to 2010/11.By contrast, estimated grain usage in animal feeds is forecast to decline in line with this month’s reductions to harvest estimates and hence availabilities for on-farm grain usage. The downward correction concerns wheat and maize. EU27 Industrial feed production Feed production revised up Weestimateindustrialfeedoutputin2010/11 at 137.9 Mt (136.7 Mt in 2009/10); our es- timate has increased by 0.4 Mt this month, mainly to reflect a higher production forecast for Germany. The increase relates to pig feed (+0.26Mtto50.4MtintheEU,thesameasin 2009/10)andpoultryfeed(+0.13Mtto50.7 Mtcomparedwith50.2Mtin2009/10). Industrialfeedoutputin2011/12isestimated at 137.8 Mt, close to the level of 2010/11 (up from137.4Mtlastmonth);thiscomprises37 Mt of cattle feed (no change compared with lastmonth),50.1Mtofpigfeed(upfrom49.8 Mt last month) and 50.8 Mt of poultry feed (50.7Mtlastmonth). Situation in each country Germany: feed production estimated up Germany’s agriculture ministry (BMELV) has published industrial feed output figures for January 2011 and has made sharp upward corrections to its figures for July through December 2010. We have therefore increased ourforecastforcattlefeedoutputinGermany by 70 kt to 6.3 Mt (6 Mt in 2009/10), pig feed output by 0.23 Mt to 9.3 Mt (9 Mt in 2009/10)andpoultryfeedoutputby0.17Mt to 5.5 Mt (5.4 Mt in 2009/10). Combined productionof thethreefeed types is now esti- matedat21Mt(upfrom20.6Mtlastmonth and20.4Mtin2009/10).Totalfeedoutputin 2011/12 also increases to 21.1 Mt (compared with 20.7 Mt previously) comprising 6.3 Mt ofcattlefeed,9.3Mtofpigfeedand5.5Mtof poultryfeed. Table2.1:changesinEU27industrialcompoundfeedproductionbycountry
- 15. S t r a t é g i e g r a i n s 2 2 1 - 1 2 M a y 2 0 1 1 cereal consumption in the animal feed sector 15 0,9 1,1 1,3 1,5 1,7 1,9 2,1 2,3 2,5 2,7 2,9 3,1 3,3 3,5 July Sept. Nove. Janu. Marc. May 2007/08 2009/10 2008/09 2010/11 2011/12 140 160 180 200 220 240 260 280 300 320 340 360 380 140 180 220 260 300 340 380 420 460 500 540 580 Jan-87 Jun-88 Nov-89 Apr-91 Sep-92 Feb-94 Jul-95 Dec-96 May-98 Oct-99 Mar-01 Aug-02 Jan-04 Jun-05 Nov-06 Apr-08 Sep-09 Feb-11 Jul-12 € / ton $ / ton 48% soymeal, CIF Rotterdam $/t 48% soymeal, French ports (€/t) May-Jun2011 Jul-Sep2011 Oct-Dec2011 Beg.Apr (€/t) Beg.May (€/t) %chge Beg.Apr (€/t) Beg.May (€/t) %chge Beg.Apr (€/t) Beg.May (€/t) %chge feedpeas 242 247 +2% 228 250 +10% 231 250 +8% rapemeal 198 203 +3% 193 201 +4% 195 200 +3% sunmeal(French) 168 153 -9% 170 158 -7% 166 156 -6% soyameal 330 307 -7% 313 310 -1% 322 312 -3% rapeseeds 478 461 -4% 458 459 +0% 459 458 -0% sunseeds na na na na na na wheatbrans 163 138 -15% 160 150 -6% 155 138 -11% beetpulp 225 225 +0% 216 230 +6% 188 230 +22% fishmeal 1330 1240 -7% 1330 1240 -7% 1330 1240 -7% groundnutmeal na na na na na na vegetableoil 937 922 -2% 937 927 -1% 937 934 -0% wheat 248 253 +2% 209 231 +11% 212 234 +10% barley 202 212 +5% 189 210 +11% 192 213 +11% maize 229 247 +8% 232 250 +8% 204 221 +8% tapioca65 na na na na na na citrus 225 227 +1% 225 227 +1% 200 231 +16% CGF 204 200 -2% 200 179 -11% 180 182 +1% molasses 187 187 +0% 187 187 +0% 187 187 +0% Graphic2.1:soymealprices Graphic2.2:soya/wheatpriceratioinFrance UK: cattle and poultry feed produc- tion estimated down DEFRAhaspublishedindustrialfeedproduc- tiondataforFebruary2011intheUK,which we have incorporated into our forecasting. Projected cattle feed output in 2010/11 falls 50 kt to 5 Mt (4.9 Mt in 2009/10) and poul- tryfeedproduction70ktto6.5Mt(6.4Mtin 2009/10); no change for pig feed production at1.6Mt(thesameas2009/10). Breakdown of raw material consumption in animal feeds in 2011/12 Demand for the main cereals revised down since last month to reflect lower har- vest forecasts Demandforwheatandmaizeinanimalfeedsis reviseddownsharplythismonth(byaround1 Mtforbothcereals),whilstestimateddemand forbarleyremainsclosetolastmonth’sforecast. The main change in the case of wheat relates toon-farmbarleyusageinFranceandBritain; demand for wheat in industrial feeds remains close to the level forecast last month. The re- duction in barley usage in on-farm feeds is ex- plained by this month’s reduction to harvest forecastsinFranceandBritain. Inthecaseofmaize,thereductionconcernsde- mandformaizeinon-farmfeedsinGermany, France (lower harvest forecasts) and Britain (reduction in quantity of maize purchased on the market for use in on-farm animal feeds, reflectingprojecteddeclineinUKmaizeavail- abilities); demand for maize is also revised down in industrial feeds in Germany and the Benelux. Demandforwheatandmaizeinanimalfeeds isstillforecasthigherthanin2010/11,butthe growthissettobelesssharpthanweforecasta monthago. Weestimatetotalgrainusageinanimalfeedsat 156.8Mt,downby1.6Mtsincelastmonth;it isnowsettobe0.9Mtlowerthanthevolume usedin2010/11. By contrast, demand for oilmeals is still set to be greater than in 2010/11 because the protein-rich commodities are set to be more competitivethantheenergy-richcommodities in 2011/12 whilst the overall volume of com- moditiesusedintheanimalfeedsectorissetto remainthesameasin2010/11. France: small growth for maize Estimatemaizeusagehasrisenslightlysincelast month. The old crop maize price for the first months of 2011/12 is now close the level at which maize becomes attractive for inclusion inpigfeeds. We estimate grain usage in French industrial Table2.2:factorydeliveredpricesforthemainrawmaterials (deliveredBrittany, €/t,wholeprices)
- 16. S t r a t é g i e g r a i n s 2 2 1 - 1 2 M a y 2 0 1 1 cereal consumption in the animal feed sector 16 Avr2011 May2011 change Jul2011 5/4/11 5/5/11 5/5/11 €/t €/t €/t Span./orthirdcountrymaizefactorydelivered 252 242 96% 252 Frenchmaizefactorydelivered 249 246 99% 251 Spanish/EUbarleyfactorydelivered 252 220 87% 200 Span.wheatfactorydelivered Import.wheatfactorydeliv. 252 250 99% 222 US/Spanish/Frenchsorghum 240 242 101% 240 tapioca cornglutenfeed soymeal44% 300 306 102% 300 feedsin2011/12at: 4.7 Mtforwheat(nochange) 1.6 Mtforbarley(nochange) 3.4 Mtformaize(lastmonth:3.3 Mt). July-September 2011 Barleyremainspresentincattlefeed,although projected demand in this period declines in favour of wheat inclusions. Wheat remains the dominant ingredient in pig feeds, but the maizepriceforthisperiodisclosetothelevelat whichmaizewillstartattractingdemand(con- trarytothebarleyprice,whichwouldneedto drop by 20 €/t to be competitive enough for inclusioninthisfeedtype). October-December 2011 Contrarytothesituationlastmonth,feedpeas are no longer competitive for inclusion in pig feeds; this follows an increase in the pea price andadeclineinthesoymealprice. Feedpeainclusionsinpigfeedsthereforefalls, with demand share transferring to soya and maize. Spain: reduction for barley Little change this month to projected feed composition. Wheat usage remains high in pig and cattle feedforthefirstmonthsofthecropyear,prior to the arrival of new crop maize; thereafter wheat is absent from the feeds (except meat poultryfeeds). We estimate grain usage in Spanish industrial feedsin2011/12at: 4.4Mtforwheat(nochange) 4.0Mtforbarley(lastmonth:4.2Mt) 4.3 Mtformaize(nochange). July-September 2011 Nochangesincelastmonth.Allthethreemain cereals(wheat,barleyandmaize)arecompeti- tive in cattle and pig feeds; maize dominates in layer hen feeds and wheat in meat poultry feeds. October-December 2011 Projectedbarleyusagedeclinesinpoultryfeeds withdemandtransferringtosorghum. Thereislittlechangetotheotherfeedtypesfor this period: maize usage remains high in pig, cattle and layer hen feeds. Wheat is sidelined intomeatpoultryfeedonly. Netherlands: reductions for barley and maize with demand share transferred to wheat WeestimatetotaldemandforcerealsinDutch animalfeedsatthesamelevelaslastmonth(6.5 Mt); within this total, wheat gains demand shareduetoitsimprovedcompetitiveposition forthefirstmonthsofcropyear2011/12. We estimate grain usage in Dutch industrial feedsat: 2.9 Mtforwheat(lastmonth:2.7 Mt) 1.4 Mtforbarley(lastmonth:1.5 Mt) 2.3 Mtformaize(lastmonth:2.4 Mt). July-September 2011 Wheat’s demand share rises sharply against maize in pig feeds, and against barley in layer hen feeds. Projected barley usage declines in cattle feed against substitution commodities (citrus). October-December 2011 Barley loses demand share in pig feeds with demand transferring to maize, millfeeds and oilmeals. Breakdown of raw material consumption in animal feeds in 2010/11 Small increase in demand for the main cereals Combined demand for wheat, barley and maizeisnowestimatedat136 Mt(lastmonth: 135.3). Demandforallthreecerealshasincreased. In the case of wheat, the growth concerns Germany, Spain, France (usage in industrial feeds revised up) and Denmark (on-farm feeds).Inthecasesofbarleyandmaize,thein- creasesconcernFranceandGermanyonly. Despite this increase, grain usage in animal feeds in 2010/11 remains forecast sharply down on the level of 2009/10 (-5.4 Mt for all cerealscombined). Total demand for oilmeals is revised down from53.3Mtlastmonthto52.4Mt,although itisstillforecasthigherthanin2009/10(51.4 Mt).Thereductioncomparedwithlastmonth relates mainly to soymeal, projected demand forwhichisestimatedat32.5Mt,downfrom 33.2Mtlastmonth(30Mtin2009/10).This reductionismadetotieinwiththelatestnew supplystatistics. France: wheat, barley and maize usage estimated up Afterlastmonth’sreduction,thismonthseesa riseinprojectedgrainusage(wheat,barleyand maize)inanimalfeedsfrom9.6Mtlastmonth to9.8Mt. We estimate grain usage in French industrial feedsat: 4.3 Mtforwheat(lastmonth:4.2 Mt) 2.0 Mtforbarley(lastmonth:1.9 Mt) 3.5 Mtformaize(lastmonth:3.4Mt). January-March 2011 Wehaveincreasedestimatedmaizeusageinthe feedstoreflectprovisionaldataforgrainusage byindustrialfeedmanufacturersforMarch1 . April-June 2011 The barley and maize prices have increased since last month. Therefore wheat+enzyme basedmeatpoultryfeedsmovetoamorecom- petitive position against maize-based feeds. Meanwhile wheat and barley make gains in cattle feeds against substitution commodities (cornglutenfeed,alfalfa)andmaize. Spain: small reduction for barley and gain for wheat Projected barley usage is in decline with de- mand share transferring to wheat in the last weeksofcropyear2010/11. We estimate grain usage in Spanish industrial 1 Source :FranceAgriMer Table2.3:factorydeliveredpricesinCatalonia,Spain(€/t)
- 17. S t r a t é g i e g r a i n s 2 2 1 - 1 2 M a y 2 0 1 1 cereal consumption in the animal feed sector 17 2007/08 2008/09 2009/10 2010/11 2011/12 % Mt % Mt % Mt % Mt % Mt cereals 71% 161.3 73% 166.4 73% 163.1 72% 157.7 71% 156.8 ofwhich wheat 21% 48.1 24% 54.4 24% 54.4 22% 49.4 23% 50.4 maize 22% 50.7 21% 48.7 20% 44.4 21% 45.8 21% 47.1 barley 17% 38.2 18% 41.7 19% 41.7 19% 40.8 18% 39.1 rye 1% 2.9 2% 4.1 2% 5.0 2% 3.4 2% 3.4 sorghum 3% 5.8 0% 0.4 0% 0.1 0% 1.0 0% 0.3 others 7% 15.8 7% 17.1 8% 17.5 8% 17.3 7% 16.5 peas 0% 1.1 0% 1.0 1% 1.2 1% 1.8 1% 1.5 wholeoilseeds 1% 1.6 1% 1.8 1% 1.4 0% 1.0 0% 1.0 cornglutenfeed 1% 2.9 1% 2.6 1% 2.6 1% 2.9 1% 2.7 meals 25% 55.4 23% 53.9 23% 51.4 24% 52.4 24% 53.0 ofwhichsoya 16% 37.2 15% 33.5 13% 30.0 15% 32.5 15% 32.2 rape 5% 10.3 5% 11.0 5% 12.2 5% 11.9 6% 12.4 sun 2% 3.9 2% 5.5 2% 5.3 2% 4.5 2% 5.1 corngerm 0% 0.3 0% 0.3 0% 0.3 0% 0.3 0% 0.3 groundnut 0% 0.1 0% 0.0 0% 0.1 0% 0.2 0% 0.1 cotton 0% 0.2 0% 0.2 0% 0.2 0% 0.2 0% 0.2 palmkernel 1% 2.5 1% 2.4 1% 2.2 1% 1.9 1% 1.9 lin 0% 0.2 0% 0.3 0% 0.3 0% 0.3 0% 0.3 fish 0% 0.8 0% 0.7 0% 0.7 0% 0.6 0% 0.6 tapioca 1% 1.4 0% 0.5 0% 0.0 0% 0.0 0% 0.0 brewingwastes 0% 0.5 0% 0.5 0% 0.5 0% 0.5 0% 0.5 citruspulpandDDGS 1% 1.8 1% 2.6 2% 3.5 2% 4.2 2% 4.8 total of the above materials 226.2 229.4 223.7 220.5 220.4 feedsat: 3.90 Mtforwheat(lastmonth:3.85Mt) 4.46 Mtforbarley(lastmonth:4.50Mt) 4.44 Mtformaize(lastmonth:4.46Mt). April-June 2011 Wheat usage rises at the expense of barley in poultryfeeds. Compared with last month, the wheat price hasrisenby2€/t,thebarleypriceby4€/tand themaizepriceby10€/t. Netherlands: barley usage re- vised down Estimateddemandforthecerealshasdecreased since last month to 6.6 Mt (wheat, barley and maize combined) from 6.7 Mt last month. Thereductionconcernsbarleyusageinthelast monthsofcropyear2010/11. We estimate grain usage in Dutch industrial feedsin2010/11at: 2.5 Mtforwheat(nochange) 1.8 Mtforbarley(lastmonth:1.9 Mt) 2.3 Mtformaize(nochange). April-June 2011 Demand for barley, and to a lesser extent de- mandformaize,isindeclinethroughthefinal quarterof2010/11,withdemandtransferring to imported substitution commodities (pulps andsoyahusks). Germany: wheat usage in ani- mal feeds revised up We have increased estimated wheat usage in German animal feeds to reflect statistics for grain usage in the industrial feed sector and consumption data to January 2011. It rises to from3.4Mtlastmonthto4.3Mt. Table2.4:tonnageofthemainrawmaterialsusedinindustrialfeeds andon-farm(EU27)
- 18. S t r a t é g i e g r a i n s 2 2 1 - 1 2 M a y 2 0 1 1 cereal consumption in the animal feed sector 18 Wheat Barley Maize Total 09/10 2010/11 2011/12 09/10 2010/11 2011/12 09/10 2010/11 2011/12 09/10 10/11 11/12 CO OF CO OF CO OF CO OF CO OF CO OF Germany 9.5 10.5 4.3 6.3 9.7 4.1 5.6 7.8 7.7 2.2 5.5 7.5 2.1 5.3 4.3 4.1 1.5 2.6 4.5 1.8 2.7 21.6 22.4 21.7 Belgium-Lux 1.9 1.6 1.4 0.2 1.7 1.5 0.2 0.9 0.9 0.6 0.3 0.8 0.5 0.3 1.1 1.1 0.7 0.4 1.1 0.5 0.6 3.8 3.5 3.6 Denmark 3.9 3.7 1.4 2.3 3.7 1.4 2.3 2.3 2.6 1.2 1.4 2.4 1.1 1.4 0.1 0.1 0.1 0.0 0.1 0.1 0.0 6.2 6.4 6.3 Spain 6.6 5.1 3.9 1.2 5.7 4.4 1.3 9.0 8.3 4.5 3.9 8.4 4.0 4.3 5.6 5.6 4.4 1.1 6.1 4.3 1.8 21.2 19.0 20.2 France 9.1 7.2 4.3 2.9 8.1 4.7 3.4 4.6 4.3 2.0 2.3 3.7 1.6 2.1 5.2 5.9 3.5 2.4 5.8 3.4 2.3 19.0 17.3 17.5 Greece 0.3 0.1 0.3 0.4 0.4 0.4 1.7 1.6 1.7 2.3 2.1 2.4 Ireland 0.7 0.5 0.2 0.3 0.7 0.4 0.3 1.2 1.2 0.9 0.3 1.1 0.8 0.3 0.4 0.4 0.4 0.0 0.4 0.4 0.0 2.3 2.1 2.2 Italy 2.2 2.1 1.5 0.6 1.9 1.4 0.4 1.7 1.7 1.6 0.2 1.7 1.5 0.2 9.6 9.4 7.6 1.7 9.6 7.6 2.0 13.4 13.2 13.1 TheNetherl. 3.0 2.5 2.9 1.8 1.8 1.4 2.0 2.3 2.3 6.8 6.6 6.5 Portugal 0.6 0.2 0.3 0.3 0.4 0.4 1.7 1.7 1.7 2.6 2.3 2.4 UnitedK. 6.5 6.4 4.4 2.0 6.4 4.3 2.1 3.5 3.2 0.9 2.2 3.0 0.8 2.2 0.5 0.5 0.2 0.2 0.5 0.2 0.2 10.6 10.1 9.9 Austria 0.3 0.2 0.1 0.1 0.2 0.1 0.1 0.6 0.6 0.2 0.5 0.6 0.1 0.4 1.8 1.7 0.3 1.3 1.8 0.3 1.4 2.7 2.6 2.6 Finland 0.5 0.4 0.2 0.2 0.3 0.1 0.2 1.0 1.3 0.3 1.1 1.4 0.3 1.1 0.0 0.0 0.0 0.0 0.0 0.0 0.0 1.5 1.7 1.6 Sweden 0.7 0.8 0.5 0.3 0.7 0.5 0.2 1.0 0.9 0.2 0.7 0.9 0.2 0.8 0.0 0.0 0.0 0.0 0.0 0.0 0.0 1.8 1.7 1.7 Poland 3.6 3.1 3.1 2.6 2.5 2.5 1.5 1.4 1.6 7.6 7.0 7.2 Hungary 1.5 1.2 1.2 0.3 0.4 0.5 2.4 2.4 2.3 4.2 4.0 4.0 CzechRep. 1.5 1.5 1.5 1.0 0.9 0.8 0.4 0.4 0.5 2.8 2.8 2.8 Slovakia 0.7 0.7 0.6 0.3 0.2 0.1 0.2 0.3 0.4 1.1 1.2 1.2 Estonia 0.1 0.2 0.2 0.2 0.1 0.2 0.0 0.0 0.0 0.4 0.3 0.4 Latvia 0.1 0.2 0.0 0.2 0.2 0.0 0.1 0.1 0.1 0.1 0.1 0.1 0.1 0.0 0.0 0.0 0.0 0.0 0.0 0.0 0.0 0.3 0.4 0.3 Lithuania 0.3 0.4 0.0 0.4 0.3 0.0 0.2 0.5 0.4 0.1 0.3 0.6 0.1 0.5 0.0 0.1 0.1 0.0 0.1 0.1 0.0 0.8 0.9 0.9 Slovenia 0.0 0.0 0.0 0.0 0.0 0.0 0.0 0.0 0.0 0.0 0.0 0.1 0.0 0.0 0.3 0.3 0.1 0.2 0.3 0.1 0.2 0.4 0.4 0.4 Cyprus/Malta 0.0 0.0 0.0 0.3 0.3 0.3 0.0 0.1 0.1 0.3 0.4 0.3 Romania 0.2 0.2 0.2 0.3 0.4 0.3 5.2 5.9 6.0 5.7 6.5 6.5 Bulgaria 0.5 0.5 0.5 0.1 0.1 0.1 0.5 0.6 0.5 1.1 1.2 1.2 EU27 54.4 49.4 50.4 41.7 40.8 39.1 44.4 45.8 47.1 140.5 135.9 136.7 CO=compound,OF=onfarm Table2.5:wheat,barleyandmaizeconsumptioninEUanimalfeeds–industrialandon-farm(Mt)
- 19. S t r a t é g i e g r a i n s 2 2 1 - 1 2 M a y 2 0 1 1 european union wheat balances European Union wheat balances Methodology : Wheat balances reflect current prices and their implications for domestic and foreign demand. The purpose of the balances is to bring to light a potentialsurplusordeficitastheresultofanimbalanceinsupplyanddemandbased on current prices. This information can then be used to predict price fluctuations aimedatreducinganyimbalanceinthecomingmonths.Thepricechangescanthus causesubstantialmodificationofthebalances. Thesurplusordeficitisthedifferencebetweenclosingstocksontheopenmarket andtheminimumlevelofstockrequiredbyusersineachcountryuntilthenexthar- vestcomesin(safeguardstock).Asurplusindicatesthosequantitieswhichwilleither besoldtointerventionorfindanoutletontheinternalorexportmarkets.Adeficit indicatesarequirementforimports. Somecountries,forexampleGreece,shownegativeopeningorclosingstocks(atthe end or beginning of the crop year) because, for the sake of coherence, output is in- cludedinthebalancefromJuly,althoughtheharvestactuallygetsunderwayinJune. InterventionclosingstockattheendofJune,onanygivendateofcalculation,is: •theopeninginterventionstockon1July plus •totalofwheatalreadyofferedintointerventionforthecropyear minus •quantitiesalreadysoldbyintervention •projectedsalesbyinterventionthroughtotheendofthecropyear 19 Crop year 2010/11 EU wheat production in 2010 is revised up by 0.4 Mt al- though wheat imports fall by 0.3 Mt. Internal demand is revised up by 0.4 Mt (increase in demand in animal feeds offset by a reduction in milling); wheat exports on the world market are revised down by 0.3 Mt this month to 19.1 Mt. EU wheat stock on June 30 2011 therefore re- mains at a similar level to last month at between 8.5 and 9 Mt, which is almost 2 Mt less than the minimum stock required (to comfortably supply the market from June 30 until the next harvest comes in). The situation remains particularly tight in France, UK, Central Europe (Hungary and Poland) and southeast Europe (Romania/Bulgaria). Germany’s balance has tightened since last month. After the upward price movements seen at the begin- ning of May, this low stock forecast should prevent old crop prices falling sharply even though the likelihood of Russia’s and Ukraine’s early return to the market has increased. Crop year 2011/12 EU wheat production in 2011 falls sharply this month to 131.5 Mt (-3.6 Mt) due to the impact of the drought in the west EU countries and to winterkill losses in Lithuania and Poland. Consequently, projected wheat usage in on- farm animal feeds falls sharply (-1.3 Mt) but demand for wheat in animal feeds is still forecast higher than in 2010/11 (with demand captured from other grains). Demand for human consumption and industrial usage is also set to be higher than in 2010/11 (mainly biofuels sector) although this forecast has not altered significant- ly since last month. Intra-EU wheat trade is forecast to rise in 2011/12 on ac- count of higher internal demand (Netherlands mainly). Import volumes are set to fall sharply compared with the levels of 2010/11 in Germany and France (assuming that grain quality is in line with the norm in Germany). UK wheat remains much more competitive than French wheat for export to the south EU export destinations; meanwhile south-east EU wheat is competitive against UK wheat (and much cheaper than French wheat) for the south EU. We estimate that wheat stocks on the world market on July 1 2011 will be 20 Mt less than at the start of 2010/11. Global production is forecast to increase by 28 Mt but our estimate has decreased sharply since last month due to the drought in the EU, delays to plantings in the northern USA and, to a smaller extent in the Black Sea countries. World demand is still forecast high (690 Mt) due to the projected rise in demand for feed wheat at the expense of maize. Global wheat stocks at the end of 2011/12 will therefore decline slightly. World wheat trade in 2011/12 is set to be higher than in 2010/11 due to re- duced production in the Middle East and higher animal sector demand in Asia. In this context, we still envisage that the world market will require the totality of the EU’s export availability despite the combined 14 Mt increase in the availabilities in the Black Sea countries (Russia, Ukraine, Kazakhstan). Since last month we have reduced our forecast for EU wheat availability and we now fore- cast exports at barely 17 Mt. With this level of exports, the outlook for EU wheat is not heavy and stocks will remain low at the end of 2011/12. Generally speaking, this situa- tion should support new crop EU wheat prices, which are much cheaper than US prices. The fact that the outlook on the world market is fairly tight with relatively low stock forecasts is a second support factor. Nevertheless, wheat prices in the EU could still be momentarily influ- enced downwards when Russia and Ukraine resume exports in the summer.
- 20. S t r a t é g i e g r a i n s 2 2 1 - 1 2 M a y 2 0 1 1 european union wheat balances 20 kt 2007/08 2008/09 2009/10 2010/11 2011/12 USA 1613 664 294 885 965 Canada 946 937 774 695 846 Argentina 11 2 1 6 6 TotalAmerica 2570 1603 1069 1586 1817 Norway Switzerland Turkey 23 4 12 20 Albania Croatia 173 30 160 104 BosniaHerzegovina Serbia-Montenegro 168 1 18 169 32 OtherEurope Europe 364 35 178 285 52 Ukraine 179 3724 1038 59 1148 Rep.Moldova 3 64 21 28 20 RussianFed. 1230 405 311 64 250 Kazakhstan 422 89 249 213 228 TotalCIS 1834 4282 1619 364 1646 Australia 6 205 199 27 216 Un.ArabEmirates China misc. 12 10 25 9 106 Totalothers 18 215 224 38 322 Total 4786 6135 3090 2273 3837 Table3.1:breakdownofEU27imports bycountryoforigin Crop year 2010/11 Production Wheat production in the EU27 is revised up by0.4Mtthismonthto126.4Mt.Theadjust- ment concerns Belgium, Latvia (+80 kt each) and Romania (+250 kt). Last month we re- ducedourharvestforecastforRomaniaby400 kt but this month the downward correction is lessened to tie in other items on the balance sheet. Imports Wheatimportsfromthirdcountriesarerevised downby300ktthismonthto2.27Mt.There- ductionreflectsthelowvolumesshippedfrom some exporting countries to the EU and also the low level of licence applications received from importers. The reduction concerns im- port volumes from the USA (-150 kt), Serbia (-70 kt) and Australia (-80 kt). We previously envisaged a small volume of Australian wheat imports in Spain and Portugal; this forecast has now been cancelled. US SRW wheat is currentlyslightlydearerthanUKwheattothe southEUcountries;SRWisevenlesscompeti- tive than last month. Also, Serbian wheat ex- portstotheEUhavebeenreducedbecausethe countryhasdecidedtoblockexportsinthelast monthsofthecropyear. May 3, EU export licence fixations totalled 1.924Mt.TheCommissionwillneedtoissue 350ktinMayandJune(comparedwith100kt issuedinApril). Demand for wheat for human con- sumption and industrial usage Demand for wheat for human consumption andindustrialusageisreviseddownagainthis month, falling 0.2 Mt to 58.1 Mt. The reduc- tion concerns milling wheat usage in France (-130 kt), Germany (-90 kt) and Austria (-10 kt) and reflects the inclusion of the latest of- ficial statistics in our forecasting (March for France, February for Austria and January for Germany).Also,demandforwheatinthebio- ethanolsectorhasdecreasedby15ktinAustria toreflectdatareleasedbyAgrarMarktAustria. Total EU27 demand for human consumption and industrial usage is now fore- cast 1 Mt up on the level of 2009/10, due to the growth inwheatusageinthebiofuels sector. Demand for milling andstarchisnowforecaststa- bleattheEUlevelcompared with2009/10. NB:Subscriberstothe“EU Biofuels”moduleonourweb- sitestrategie-grains.com,can consultthefulllistofbioetha- nolrefineriesandproduction capacities,andabreakdown ofbiofueloutputvolumesby countryandcropyear. Demand for wheat in animal feeds Demandforwheatinanimal feeds is revised up by 600 kt this month to 49.4 Mt; this reflects the impact of several changes: Wheat usage in indus- trial feeds is revised up in Germany to reflect the inclusion of official statistics for January (feed production re- vised up and wheat incorporations also re- visedup); Wheat usage in industrial feeds revised up in France (+70 kt) and Italy (+110 kt) to reflect the latest demand statistics and to reflectimportlevels; WheatusagereviseddowninPoland(-220 kt)duetoadjustmentsmadetosupplyand demanditemsforthelast5years; On-farm consumption estimated down 200ktinFrancetoreflectthelateststatistics for stocks held by stock keepers and wheat users dated March 31. On-farm wheat us- age in Germany is estimated down 200 kt forthesamereason. Total EU27 feed wheat usage in animal feeds is now forecast 5 Mt down on the level of 2009/10. Crop year 2011/12 Production EU soft wheat production in 2011 is cur- rentlyestimatedat131.5Mt.Sincelastmonth it has decreased by 3.6 Mt, with reductions for France (-1.5 Mt), Germany (-1.2 Mt) and Britain (-325 kt). The reductions in all three countries reflect the lack of rain in April and thebeginningofMay. Estimated production has also declined in Lithuania (-320 kt) to reflect the extent of winterkill this year on wheat area. In Poland, estimatedproductionfallsby(-290kt)because of the impact of the bad weather through the winter(cold). Despite this significant reduction, EU wheat production is still forecast slightly higher than the level of 2010 (+5.2 Mt). The countries registering the largest increases are Germany (+1.4 Mt), UK (+860 kt), Hungary (+570 kt),Poland(+410kt),andFrance(+370kt). Imports Little change this month: we estimate wheat imports in 2011/12 at 3.8 Mt. We maintain ourforecastforasharpincreasecomparedwith 2010/11 because of the better wheat harvest expectedintheBlackSeacountries.Although the exportable wheat surpluses in these coun- triesarestillforecastsignificantlylowerthanthe Supply and internal demand 2010/11: production revised up, imports revised down 2011/12: sharp fall in estimated production generates decline in projected wheat usage in animal feeds
- 21. S t r a t é g i e g r a i n s 2 2 1 - 1 2 M a y 2 0 1 1 european union wheat balances 21 July-June 2011/12 carry-instockimportsgrainsexportshum/ind.consump.animalfeed others (seeds, waste and overseas usage) intervention stock free stock requirement intervention free total production of which: ex-farm sales from EU 27 from non-EU supply to EU 27 to non-EU total flour exp. to non-EU biofuels internal consump. total compound feed on-farm feed demand free stock carry-out stock surplus/deficit Ger.0132513252462820547321521291904694373087491157777857968541125573103927897012931293-2201518 Bel/L0225225202230301355412365492981349103216001727152919860518202302300235 Den.04584585359292116120115613533670329374413952349289566004594590460 Spn.033334924360313719931733443154163012567044141256479966602652650269 Fra.0198719873600732541627638627690397221052358911818753806746843383106936283023442344-2402585 Gre.0-232-2324414742849684928509232774012490-281-2810-277 Irl.-065657793661012203739500395696371325191147-07373076 Ita.07777773273331510918456555497210547618571421436287769607607600758 Neth.02282281233516047666944350297396642300287349638902802800277 Por.08686641160129143943095015093534414135108888089 U.K.-0136113611574266962218394226021760651246635564274300212736016674-017201720-1201843 Aust.-066146513454993197360820929433958621212191601829-01441440147 Fin.41391438466501054357-0263102622551051505993441161200116 Swed.094942346174726212822151224042979472748024784253208989086 Pol.036736794853205101778136044676044613140134117991050953006476470643 Hun.016316341897904430106631612392012371224347419202382380239 Cz.R.-06956954320350505013225128002241056151110464651914308-07417410739 Slk.019919913325601588243142000420620120140401841840182 Est.-047473875804921142067106620831440-05252052 Lat.01241241137305215685454862178471621643812648146101081080108 Lit.-01881881844763211063062531136302266482181171949-01611610160 Sln.01212127129427231-0173220151323111825202020016 Cyp.00012103241390139001390013900000 Mal.0009300390360036003604400 Rom.019619657874615564991187854342440342023062763210178178-100279 Bul.0117117379121739351091498136311121250489336377801571570157 EU 15465536557991282264937391320731728113942467981135608439578425613907124489475807584-5808183 EU254834883521219712384137751579392204515454551461177636247608497265828148200497359738-58010322 EU27486618665131548243223837168372243221680659933118264745227750445679215829941007010074-68010757 Table3.2:EU27wheatbalanceJuly/June2011/12(kt)
- 22. S t r a t é g i e g r a i n s 2 2 1 - 1 2 M a y 2 0 1 1 european union wheat balances 22 July-June 2010/11 carry-instockimportsgrainsexportshum/ind.consump.animalfeed others (seeds, waste and overseas usage) demand intervention stock free stock requirement intervention free total production of which: ex-farm sales from EU 27 from non-EU supply to EU 27 to non-EU total flour exp. to non-EU biofuels internal consump. total compound feed on-farm feed free stock carry-out stock surplus/deficit Ger.02019201923243197903760312905343093048878411582478451054742636284103927727013251325-2601588 Bel/L021021020012892101520337252990349106415781551138117060497802252250227 Den.09949945056357126419140622833470327370414362268289596104584580456 Spn.04824824689337034988907103222152212986508438941190479885703333-210246 Fra.03271327135639329289155398316366129671025558911508516719243182874106337843019871987-4502434 Gre.0-282-2823615791758335192250917974010650-232-2320-236 Irl.-0717163929901008383830038350324825519944-06565062 Ita.09219213317356290187016285496210547520711475596287792307777770779 Neth.02432431362401067568350713239191092272249549545502282280232 Por.010710762106457129112094815093323114120508686081 U.K.-0186218621487861639617752220929771155769634264104376203436016392-013611361-4201778 Aust.-01313141411383966182955939939433959622713097601823-066-140150 Fin.271882157244009791375250102493851951895983641391430139 Swed.0929221842671225552501031219043478580549730884246109494089 Pol.14924939077355899328541134455604449309412941799105095650367367-270639 Hun.15432247636181140420810582601233201231115034540450163163-70232 Cz.R.93734828398536048481334611080571051151510654501914154-06956950697 Slk.3644648111857321742271246000460690120154301991990199 Est.-0909032487050215867106619931455-04747050 Lat.0999997332121395688752178471622433920448127101241240127 Lit.035835817081166218982134731436305402443581172001-01881880192 Sln.017171528082572812165220143242311824601212015 Cyp.010101394221390139001390013900000 Mal.03310210330330033003300000 Rom.0125125596646298665110951063342440342024762764550196196-80280 Bul.722322937922013405512945241283114126850033639380117117-40152 EU 15271019210218955702212521131300261630416715452471135490939203413013902123469465536557-14808026 EU2531012763130731166152342321621552722151617530534371177502047240486175821146920483488352-182010178 EU2731713111134271263732390522731659782390519117581441182503451928493646784157313486618665-194010610 Table3.3:EU27wheatbalanceJuly/June2010/11(kt)