SlideShare ist ein Scribd-Unternehmen logo
1 von 8
Downloaden Sie, um offline zu lesen
20.02.2013


                                                                                         Company Analysis - Overview
Ticker:                   NOBN SW            Nobel Biocare Holding AG                                      Benchmark:                                       Nobel Biocare Holding AG develops and produces dental implants and dental
                                             SIX Swiss Ex: NOBN, Currency: CHF                             SWISS MARKET INDEX (SMI)                         prosthetics. The Company manufactures permanent replacements for tooth roots, and
Currency:
                                                                                                                                                            dental crowns and bridges. Nobel Biocare sells under the brand names Branemark
                                                                                                                                                            System, Steri-Oss/Replace, and Procera on the global market.
Sector: Health Care      Industry: Health Care Equipment & Suppli                                             Year:
Telephone         41-43-211-4200                       Revenue (M)                                   700   Business Segments in CHF                                 Sales (M)   Geographic Segments in CHF                                 Sales (M)
Website           www.nobelbiocare.com                 No of Employees                             2'496   Dental Implants                                                700   EMEA                                                             277
Address           PO Box CH-8058 Zurich-Airport Glattbrugg, 8152 Switzerland                               Reconciliation                                                   0   Americas                                                         275
Share Price Performance in CHF                                                                                                                                                  Asia/Pacific                                                     147
Price                                9.13              1M Return                                  -3.9%                                                                         Reconciliation                                                     0
52 Week High                       11.68               6M Return                                  -1.6%                                                                         Rest of the World
52 Week Low                          7.09              52 Wk Return                              -21.1%                                                                         North America
52 Wk Beta                           1.27              YTD Return                                 17.7%
Credit Ratings
Bloomberg                  IG1                                                                                                            0%                                                                      0%
S&P                          -       Date                -                        Outlook              -                                                                                        21%
Moody's                      -       Date                -                        Outlook              -
Fitch                        -       Date                -                        Outlook              -
                                                                                                                                                                                                                                  40%
Valuation Ratios
                         12/09      12/10       12/11        12/12      12/13E        12/14E     12/15E
P/E                      27.2x      38.3x       28.1x        17.4x       18.8x         16.4x      12.7x
EV/EBIT                  20.3x      20.5x       15.5x        10.7x            -             -          -
EV/EBITDA                17.0x      15.2x       10.7x          7.3x        8.5x          7.9x       7.1x
P/S                        5.0x       3.0x        1.9x         1.4x        1.6x          1.5x       1.5x
P/B                        9.1x       5.4x        3.9x         2.4x        2.7x          2.5x       2.2x                                                                                         39%
Div Yield                 1.6%       2.5%        1.7%         2.5%        2.3%          2.7%       3.1%                                  100%
Profitability Ratios %
                       12/09        12/10       12/11        12/12      12/13E        12/14E     12/15E
Gross Margin            80.5         77.7        76.0         75.4        75.5          75.7       76.1
EBITDA Margin           29.1         19.9        18.4         17.4        17.7          18.5       19.4                                                                                            EMEA                Americas
Operating Margin        24.4         14.7        12.7         11.8        11.7          12.6       14.1
                                                                                                                            Dental Implants     Reconciliation
Profit Margin           18.2          7.9         7.0          7.9         8.7           9.5       11.1
Return on Assets        14.9          6.1         5.8          7.7         8.7           9.2       10.0
                                                                                                                                                                                                   Asia/Pacific        Reconciliation
Return on Equity        36.2         14.3        13.2         15.1        16.3          17.2       16.7
Leverage and Coverage Ratios
                       12/09        12/10       12/11        12/12
Current Ratio             3.2         1.0         1.5          2.2                                         Current Capitalization in CHF
Quick Ratio               2.9         0.9         1.3          1.9                                         Common Shares Outstanding (M)                                                                                  122.8
EBIT/Interest             8.8         4.8         5.0         13.5                                         Market Capitalization (M)                                                                                     1130.2
Tot Debt/Capital          0.4         0.4         0.3          0.2                                         Cash and ST Investments (M)                                                                                    187.0
Tot Debt/Equity           0.8         0.8         0.5          0.3                                         Total Debt (M)                                                                                                 120.1
Eff Tax Rate %          22.9         54.5        28.3         24.8                                         Preferred Equity (M)                                                                                             0.0
                                                                                                           LT Investments in Affiliate Companies (M)                                                                        0.0
                                                                                                           Investments (M)                                                                                                  0.0
                                                                                                           Enterprise Value (M)                                                                                          1063.2


                                                                                  Q.M.S Advisors | tel: +41 (0)78 922 08 77 | e-mail: info@qmsadv.com |
Company Analysis - Analysts Ratings
Nobel Biocare Holding AG
Target price in CHF
Broker Recommendation


                                                              Buy and Sell Recommendations vs Price and Target Price


                                                                                                                                                                         Price
                                                                                                                                                                                                                                                                                                                                              Brokers' Target Price
                                                                                                                                                                    16           30
                        100%
                                                                                                                                                                    14           25

                        80%                                    42%                            42%                                                                                20
                                  46%       46%       46%                46%       46%                    46%         50%         50%         50%      50%          12
                                                                                                                                                                                 15
                                                                                                                                                                    10
                        60%                                                                                                                                                      10
                                                                                                                                                                    8
                                                                                                                                                                                   5
                        40%                 33%       33%      42%                                                                                                  6              0
                                  38%                                    38%       38%        46%
                                                                                                          42%


                                                                                                                                                                                                                                                                                                                                                                                                                                 Bryan Garnier & Cie
                                                                                                                                                                                                                                                                                                                                                      Morgan Stanley
                                                                                                                                                                                                                                                                                                                                           Barclays
                                                                                                                                                                                                                                                        Kepler Capital Markets


                                                                                                                                                                                                                                                                                                  Main First Bank AG


                                                                                                                                                                                                                                                                                                                                                                                                                                                                                                                                                                                                       Equita SIM SpA
                                                                                                                                                                                                                                                                                 S&P Capital IQ


                                                                                                                                                                                                                                                                                                                                                                                                                                                                                               Commerzbank Corporates &


                                                                                                                                                                                                                                                                                                                                                                                                                                                                                                                                                                            CA Cheuvreux
                                                                                                                                                                                                                       Credit Suisse


                                                                                                                                                                                                                                                                                                                       Exane BNP Paribas


                                                                                                                                                                                                                                                                                                                                                                                  Sanford C. Bernstein & Co
                                                                                                                                                                                                                                                                                                                                                                       JPMorgan


                                                                                                                                                                                                                                                                                                                                                                                                                                                                Helvea
                                                                                                                                                                                                                                                                                                                                                                                                                                                       Nomura
                                                                                                                                                                                                                                                                                                                                                                                                              Bank Vontobel AG


                                                                                                                                                                                                                                                                                                                                                                                                                                                                                                                          HSBC

                                                                                                                                                                                                                                                                                                                                                                                                                                                                                                                                 EVA Dimensions
                                                                                                                                                                                                                                       Berenberg Bank
                                                                                                                                                                                                       Goldman Sachs


                                                                                                                                                                                                                                                                                                                                                                                                                                                                         Northcoast Research
                                                                                                                                                                                       Deutsche Bank


                                                                                                                                                                                                                                                                                                                                                                                                                                                                                                                                                    Zuercher Kantonalbank


                                                                                                                                                                                                                                                                                                                                                                                                                                                                                                                                                                                           Jefferies
                                                                                                                      42%         42%         42%      46%          4
                        20%
                                                                                                                                                                    2


                                                                                                                                                                                                                                                                                                                                                                                                                                                                                                      Markets
                                  17%       21%       21%      17%       17%       17%        13%         12%         8%           8%          8%       4%
                         0%                                                                                                                                         0
                                févr.12    mars.12   avr.12   mai.12    juin.12   juil.12   août.12      sept.12     oct.12      nov.12      déc.12   janv.13
                                                                       Buy        Hold            Sell       Price            Target Price

                               Date                     Buy             Hold                Sell                        Date              Price Target Price                     Broker                                                                                                           Analyst                                                                                                                             Recommendation                                                                             Target                                                                Date
                               31-Jan-13                 4%              46%                50%                      20-Feb-13               9.13            8.69                Deutsche Bank                                                                                                    YI-DAN WANG                                                                                                                                                  sell                                                                                5.90                                      20-Feb-13
                               31-Dec-12                 8%              42%                50%                      19-Feb-13               9.61            8.91                Goldman Sachs                                                                                                    VERONIKA DUBAJOVA                                                                                                                                       neutral/neutral                                                                          9.20                                      20-Feb-13
                               30-Nov-12                 8%              42%                50%                      18-Feb-13               9.93            8.91                Credit Suisse                                                                                                    CHRISTOPH GRETLER                                                                                                                                           neutral                                                                             10.80                                      20-Feb-13
                               31-Oct-12                 8%              42%                50%                      15-Feb-13               9.62            8.91                Berenberg Bank                                                                                                   TOM JONES                                                                                                                                                    buy                                                                                12.25                                      20-Feb-13
                               28-Sep-12                12%              42%                46%                      14-Feb-13               9.62            8.58                Kepler Capital Markets                                                                                           MAJA PATAKI                                                                                                                                                  hold                                                                                9.30                                      20-Feb-13
                               31-Aug-12                13%              46%                42%                      13-Feb-13               9.78            8.58                S&P Capital IQ                                                                                                   JACOB THRANE                                                                                                                                                 sell                                                                                8.60                                      20-Feb-13
                               31-Jul-12                17%              38%                46%                      12-Feb-13               9.44            8.42                Main First Bank AG                                                                                               STEPHAN VOLLERT                                                                                                                                          underperform                                                                            8.80                                      20-Feb-13
                               29-Jun-12                17%              38%                46%                      11-Feb-13               9.38            8.42                Exane BNP Paribas                                                                                                JULIEN DORMOIS                                                                                                                                           underperform                                                                            9.00                                      20-Feb-13
                               31-May-12                17%              42%                42%                       8-Feb-13               9.34            8.63                Barclays                                                                                                         ALEXANDER KLEBAN                                                                                                                                         underweight                                                                             6.60                                      20-Feb-13
                               30-Apr-12                21%              33%                46%                       7-Feb-13               9.15            8.63                Morgan Stanley                                                                                                   MICHAEL K JUNGLING                                                                                                                                     Underwt/Attractive                                                                        5.90                                      19-Feb-13
                               30-Mar-12                21%              33%                46%                       6-Feb-13               9.33            8.63                JPMorgan                                                                                                         DAVID J ADLINGTON                                                                                                                                        underweight                                                                             7.30                                      19-Feb-13
                               29-Feb-12                17%              38%                46%                       5-Feb-13               9.28            8.63                Sanford C. Bernstein & Co                                                                                        LISA BEDELL CLIVE                                                                                                                                       market perform                                                                           9.00                                      19-Feb-13
                                                                                                                      4-Feb-13               9.17            8.63                Bank Vontobel AG                                                                                                 CARLA BAENZIGER                                                                                                                                              hold                                                                                8.60                                      19-Feb-13
                                                                                                                      1-Feb-13               9.46            8.63                Bryan Garnier & Cie                                                                                              MATHIEU CHABERT                                                                                                                                              sell                                                                                8.90                                      19-Feb-13
                                                                                                                     31-Jan-13               9.54            8.63                Nomura                                                                                                           MARTIN BRUNNINGER                                                                                                                                           neutral                                                                             10.00                                      19-Feb-13
                                                                                                                     30-Jan-13               9.58            8.56                Helvea                                                                                                           SIMON GOETSCHMANN                                                                                                                                           neutral                                                                              9.70                                      19-Feb-13
                                                                                                                     29-Jan-13               9.58            8.52                Northcoast Research                                                                                              EDWIN SNYDER                                                                                                                                                 sell                                                                                6.50                                      19-Feb-13
                                                                                                                     28-Jan-13               9.69            8.52                Commerzbank Corporates & Markets                                                                                 OLIVER METZGER                                                                                                                                               hold                                                                                9.10                                      15-Feb-13
                                                                                                                     25-Jan-13               9.71            8.52                HSBC                                                                                                             HENDRIK LOFRUTHE                                                                                                                                            neutral                                                                              9.00                                      15-Feb-13
                                                                                                                     24-Jan-13               9.70            8.52                EVA Dimensions                                                                                                   ANDREW S ZAMFOTIS                                                                                                                                        underweight                                                                                                                        23-Jan-13
                                                                                                                     23-Jan-13               9.90            8.52                Zuercher Kantonalbank                                                                                            SIBYLLE BISCHOFBERGER FRICK                                                                                                                              underperform                                                                                                                       16-Jan-13
                                                                                                                     22-Jan-13               9.44            8.40                CA Cheuvreux                                                                                                     DANIEL JELOVCAN                                                                                                                                          underperform                                                                            7.25                                        8-Nov-12
                                                                                                                     21-Jan-13               9.42            8.40                Jefferies                                                                                                        INGEBORG OIE                                                                                                                                                 hold                                                                                9.00                                       15-Oct-12
                                                                                                                     18-Jan-13               9.50            8.40                Equita SIM SpA                                                                                                   FABIO FAZZARI                                                                                                                                              not rated                                                                            26.00                                      21-May-09
                                                                                                                     17-Jan-13               9.05            8.40
                                                                                                                     16-Jan-13               8.69            8.40
                                                                                                                     15-Jan-13               8.70            8.43
                                                                                                                     14-Jan-13               8.60            8.43
                                                                                                                     11-Jan-13               8.65            8.43
                                                                                                                     10-Jan-13               8.65            8.43

                                                                                                                Q.M.S Advisors | tel: +41 (0)78 922 08 77 | e-mail: info@qmsadv.com |
20.02.2013


Nobel Biocare Holding AG
                                                                              Company Analysis - Ownership
                                                                                     Ownership Type
Ownership Statistics                                                                                                                   Geographic Ownership Distribution                                            Geographic Ownership
                                                                                            0%
Shares Outstanding (M)                          122.8                                                                                  United States                              29.78%
                                                                                                                                                                                                                              5%      5%
Float                                           87.0%                                                                                  Britain                                    24.96%
                                                                                                                                                                                                                    6%
Short Interest (M)                                                                                                                     Switzerland                                10.66%                                                        30%
Short Interest as % of Float                                                                                                           Singapore                                  9.98%
Days to Cover Shorts                                                45%                                                                Canada                                     8.38%                      8%
Institutional Ownership                        54.70%                                                           55%                    Norway                                     5.69%
Retail Ownership                               45.07%                                                                                  Luxembourg                                 5.32%
Insider Ownership                               0.23%                                                                                  Others                                     5.23%
                                                                                                                                                                                                             10%                               25%
                                                                                                                                       Institutional Ownership Distribution
                                                                                                                                       Investment Advisor                         62.78%                                 11%
                                                                                                                                       Government                                 15.52%
                                                                                                                                       Mutual Fund Manager                        10.29%
                                                           Institutional Ownership      Retail Ownership   Insider Ownership           Other                                      5.74%
                                                                                                                                                                                                       United States     Britain        Switzerland    Singapore
Pricing data is in CHF                                                                                                                 Others                                     5.66%                Canada            Norway         Luxembourg     Others
Top 20 Owners:                 TOP 20 ALL

                                                                                                                                                                                                                    Institutional Ownership
Holder Name                                    Position   Position Change                        Market Value         % of Ownership   Report Date                   Source       Country
SILCHESTER INTL INVE                        12'605'473          6'383'119                         115'087'968             10.18%                       24.08.2012     EXCH        BRITAIN                                          6%
FRANKLIN RESOURCES                           7'387'481             72'834                          67'447'702              5.97%                       14.01.2013   ULT-AGG    UNITED STATES                        6%
GOVT OF SINGAPORE IN                         6'795'557                  0                          62'043'435              5.49%                       31.12.2011   ULT-AGG     SINGAPORE
INVESCO LTD                                  6'216'059          2'445'504                          56'752'619              5.02%                       11.04.2012     EXCH     UNITED STATES
                                                                                                                                                                                                             10%
TRIMARK INVESTMENT M                         5'030'544                  0                          45'928'867              4.06%                       30.09.2012   MF-AGG        CANADA
GOVERNANCE FOR OWNER                         3'909'643                  0                          35'695'041              3.16%                       31.12.2011    Co File      BRITAIN
NORGES BANK                                  3'768'834                  0                          34'409'454              3.04%                       05.02.2013     EXCH       NORWAY                                                          62%
CREDIT SUISSE ASSET                          2'500'726            -42'449                          22'831'628              2.02%                       28.12.2012   MF-AGG     SWITZERLAND                          16%
VANGUARD GROUP INC                           2'274'825             21'757                          20'769'152              1.84%                       31.12.2012   MF-AGG     UNITED STATES
NEW JERSEY DIVISION                          2'183'120                  0                          19'931'886              1.76%                       30.06.2012   MF-AGG     UNITED STATES
UNION INVESTMENT GMB                         2'000'000           -232'723                          18'260'000              1.62%                       28.09.2012   MF-AGG       GERMANY
CAPITAL GROUP COMPAN                         1'350'000                  0                          12'325'500              1.09%                       31.12.2012   ULT-AGG    UNITED STATES
SWISSCANTO FONDSLEIT                         1'325'169            -51'431                          12'098'793              1.07%                       30.11.2012   MF-AGG     SWITZERLAND
UNION INVESTMENT LUX                         1'323'847                  0                          12'086'723              1.07%                       28.09.2012   MF-AGG     LUXEMBOURG      Investment Advisor        Government             Mutual Fund Manager
                                                                                                                                                                                               Other                     Others
NOBEL BIOCARE HOLDIN                         1'303'120                  0                          11'897'486              1.05%                       31.12.2011    Co File   SWITZERLAND
PICTET & CIE                                   681'647              1'555                           6'223'437              0.55%                       31.10.2012   MF-AGG     SWITZERLAND
UBS FUND MANAGEMENT                            670'183              1'761                           6'118'771              0.54%                       31.10.2012   MF-AGG     SWITZERLAND
INVESCO CANADA LTD                             565'501                  0                           5'163'024              0.46%                       30.09.2012   MF-AGG        CANADA
SCHRODER INVESTMENT                            529'332           -192'242                           4'832'801              0.43%                       31.10.2012   MF-AGG        BRITAIN
FMR LLC                                        427'359            427'359                           3'901'788              0.35%                       30.04.2012   ULT-AGG    UNITED STATES
Top 5 Insiders:


Holder Name                                   Position    Position Change                        Market Value         % of Ownership   Report Date                  Source
LAUBE RICHARD T                               110'000                                               1'004'300              0.09%                       31.12.2011    Co File
BREU RAYMUND                                   70'000                                                 639'100              0.06%                       31.12.2011    Co File
WATTER ROLF URS                                53'500                                                 488'455              0.04%                       31.12.2011    Co File
LILJA ROBERT                                   18'375                                                 167'764              0.02%                       31.12.2011    Co File
FLURI EDGAR                                    16'500                                                 150'645              0.01%                       31.12.2011    Co File


                                                                               Q.M.S Advisors | tel: +41 (0)78 922 08 77 | e-mail: info@qmsadv.com |
Company Analysis - Financials I/IV
Nobel Biocare Holding AG
Financial information is in CHF (M)                                                                                                                                             Equivalent Estimates
Periodicity:             Fiscal Year                 12/02         12/03    12/04      12/05        12/06       12/07        12/08       12/09       12/10   12/11   12/12   12/13E      12/14E        12/15E
Income Statement
Revenue                                                456           508     600         750          945        1'094         982         878        796     702     700      705          731          770
  - Cost of Goods Sold                                 111           120     122         133          151          175         199         171        178     168     172

Gross Income                                           345           388     478         617          794         919          783         706        619     533     527      532          553          586
  - Selling, General & Admin Expenses                  242           255     291         364          452         548          572         493        501     444     444
          (Research & Dev Costs)                        19            21      22          26           28          37           52          38         44      36      42

Operating Income                                       103           133     190         270          342         371          211         214        117       89     83       83           92          109
  - Interest Expense                                     4             5       3           4            3           6           28          24         24       18      6
  - Foreign Exchange Losses (Gains)                      1             0      13          19           16           4          -97         -40        -44      -36     -0
  - Net Non-Operating Losses (Gains)                     9           -11      -5         -44            4          12           27          23         -2       39      4

Pretax Income                                            90          139     179         292          319         348          253         207        139      68      74       80           91          110
  - Income Tax Expense                                   34           28      37          52           70          75           79          47         76      19      18

Income Before XO Items                                   56          111     142         239          249         273          174         160         63      49      55
   - Extraordinary Loss Net of Tax                        0            0                                0           0            0           0          0       0       0
   - Minority Interests                                   1            1       1            0           0           0            0           0          0       0       0

Diluted EPS Before XO Items                                                 1.09        1.85         1.98        2.20        1.43         1.28       0.51    0.39    0.45

Net Income Adjusted*                                     55          109     147         201          249         273         184          160        109       49      59       61           70           85
EPS Adjusted                                          0.44          0.87    1.15        1.57         1.99        2.21        1.50         1.30       0.88    0.39    0.47     0.49         0.56         0.72
Dividends Per Share                                   0.15          0.26    0.53        0.70         0.85        0.95        0.59         0.55       0.48    0.18    0.19     0.21         0.24         0.29
        Payout Ratio %                                34.8          29.5    74.5        58.7         44.0        46.2        41.7         42.4       95.0    46.3    43.6     0.44         0.44         0.40

Total Shares Outstanding                               126           127     129         126          124         122          123         123        123     122     123
Diluted Shares Outstanding                             132           132     130         130          126         124          122         124        123     123     123

EBITDA                                                 135           163     221         290          366         399          256         256        158     129     121      125          135          149

*Net income excludes extraordinary gains and losses and one-time charges.


                                                                             Q.M.S Advisors | tel: +41 (0)78 922 08 77 | e-mail: info@qmsadv.com |
Company Analysis - Financials II/IV
Periodicity:                               12/02       12/03      12/04       12/05        12/06       12/07        12/08       12/09       12/10    12/11      12/12   12/13E   12/14E   12/15E
Balance Sheet
Total Current Assets                   206.207909   331.12563 463.403059 500.117142 492.379793 762.130423       629.90881 626.598869 532.918185 325.679126 365.411287
  + Cash & Near Cash Items                     76         171        301        201        213        312             246        358        299        131        177
  + Short Term Investments                      0           0                    54          0                         82          6         15          9         10
  + Accounts & Notes Receivable                77          92        110        163        200        253             211        203        166        133        116
  + Inventories                                41          35         27         47         49         59              55         30         29         29         25
  + Other Current Assets                       12          33         25         35         31        139              37         30         23         24         38

Total Long-Term Assets                       265         259        263         302          319         324          410         445        430      395         359
  + Long Term Investments                      1           1          1           3            4           3            0
         Gross Fixed Assets                  104         126        136         159          180         204          215         239        241      251         249
         Accumulated Depreciation             64          82         86          94          102         110          109         127        128      146         164
  + Net Fixed Assets                          40          44         49          66           78          94          106         112        113      105          86
  + Other Long Term Assets                   224         214        213         234          237         227          304         332        317      290         274

Total Current Liabilities                     78          97        120         201          185         270          213         198        519      212         163
  + Accounts Payable                          20          14         20          29           51          49           42          33         24       19          23
  + Short Term Borrowings                      2           0                      1            2           3           42           3        315       45           0
  + Other Short Term Liabilities              56          83        100         171          131         217          128         162        179      148         140

Total Long Term Liabilities                   81          48         56          45           46         373          429         402         45      166         170
  + Long Term Borrowings                      43           1          1           0            0         342          356         351          0      120         120
  + Other Long Term Borrowings                37          46         55          45           46          31           72          51         45       47          50

Total Liabilities                            159         144        176         246          231         643          641         600        563      378         333
  + Long Preferred Equity                      0           0          0           0            0           0            0           0          0        0           0
  + Minority Interest                          3           4          2           0            0           0            0           0          0        0           0
  + Share Capital & APIC                     135         175        188         205          247         365          322         294        228      174         169
  + Retained Earnings & Other Equity         174         267        361         352          334          78           77         177        171      169         223

Total Shareholders Equity                    312         446        551         557          581         444          399         471        399      342         392

Total Liabilities & Equity                   471         590        727         803          811        1'086       1'040        1'071       963      721         725

Book Value Per Share                         2.46       3.47        4.27        4.42        4.67         3.64        3.24         3.83       3.25     2.80       3.19     3.34     3.64     4.22
  Tangible Book Value Per Share                                     2.79        2.72        2.91         1.95        0.99         1.33       0.98     0.68       1.17


                                                                    Q.M.S Advisors | tel: +41 (0)78 922 08 77 | e-mail: info@qmsadv.com |
Company Analysis - Financials III/IV
Periodicity:                           12/02   12/03   12/04      12/05        12/06       12/07        12/08       12/09       12/10   12/11   12/12   12/13E   12/14E   12/15E
Cash Flows
Net Income                                55    109     141         239          249         273          174         160         63      49      55       61       71       86
  + Depreciation & Amortization           32     30      31          20           24          28           45          42         41      40      39
  + Other Non-Cash Adjustments            24      1      43         -37            7          -4          -12          17          5      -0       2
  + Changes in Non-Cash Capital          -11    -13     -10         -53          -27         -76           56          39         17      21      21

Cash From Operating Activities          100     128     205         170          254         222          263         258        126     110     117
  + Disposal of Fixed Assets              0       0
  + Capital Expenditures                -16     -19      -25         -30         -31          -41         -48          -28        -32     -21      -9      -30      -31      -36
  + Increase in Investments                                          -54
  + Decrease in Investments
  + Other Investing Activities            -4      5      -26         46           42         -120         -50          -43         2      -39      0

Cash From Investing Activities           -20     -14     -51         -39          11         -161         -98          -71        -30     -60      -9
  + Dividends Paid                       -12     -20     -33         -68         -88         -106        -117          -68        -64     -41     -18
  + Change in Short Term Borrowings                                                                        22          -38         -2    -284     -45
  + Increase in Long Term Borrowings       7       0                                         382            0                             118
  + Decrease in Long Term Borrowings     -33     -42                  -1           0                                   -18        -49
  + Increase in Capital Stocks             1      39     13           17          41          248          50            8          0              3
  + Decrease in Capital Stocks                                      -182        -214         -486         -26          -10         -7      -6
  + Other Financing Activities            -3      -4      -2          -0           0           -9        -130           55         24       0      -1

Cash From Financing Activities           -39     -27     -22        -234        -260          30         -201          -70        -98    -213     -61

Net Changes in Cash                      41      87     132         -103           5          91          -36         117          -2    -163     47

Free Cash Flow (CFO-CAPEX)               84     108     180         139          222         181          215         230         94      89     108       66       78       86

Free Cash Flow To Firm                    86    112     183         142         224          186         234          249        105     102     112
Free Cash Flow To Equity                  58      67                138         222          563         236          175          43     -77
Free Cash Flow per Share                0.67    0.86    1.41        1.09        1.78         1.46        1.76         1.87       0.76    0.73    0.88


                                                        Q.M.S Advisors | tel: +41 (0)78 922 08 77 | e-mail: info@qmsadv.com |
Company Analysis - Financials IV/IV
Periodicity:                         12/02   12/03   12/04      12/05        12/06       12/07        12/08       12/09       12/10   12/11   12/12   12/13E   12/14E   12/15E
Ratio Analysis

Valuation Ratios
  Price Earnings                     40.8x   28.1x   37.2x       30.7x       35.3x        27.1x       16.0x        27.2x      38.3x   28.1x   17.4x    18.8x    16.4x    12.7x
  EV to EBIT                         21.6x   22.2x   26.2x       25.9x       25.0x        19.8x       13.7x        20.3x      20.5x   15.5x   10.7x
  EV to EBITDA                       16.5x   18.0x   22.6x       24.1x       23.3x        18.4x       11.3x        17.0x      15.2x   10.7x    7.3x     8.5x     7.9x     7.1x
  Price to Sales                      4.9x    6.1x    8.8x        9.8x        9.3x         6.8x        2.8x         5.0x       3.0x    1.9x    1.4x     1.6x     1.5x     1.5x
  Price to Book                       7.3x    7.3x    9.7x       13.1x       15.4x        16.6x        6.6x         9.1x       5.4x    3.9x    2.4x     2.7x     2.5x     2.2x
  Dividend Yield                     0.9%    1.1%    1.3%        1.2%        1.2%         1.6%        2.6%         1.6%       2.5%    1.7%    2.5%     2.3%     2.7%     3.1%

Profitability Ratios
  Gross Margin                       75.6%   76.4%   79.7%      82.3%        84.0%       84.0%        79.7%       80.5%       77.7%   76.0%   75.4%   75.5%    75.7%    76.1%
  EBITDA Margin                      29.5%   32.1%   36.9%      38.7%        38.7%       36.5%        26.0%       29.1%       19.9%   18.4%   17.4%   17.7%    18.5%    19.4%
  Operating Margin                   22.6%   26.1%   31.8%      36.0%        36.2%       33.9%        21.5%       24.4%       14.7%   12.7%   11.8%   11.7%    12.6%    14.1%
  Profit Margin                      12.1%   21.6%   23.6%      31.9%        26.3%       25.0%        17.7%       18.2%        7.9%    7.0%    7.9%    8.7%     9.5%    11.1%
  Return on Assets                   11.5%   20.6%   21.6%      31.4%        31.0%       28.7%        16.2%       14.9%        6.1%    5.8%    7.7%    8.7%     9.2%    10.0%
  Return on Equity                   17.9%   29.1%   28.7%      43.4%        44.0%       52.9%        41.0%       36.2%       14.3%   13.2%   15.1%   16.3%    17.2%    16.7%

Leverage & Coverage Ratios
  Current Ratio                       2.64    3.42    3.86        2.49        2.67         2.83        2.96         3.16       1.03    1.54    2.24
  Quick Ratio                         1.96    2.72    3.42        2.08        2.23         2.09        2.54         2.86       0.93    1.29    1.86
  Interest Coverage Ratio (EBIT/I)   27.26   28.76   67.10       70.90      132.22        58.89        7.54         8.75       4.81    5.04   13.51
  Tot Debt/Capital                    0.13    0.00    0.00        0.00        0.00         0.44        0.50         0.43       0.44    0.32    0.23
  Tot Debt/Equity                     0.14    0.00    0.00        0.00        0.00         0.78        1.00         0.75       0.79    0.48    0.31

Others
  Asset Turnover                      0.95    0.95    0.92        0.98        1.18         1.15        0.92         0.82       0.77    0.83    0.97
  Accounts Receivable Turnover        5.80    5.97    5.97        5.51        5.24         4.81        4.21         4.18       4.28    4.70    5.65
  Accounts Payable Turnover           6.34    6.42    6.73        6.19        3.78         3.62        4.37         3.86       6.35    7.92    8.07
  Inventory Turnover                  2.93    3.14    3.94        3.60        3.16         3.24        3.49         3.98       5.86    5.77    6.44

  Effective Tax Rate                 37.4%   20.4%   20.7%      17.9%        22.0%       21.6%        31.2%       22.9%       54.5%   28.3%   24.8%


                                                      Q.M.S Advisors | tel: +41 (0)78 922 08 77 | e-mail: info@qmsadv.com |
Company Analysis - Peers Comparision
                                         NOBEL BIOCAR-     STRAUMANN                         SONOVA HOLDING                        SIRONA DENTAL       FRESENIUS                                                               TECAN GROUP AG-
                                                                            ZIMMER HLDGS                        DENTSPLY INTL                                           WILLIAM DEMANT SMITH & NEPHEW FRESENIUS SE & C                             CELESIO AG        GALENICA -REG
                                             REG             HLDG-R                                A                                    SY              MEDICA                                                                        R

Latest Fiscal Year:                            12/2012          12/2011           12/2012           03/2012           12/2012             09/2012           12/2011             12/2011               12/2012       12/2011            12/2011          12/2011            12/2011
52-Week High                                      11.68           160.70             76.75            115.30             43.51               73.98             60.27              596.50                738.00         96.93              90.00            15.57             626.00
52-Week High Date                            27.04.2012       29.05.2012        13.02.2013        15.02.2013        19.02.2013          08.02.2013        30.07.2012          19.07.2012            30.01.2013    16.10.2012         13.02.2013       22.10.2012         11.07.2012
52-Week Low                                         7.09           97.90             57.46             82.23             35.04               40.59             47.79              454.00                567.50         68.60              59.05            10.72             479.25
52-Week Low Date                             21.11.2012       16.11.2012        26.07.2012        22.05.2012        02.08.2012          04.06.2012        10.01.2013          16.11.2012            06.06.2012    26.04.2012         06.06.2012       05.06.2012         16.11.2012
Daily Volume                                  1'761'304           97'702           314'095            97'282           218'400             347'910           424'277              88'274               806'940       312'402             15'262          303'411              8'643
  Current Price (2/dd/yy)                          9.13          127.00             76.04            113.80              43.14              71.51              51.84              487.50               711.00         88.74              88.15            13.50              539.50
  52-Week High % Change                          -21.8%          -21.0%              -0.9%            -1.3%               -0.9%             -3.3%              -14.0%             -18.3%                 -3.7%         -8.4%             -2.1%            -13.3%             -13.8%
  52-Week Low % Change                            28.8%           29.7%             32.3%             38.4%              23.1%              76.2%                8.5%               7.4%                25.3%         29.4%              49.3%             25.9%              12.6%
Total Common Shares (M)                           122.8            15.5             173.5              66.5              141.7               55.1               304.1               57.6                902.5         163.2               11.4             170.1                6.4
  Market Capitalization                        1'130.2          1'990.9          13'193.1           7'600.9           6'122.8             4'063.6          15'865.5            28'445.6               6'432.9     15'815.0             1'008.8          2'296.4            3'506.8
Total Debt                                        99.5              1.8           1'820.9             257.8            1'766.7               75.5            7'211.4             2'312.0                468.0      10'208.0                4.4           2'067.0            1'165.2
Preferred Stock                                    -                -                 -                 -                  -                  -                    -                 -                    -             -                  -                 -                  -
Minority Interest                                  -                -                 -                 1.8               36.1                3.0              570.0                 4.0                  -         4'923.0                -                32.2               45.7
Cash and Equivalents                             154.9            378.0           1'555.9             198.7               77.1              151.1              457.3               288.0                178.0         635.0              165.1             448.3              345.3
   Enterprise Value                              860.3          1'874.1          13'458.1           7'648.6           7'754.6             4'018.3          22'364.4            30'530.6             10'127.5      31'578.0              875.8           4'142.0            4'422.8
                                                                                                                                                       Valuation
Total Revenue                      LFY           580.5            693.6           4'471.7           1'619.8            2'928.4              979.4           12'795.1             8'041.0              4'137.0      16'522.0              377.0         23'026.4             3'480.6
                                  LTM            580.5            688.0           4'471.7           1'729.3            2'928.4              993.6           13'417.2             8'399.0              4'137.0      18'533.0              377.3         22'560.6             3'545.8
                                 CY+1            570.8            694.9           4'612.8           1'839.0            2'996.3            1'086.7           13'734.6             8'673.0              4'408.4      19'233.0              393.0         22'542.0             3'441.6
                                 CY+2            591.7            699.3           4'798.8           1'988.6            3'172.3            1'181.4           14'706.6             9'384.5              4'599.3      20'953.4              425.3         22'562.5             3'558.3
EV/Total Revenue                   LFY              1.3x             3.0x             2.6x               3.9x              2.4x               3.6x               2.4x                 4.1x                 2.5x         1.9x                1.5x             0.2x                1.4x
                                  LTM               1.3x             3.0x             2.6x               3.7x              2.4x               3.5x               2.3x                 3.9x                 2.5x         1.7x                1.5x             0.2x                1.4x
                                 CY+1               1.5x             2.6x             2.9x               4.1x              2.4x               3.6x               2.2x                 3.5x                 2.2x         1.6x                2.2x             0.2x                1.2x
                                 CY+2               1.4x             2.5x             2.7x               3.7x              2.2x               3.1x               2.0x                 3.2x                 2.0x         1.4x                1.9x             0.2x                1.1x
EBITDA                             LFY           100.7            116.7           1'676.9             366.1              421.6              263.5            2'632.2             1'905.0              1'271.0       3'237.0               60.4            486.6               399.9
                                  LTM            100.7            128.5           1'676.9             416.9              488.9              266.7            2'817.0                     -            1'236.0       3'672.0               62.1            597.0               408.2
                                 CY+1            100.9            130.2           1'767.4             462.0              632.9              297.0            2'907.4             1'955.8              1'257.4       3'830.3               63.6            554.7               417.9
                                 CY+2            109.4            156.6           1'846.2             522.1              672.9              330.1            3'114.3             2'260.3              1'365.9       4'161.5               72.3            612.1               421.7
EV/EBITDA                          LFY              7.3x            17.7x             7.1x             17.4x              16.7x              13.3x              11.7x               17.2x                  8.1x         9.9x                9.6x             8.7x              12.1x
                                  LTM               7.3x            16.1x             7.1x             15.3x              14.4x              13.1x              11.0x                     -                8.3x         8.7x                9.3x             7.1x              11.8x
                                 CY+1               8.6x            14.0x             7.6x             16.2x              11.4x              13.0x              10.2x               15.5x                  7.7x         8.0x              13.4x              7.4x              10.1x
                                 CY+2               7.5x            11.3x             7.0x             14.0x              10.2x              11.1x               9.3x               13.2x                  6.8x         7.2x              11.1x              6.4x                9.6x
EPS                                LFY              0.37             4.54             5.30              3.71               1.99               2.33               3.51                     -               0.67          4.18               4.12             0.46               34.46
                                  LTM               0.37             4.91             5.32              4.40               1.94               2.42               4.08               21.23                 0.82          5.30               3.63             1.01               36.64
                                 CY+1              0.39             5.27             5.76              5.02               2.45               3.46               3.72               21.12                 0.78          5.41               4.06             1.20               37.80
                                 CY+2              0.45             6.75             6.26              5.73               2.72               3.84               4.00               25.90                 0.85          5.94               4.86             1.34               39.02
P/E                                LFY             20.0x            25.9x            14.3x             25.9x              22.2x              29.5x              17.0x               23.0x                13.3x         16.7x              24.3x            13.4x               14.7x
                                  LTM              20.0x            25.9x            14.3x             25.9x              22.2x              29.5x              17.1x                     -              16.0x         18.7x              24.4x            12.8x               14.8x
                                 CY+1              18.8x            24.1x            13.2x             22.7x              17.6x              20.7x              18.6x               23.1x                13.9x         16.4x              21.7x            11.3x               14.3x
                                 CY+2              16.4x            18.8x            12.1x             19.9x              15.9x              18.6x              17.3x               18.8x                12.8x         14.9x              18.1x            10.1x               13.8x
Revenue Growth                  1 Year             2.0%           (6.0%)             0.4%               0.2%             15.4%               7.2%               6.2%               16.7%                (3.1%)         3.4%                1.7%           (1.1%)                1.0%
                                5 Year           (3.2%)             0.9%             2.0%               8.4%              7.5%               6.8%               7.1%               10.0%                  2.3%        11.9%              (1.2%)             0.2%                7.4%
EBITDA Growth                   1 Year           (3.7%)          (44.7%)             3.7%             (2.0%)                   -             8.8%               8.5%               17.5%                  5.2%         5.9%              (6.8%)         (26.8%)               (9.9%)
                                5 Year          (16.1%)          (11.5%)             1.6%               3.7%              2.6%              11.9%              10.7%                 6.0%                 6.2%        11.9%              (0.9%)           (9.3%)              21.9%
EBITDA Margin                     LTM             17.4%            18.7%            37.5%             24.1%              16.8%              26.8%              21.0%                      -             29.9%         19.8%              16.4%              2.6%              11.5%
                                 CY+1             17.7%            18.7%            38.3%             25.1%              21.1%              27.3%              21.2%               22.6%                28.5%         19.9%              16.2%              2.5%              12.1%
                                 CY+2             18.5%            22.4%            38.5%             26.3%              21.2%              27.9%              21.2%               24.1%                29.7%         19.9%              17.0%              2.7%              11.9%
                                                                                                                                              Leverage/Coverage Ratios
Total Debt / Equity %                            30.6%             0.3%             31.0%             17.5%             95.6%                7.6%              91.3%              70.1%                12.0%         171.0%               1.6%            81.2%             100.7%      FALSE
Total Debt / Capital %                           23.4%             0.3%             23.7%             14.9%             48.4%                7.1%              46.0%              41.2%                10.8%          48.4%               1.6%            44.5%              49.2%      FALSE
Total Debt / EBITDA                              0.988x          0.011x             1.086x            0.604x            3.373x             0.283x              2.996x                  -               0.379x         3.072x            0.101x            3.317x             2.978x     FALSE
Net Debt / EBITDA                               -0.550x         -0.910x             0.158x            0.111x            3.258x            -0.183x              2.777x                  -               0.235x         2.808x           -2.143x            3.041x             2.189x     FALSE
EBITDA / Int. Expense                           19.811x        197.209x            23.003x           61.253x            9.623x            54.441x              7.386x            22.952x             105.917x         5.514x          597.723x            3.093x            10.010x     FALSE
                                                                                                                                                     Credit Ratings
S&P LT Credit Rating                                  -                -                A-                 -             BBB+                   -               BB+                      -                   -          BB+                   -                 -                  -    FALSE
S&P LT Credit Rating Date                              -                -       13.04.2007                  -       02.09.2011                   -        19.09.2012                      -                   -   19.09.2012                   -                 -                  -    FALSE
Moody's LT Credit Rating                              -                -             Baa1                  -             Baa2                   -                  -                     -                   -           WR                   -                 -                  -    FALSE
Moody's LT Credit Rating Date                          -                -       12.11.2009                  -       16.08.2011                   -                  -                     -                   -   30.04.2006                   -                 -                  -    FALSE


                                                                                                                            Q.M.S Advisors | tel: +41 (0)78 922 08 77 | e-mail: info@qmsadv.com |

Weitere ähnliche Inhalte

Was ist angesagt?

Financial Analysis - EDF SA (Electricite de France) produces, transmits, dist...
Financial Analysis - EDF SA (Electricite de France) produces, transmits, dist...Financial Analysis - EDF SA (Electricite de France) produces, transmits, dist...
Financial Analysis - EDF SA (Electricite de France) produces, transmits, dist...BCV
 
Financial Analysis - e.on se operates in power generation and gas producti…
Financial Analysis - e.on se operates in power generation and gas producti…Financial Analysis - e.on se operates in power generation and gas producti…
Financial Analysis - e.on se operates in power generation and gas producti…BCV
 
Financial analysis electricite de france sa - produces, transmits, distribu...
Financial analysis   electricite de france sa - produces, transmits, distribu...Financial analysis   electricite de france sa - produces, transmits, distribu...
Financial analysis electricite de france sa - produces, transmits, distribu...BCV
 
Thyssen-Krupp Company Profile, October 2007
Thyssen-Krupp Company Profile, October 2007Thyssen-Krupp Company Profile, October 2007
Thyssen-Krupp Company Profile, October 2007jasmo
 
terex Baird111208
terex Baird111208terex Baird111208
terex Baird111208finance42
 
SEB Facts And Figures January March 2008
SEB Facts And Figures January March 2008SEB Facts And Figures January March 2008
SEB Facts And Figures January March 2008SEBgroup
 
Seb Facts And Figures January March 2009
Seb Facts And Figures January March 2009Seb Facts And Figures January March 2009
Seb Facts And Figures January March 2009SEBgroup
 
SKF First-quarter result slide show
SKF First-quarter result slide showSKF First-quarter result slide show
SKF First-quarter result slide showSKF
 
Financial Analysis - Zhejiang Expressway Co., ltd., through its subsidiari…
Financial Analysis - Zhejiang Expressway Co., ltd., through its subsidiari…Financial Analysis - Zhejiang Expressway Co., ltd., through its subsidiari…
Financial Analysis - Zhejiang Expressway Co., ltd., through its subsidiari…BCV
 
SEB's first-quarter 2012 results presentation
SEB's first-quarter 2012 results presentationSEB's first-quarter 2012 results presentation
SEB's first-quarter 2012 results presentationSEBgroup
 
Presentation IR - July 2012
Presentation IR - July 2012Presentation IR - July 2012
Presentation IR - July 2012Embraer RI
 
Presentation 3 q strategy cee (eng for release)
Presentation 3 q strategy cee (eng for release)Presentation 3 q strategy cee (eng for release)
Presentation 3 q strategy cee (eng for release)bestbanking medien
 
Jmart JMT Oppday Q355
Jmart JMT Oppday Q355 Jmart JMT Oppday Q355
Jmart JMT Oppday Q355 Shaen PD
 
Softchoice Corp Investment Overview
Softchoice Corp Investment OverviewSoftchoice Corp Investment Overview
Softchoice Corp Investment OverviewAnkur Bansal
 
SNC : Opp day Nov 5, 2012
SNC : Opp day Nov 5, 2012SNC : Opp day Nov 5, 2012
SNC : Opp day Nov 5, 2012TonHor Hor
 
Lead or Be Led by Fear - Roger Brinner, Parthenon Group from Mass Technology ...
Lead or Be Led by Fear - Roger Brinner, Parthenon Group from Mass Technology ...Lead or Be Led by Fear - Roger Brinner, Parthenon Group from Mass Technology ...
Lead or Be Led by Fear - Roger Brinner, Parthenon Group from Mass Technology ...MassTLC
 
Leon cooperman-omega advisors vic 2011
Leon cooperman-omega advisors vic 2011Leon cooperman-omega advisors vic 2011
Leon cooperman-omega advisors vic 2011Frank Ragol
 
Financial Analysis - CSR Corp ltd. provides a wide range of rolling stock p…
Financial Analysis - CSR Corp ltd. provides a wide range of rolling stock p…Financial Analysis - CSR Corp ltd. provides a wide range of rolling stock p…
Financial Analysis - CSR Corp ltd. provides a wide range of rolling stock p…BCV
 
Presentation braskem day - nyse
Presentation   braskem day - nysePresentation   braskem day - nyse
Presentation braskem day - nyseBraskem_RI
 

Was ist angesagt? (20)

Financial Analysis - EDF SA (Electricite de France) produces, transmits, dist...
Financial Analysis - EDF SA (Electricite de France) produces, transmits, dist...Financial Analysis - EDF SA (Electricite de France) produces, transmits, dist...
Financial Analysis - EDF SA (Electricite de France) produces, transmits, dist...
 
Financial Analysis - e.on se operates in power generation and gas producti…
Financial Analysis - e.on se operates in power generation and gas producti…Financial Analysis - e.on se operates in power generation and gas producti…
Financial Analysis - e.on se operates in power generation and gas producti…
 
Financial analysis electricite de france sa - produces, transmits, distribu...
Financial analysis   electricite de france sa - produces, transmits, distribu...Financial analysis   electricite de france sa - produces, transmits, distribu...
Financial analysis electricite de france sa - produces, transmits, distribu...
 
Thyssen-Krupp Company Profile, October 2007
Thyssen-Krupp Company Profile, October 2007Thyssen-Krupp Company Profile, October 2007
Thyssen-Krupp Company Profile, October 2007
 
terex Baird111208
terex Baird111208terex Baird111208
terex Baird111208
 
SEB Facts And Figures January March 2008
SEB Facts And Figures January March 2008SEB Facts And Figures January March 2008
SEB Facts And Figures January March 2008
 
Seb Facts And Figures January March 2009
Seb Facts And Figures January March 2009Seb Facts And Figures January March 2009
Seb Facts And Figures January March 2009
 
SKF First-quarter result slide show
SKF First-quarter result slide showSKF First-quarter result slide show
SKF First-quarter result slide show
 
Financial Analysis - Zhejiang Expressway Co., ltd., through its subsidiari…
Financial Analysis - Zhejiang Expressway Co., ltd., through its subsidiari…Financial Analysis - Zhejiang Expressway Co., ltd., through its subsidiari…
Financial Analysis - Zhejiang Expressway Co., ltd., through its subsidiari…
 
Q1 2009 Earning Report of Banco Bilbao Vizcaya
Q1 2009 Earning Report of Banco Bilbao VizcayaQ1 2009 Earning Report of Banco Bilbao Vizcaya
Q1 2009 Earning Report of Banco Bilbao Vizcaya
 
SEB's first-quarter 2012 results presentation
SEB's first-quarter 2012 results presentationSEB's first-quarter 2012 results presentation
SEB's first-quarter 2012 results presentation
 
Presentation IR - July 2012
Presentation IR - July 2012Presentation IR - July 2012
Presentation IR - July 2012
 
Presentation 3 q strategy cee (eng for release)
Presentation 3 q strategy cee (eng for release)Presentation 3 q strategy cee (eng for release)
Presentation 3 q strategy cee (eng for release)
 
Jmart JMT Oppday Q355
Jmart JMT Oppday Q355 Jmart JMT Oppday Q355
Jmart JMT Oppday Q355
 
Softchoice Corp Investment Overview
Softchoice Corp Investment OverviewSoftchoice Corp Investment Overview
Softchoice Corp Investment Overview
 
SNC : Opp day Nov 5, 2012
SNC : Opp day Nov 5, 2012SNC : Opp day Nov 5, 2012
SNC : Opp day Nov 5, 2012
 
Lead or Be Led by Fear - Roger Brinner, Parthenon Group from Mass Technology ...
Lead or Be Led by Fear - Roger Brinner, Parthenon Group from Mass Technology ...Lead or Be Led by Fear - Roger Brinner, Parthenon Group from Mass Technology ...
Lead or Be Led by Fear - Roger Brinner, Parthenon Group from Mass Technology ...
 
Leon cooperman-omega advisors vic 2011
Leon cooperman-omega advisors vic 2011Leon cooperman-omega advisors vic 2011
Leon cooperman-omega advisors vic 2011
 
Financial Analysis - CSR Corp ltd. provides a wide range of rolling stock p…
Financial Analysis - CSR Corp ltd. provides a wide range of rolling stock p…Financial Analysis - CSR Corp ltd. provides a wide range of rolling stock p…
Financial Analysis - CSR Corp ltd. provides a wide range of rolling stock p…
 
Presentation braskem day - nyse
Presentation   braskem day - nysePresentation   braskem day - nyse
Presentation braskem day - nyse
 

Andere mochten auch

Safeguarding Abila: Discovering Evolving Activist Networks
Safeguarding Abila: Discovering Evolving Activist NetworksSafeguarding Abila: Discovering Evolving Activist Networks
Safeguarding Abila: Discovering Evolving Activist NetworksParang Saraf
 
1 s2.0-s037838121100207 x-main.correlation of thermodynamic modeling and mole...
1 s2.0-s037838121100207 x-main.correlation of thermodynamic modeling and mole...1 s2.0-s037838121100207 x-main.correlation of thermodynamic modeling and mole...
1 s2.0-s037838121100207 x-main.correlation of thermodynamic modeling and mole...Josemar Pereira da Silva
 
VIII Encuentro Nacional Urantiano de Venezuela (invitación)
VIII Encuentro Nacional Urantiano de Venezuela (invitación)VIII Encuentro Nacional Urantiano de Venezuela (invitación)
VIII Encuentro Nacional Urantiano de Venezuela (invitación)Estudiantes Urantia
 
NetSquared Camp Cameroon - N Computing Presentation
NetSquared Camp Cameroon - N Computing PresentationNetSquared Camp Cameroon - N Computing Presentation
NetSquared Camp Cameroon - N Computing PresentationNetSquared
 
Cover Proposal Karya Tulis Ilmiah Es Krim Biji Durian
Cover Proposal Karya Tulis Ilmiah Es Krim Biji DurianCover Proposal Karya Tulis Ilmiah Es Krim Biji Durian
Cover Proposal Karya Tulis Ilmiah Es Krim Biji Duriandwinitatanisia
 
How to Impress the Press & Generate Media Coverage for Your Startup
How to Impress the Press & Generate Media Coverage for Your StartupHow to Impress the Press & Generate Media Coverage for Your Startup
How to Impress the Press & Generate Media Coverage for Your StartupGrowth Hacking Asia
 
Kosten Fundament Thermoplatte Deutschland
Kosten Fundament Thermoplatte DeutschlandKosten Fundament Thermoplatte Deutschland
Kosten Fundament Thermoplatte DeutschlandFloortech Fundament
 
Social Media Guidelines
Social Media GuidelinesSocial Media Guidelines
Social Media GuidelinesMySign AG
 
Directorio zonasfrancas2014 2015_esp
Directorio zonasfrancas2014 2015_espDirectorio zonasfrancas2014 2015_esp
Directorio zonasfrancas2014 2015_espProColombia
 
Equivalencia de filtros
Equivalencia de filtrosEquivalencia de filtros
Equivalencia de filtrosMACHIAVELO1821
 
PROCESO DE ELABORACION DE UNA INVESTIGACION DOCUMENTAL
PROCESO DE ELABORACION DE UNA INVESTIGACION DOCUMENTALPROCESO DE ELABORACION DE UNA INVESTIGACION DOCUMENTAL
PROCESO DE ELABORACION DE UNA INVESTIGACION DOCUMENTALmiriam gutierrez
 
Negotiating contracts as user experiences - WIAD Rome 2016
Negotiating contracts as user experiences - WIAD Rome 2016Negotiating contracts as user experiences - WIAD Rome 2016
Negotiating contracts as user experiences - WIAD Rome 2016Jacopo Romei
 
Porcentajes de nutrientes en la dieta
Porcentajes de nutrientes en la  dietaPorcentajes de nutrientes en la  dieta
Porcentajes de nutrientes en la dietaOmar Rubalcava
 
Veröffentlichung
VeröffentlichungVeröffentlichung
Veröffentlichungdawede112
 
Wordpress para ecommerce
Wordpress para ecommerceWordpress para ecommerce
Wordpress para ecommerceSantiago Murphy
 

Andere mochten auch (20)

Safeguarding Abila: Discovering Evolving Activist Networks
Safeguarding Abila: Discovering Evolving Activist NetworksSafeguarding Abila: Discovering Evolving Activist Networks
Safeguarding Abila: Discovering Evolving Activist Networks
 
1 s2.0-s037838121100207 x-main.correlation of thermodynamic modeling and mole...
1 s2.0-s037838121100207 x-main.correlation of thermodynamic modeling and mole...1 s2.0-s037838121100207 x-main.correlation of thermodynamic modeling and mole...
1 s2.0-s037838121100207 x-main.correlation of thermodynamic modeling and mole...
 
VIII Encuentro Nacional Urantiano de Venezuela (invitación)
VIII Encuentro Nacional Urantiano de Venezuela (invitación)VIII Encuentro Nacional Urantiano de Venezuela (invitación)
VIII Encuentro Nacional Urantiano de Venezuela (invitación)
 
Historia del computador-codigo 7
Historia del computador-codigo 7Historia del computador-codigo 7
Historia del computador-codigo 7
 
20. Amiel
20. Amiel20. Amiel
20. Amiel
 
NetSquared Camp Cameroon - N Computing Presentation
NetSquared Camp Cameroon - N Computing PresentationNetSquared Camp Cameroon - N Computing Presentation
NetSquared Camp Cameroon - N Computing Presentation
 
Cover Proposal Karya Tulis Ilmiah Es Krim Biji Durian
Cover Proposal Karya Tulis Ilmiah Es Krim Biji DurianCover Proposal Karya Tulis Ilmiah Es Krim Biji Durian
Cover Proposal Karya Tulis Ilmiah Es Krim Biji Durian
 
How to Impress the Press & Generate Media Coverage for Your Startup
How to Impress the Press & Generate Media Coverage for Your StartupHow to Impress the Press & Generate Media Coverage for Your Startup
How to Impress the Press & Generate Media Coverage for Your Startup
 
Kosten Fundament Thermoplatte Deutschland
Kosten Fundament Thermoplatte DeutschlandKosten Fundament Thermoplatte Deutschland
Kosten Fundament Thermoplatte Deutschland
 
Brochure Gabha Ayurved Bhavan
Brochure Gabha Ayurved BhavanBrochure Gabha Ayurved Bhavan
Brochure Gabha Ayurved Bhavan
 
Social Media Guidelines
Social Media GuidelinesSocial Media Guidelines
Social Media Guidelines
 
Directorio zonasfrancas2014 2015_esp
Directorio zonasfrancas2014 2015_espDirectorio zonasfrancas2014 2015_esp
Directorio zonasfrancas2014 2015_esp
 
Equivalencia de filtros
Equivalencia de filtrosEquivalencia de filtros
Equivalencia de filtros
 
B2 teste
B2 testeB2 teste
B2 teste
 
PROCESO DE ELABORACION DE UNA INVESTIGACION DOCUMENTAL
PROCESO DE ELABORACION DE UNA INVESTIGACION DOCUMENTALPROCESO DE ELABORACION DE UNA INVESTIGACION DOCUMENTAL
PROCESO DE ELABORACION DE UNA INVESTIGACION DOCUMENTAL
 
Negotiating contracts as user experiences - WIAD Rome 2016
Negotiating contracts as user experiences - WIAD Rome 2016Negotiating contracts as user experiences - WIAD Rome 2016
Negotiating contracts as user experiences - WIAD Rome 2016
 
Porcentajes de nutrientes en la dieta
Porcentajes de nutrientes en la  dietaPorcentajes de nutrientes en la  dieta
Porcentajes de nutrientes en la dieta
 
Windows xp tips
Windows xp tipsWindows xp tips
Windows xp tips
 
Veröffentlichung
VeröffentlichungVeröffentlichung
Veröffentlichung
 
Wordpress para ecommerce
Wordpress para ecommerceWordpress para ecommerce
Wordpress para ecommerce
 

Ähnlich wie Financial analysis nobel biocare holding ag develops and produces dental implants and dental prosthetics. the company manufactures permanent replacements for tooth roots, and dental crowns and bridges

Financial Analysis - Herbalife Ltd. is a network marketing company that sell...
 Financial Analysis - Herbalife Ltd. is a network marketing company that sell... Financial Analysis - Herbalife Ltd. is a network marketing company that sell...
Financial Analysis - Herbalife Ltd. is a network marketing company that sell...BCV
 
Financial Analysis - American International Group, Inc. is an internationa…
Financial Analysis - American International Group, Inc. is an internationa…Financial Analysis - American International Group, Inc. is an internationa…
Financial Analysis - American International Group, Inc. is an internationa…BCV
 
Financial Analysis - Facebook Inc. operates a social networking website. The ...
Financial Analysis - Facebook Inc. operates a social networking website. The ...Financial Analysis - Facebook Inc. operates a social networking website. The ...
Financial Analysis - Facebook Inc. operates a social networking website. The ...BCV
 
Financial Analysis - Commerzbank AG attracts deposits and offers retail an…
Financial Analysis - Commerzbank AG attracts deposits and offers retail an…Financial Analysis - Commerzbank AG attracts deposits and offers retail an…
Financial Analysis - Commerzbank AG attracts deposits and offers retail an…BCV
 
Financial analysis total sa - total sa explores for, produces, refines, tra...
Financial analysis   total sa - total sa explores for, produces, refines, tra...Financial analysis   total sa - total sa explores for, produces, refines, tra...
Financial analysis total sa - total sa explores for, produces, refines, tra...BCV
 
Financial analysis - MBIA Inc. provides financial guarantee insurance and …
Financial analysis - MBIA Inc. provides financial guarantee insurance and …Financial analysis - MBIA Inc. provides financial guarantee insurance and …
Financial analysis - MBIA Inc. provides financial guarantee insurance and …BCV
 
Financial analysis paladin energy ltd - paladin energy limited primarily ex...
Financial analysis   paladin energy ltd - paladin energy limited primarily ex...Financial analysis   paladin energy ltd - paladin energy limited primarily ex...
Financial analysis paladin energy ltd - paladin energy limited primarily ex...BCV
 
Financial Analysis - PetroChina Company Limited explores, develops, and produ...
Financial Analysis - PetroChina Company Limited explores, develops, and produ...Financial Analysis - PetroChina Company Limited explores, develops, and produ...
Financial Analysis - PetroChina Company Limited explores, develops, and produ...BCV
 
Financial analysis goldcorp, inc. is engaged in the acquisition, exploratio...
Financial analysis   goldcorp, inc. is engaged in the acquisition, exploratio...Financial analysis   goldcorp, inc. is engaged in the acquisition, exploratio...
Financial analysis goldcorp, inc. is engaged in the acquisition, exploratio...BCV
 
Financial Analysis - EFG Financial Products Holding AG provides financial ser...
Financial Analysis - EFG Financial Products Holding AG provides financial ser...Financial Analysis - EFG Financial Products Holding AG provides financial ser...
Financial Analysis - EFG Financial Products Holding AG provides financial ser...BCV
 
Financial analysis cresud sacif y a is an argentine agricultural company, w...
Financial analysis   cresud sacif y a is an argentine agricultural company, w...Financial analysis   cresud sacif y a is an argentine agricultural company, w...
Financial analysis cresud sacif y a is an argentine agricultural company, w...BCV
 
Financial Analysis - Assured Guaranty Ltd. provides financial guaranty insura...
Financial Analysis - Assured Guaranty Ltd. provides financial guaranty insura...Financial Analysis - Assured Guaranty Ltd. provides financial guaranty insura...
Financial Analysis - Assured Guaranty Ltd. provides financial guaranty insura...BCV
 
Financial Analysis - J.C. Penney Company, Inc., through a subsidiary, operat...
 Financial Analysis - J.C. Penney Company, Inc., through a subsidiary, operat... Financial Analysis - J.C. Penney Company, Inc., through a subsidiary, operat...
Financial Analysis - J.C. Penney Company, Inc., through a subsidiary, operat...BCV
 
Financial Analysis - Two Harbors Investment Corporation is a re…
Financial Analysis - Two Harbors Investment Corporation is a re…Financial Analysis - Two Harbors Investment Corporation is a re…
Financial Analysis - Two Harbors Investment Corporation is a re…BCV
 
Fundamental Analysis & Financial Analyst Recommandations - Google Inc - US382...
Fundamental Analysis & Financial Analyst Recommandations - Google Inc - US382...Fundamental Analysis & Financial Analyst Recommandations - Google Inc - US382...
Fundamental Analysis & Financial Analyst Recommandations - Google Inc - US382...BCV
 
Financial analysis sony corp - sony corporation manufactures audio, home vi...
Financial analysis   sony corp - sony corporation manufactures audio, home vi...Financial analysis   sony corp - sony corporation manufactures audio, home vi...
Financial analysis sony corp - sony corporation manufactures audio, home vi...BCV
 
Financial Analysis - Veolia environnement operates utility and public tran…
Financial Analysis - Veolia environnement operates utility and public tran…Financial Analysis - Veolia environnement operates utility and public tran…
Financial Analysis - Veolia environnement operates utility and public tran…BCV
 
Financial Analysis - Osisko Mining Corporation is a gold exploration compa…
Financial Analysis - Osisko Mining Corporation is a gold exploration compa…Financial Analysis - Osisko Mining Corporation is a gold exploration compa…
Financial Analysis - Osisko Mining Corporation is a gold exploration compa…BCV
 
Financial Analysis - OGX Petroleo e Gas Participacoes SA is an oil and gas…
Financial Analysis - OGX Petroleo e Gas Participacoes SA is an oil and gas…Financial Analysis - OGX Petroleo e Gas Participacoes SA is an oil and gas…
Financial Analysis - OGX Petroleo e Gas Participacoes SA is an oil and gas…BCV
 
Financial analysis kinross gold corp - kinross gold corporation is involved...
Financial analysis   kinross gold corp - kinross gold corporation is involved...Financial analysis   kinross gold corp - kinross gold corporation is involved...
Financial analysis kinross gold corp - kinross gold corporation is involved...BCV
 

Ähnlich wie Financial analysis nobel biocare holding ag develops and produces dental implants and dental prosthetics. the company manufactures permanent replacements for tooth roots, and dental crowns and bridges (20)

Financial Analysis - Herbalife Ltd. is a network marketing company that sell...
 Financial Analysis - Herbalife Ltd. is a network marketing company that sell... Financial Analysis - Herbalife Ltd. is a network marketing company that sell...
Financial Analysis - Herbalife Ltd. is a network marketing company that sell...
 
Financial Analysis - American International Group, Inc. is an internationa…
Financial Analysis - American International Group, Inc. is an internationa…Financial Analysis - American International Group, Inc. is an internationa…
Financial Analysis - American International Group, Inc. is an internationa…
 
Financial Analysis - Facebook Inc. operates a social networking website. The ...
Financial Analysis - Facebook Inc. operates a social networking website. The ...Financial Analysis - Facebook Inc. operates a social networking website. The ...
Financial Analysis - Facebook Inc. operates a social networking website. The ...
 
Financial Analysis - Commerzbank AG attracts deposits and offers retail an…
Financial Analysis - Commerzbank AG attracts deposits and offers retail an…Financial Analysis - Commerzbank AG attracts deposits and offers retail an…
Financial Analysis - Commerzbank AG attracts deposits and offers retail an…
 
Financial analysis total sa - total sa explores for, produces, refines, tra...
Financial analysis   total sa - total sa explores for, produces, refines, tra...Financial analysis   total sa - total sa explores for, produces, refines, tra...
Financial analysis total sa - total sa explores for, produces, refines, tra...
 
Financial analysis - MBIA Inc. provides financial guarantee insurance and …
Financial analysis - MBIA Inc. provides financial guarantee insurance and …Financial analysis - MBIA Inc. provides financial guarantee insurance and …
Financial analysis - MBIA Inc. provides financial guarantee insurance and …
 
Financial analysis paladin energy ltd - paladin energy limited primarily ex...
Financial analysis   paladin energy ltd - paladin energy limited primarily ex...Financial analysis   paladin energy ltd - paladin energy limited primarily ex...
Financial analysis paladin energy ltd - paladin energy limited primarily ex...
 
Financial Analysis - PetroChina Company Limited explores, develops, and produ...
Financial Analysis - PetroChina Company Limited explores, develops, and produ...Financial Analysis - PetroChina Company Limited explores, develops, and produ...
Financial Analysis - PetroChina Company Limited explores, develops, and produ...
 
Financial analysis goldcorp, inc. is engaged in the acquisition, exploratio...
Financial analysis   goldcorp, inc. is engaged in the acquisition, exploratio...Financial analysis   goldcorp, inc. is engaged in the acquisition, exploratio...
Financial analysis goldcorp, inc. is engaged in the acquisition, exploratio...
 
Financial Analysis - EFG Financial Products Holding AG provides financial ser...
Financial Analysis - EFG Financial Products Holding AG provides financial ser...Financial Analysis - EFG Financial Products Holding AG provides financial ser...
Financial Analysis - EFG Financial Products Holding AG provides financial ser...
 
Financial analysis cresud sacif y a is an argentine agricultural company, w...
Financial analysis   cresud sacif y a is an argentine agricultural company, w...Financial analysis   cresud sacif y a is an argentine agricultural company, w...
Financial analysis cresud sacif y a is an argentine agricultural company, w...
 
Financial Analysis - Assured Guaranty Ltd. provides financial guaranty insura...
Financial Analysis - Assured Guaranty Ltd. provides financial guaranty insura...Financial Analysis - Assured Guaranty Ltd. provides financial guaranty insura...
Financial Analysis - Assured Guaranty Ltd. provides financial guaranty insura...
 
Financial Analysis - J.C. Penney Company, Inc., through a subsidiary, operat...
 Financial Analysis - J.C. Penney Company, Inc., through a subsidiary, operat... Financial Analysis - J.C. Penney Company, Inc., through a subsidiary, operat...
Financial Analysis - J.C. Penney Company, Inc., through a subsidiary, operat...
 
Financial Analysis - Two Harbors Investment Corporation is a re…
Financial Analysis - Two Harbors Investment Corporation is a re…Financial Analysis - Two Harbors Investment Corporation is a re…
Financial Analysis - Two Harbors Investment Corporation is a re…
 
Fundamental Analysis & Financial Analyst Recommandations - Google Inc - US382...
Fundamental Analysis & Financial Analyst Recommandations - Google Inc - US382...Fundamental Analysis & Financial Analyst Recommandations - Google Inc - US382...
Fundamental Analysis & Financial Analyst Recommandations - Google Inc - US382...
 
Financial analysis sony corp - sony corporation manufactures audio, home vi...
Financial analysis   sony corp - sony corporation manufactures audio, home vi...Financial analysis   sony corp - sony corporation manufactures audio, home vi...
Financial analysis sony corp - sony corporation manufactures audio, home vi...
 
Financial Analysis - Veolia environnement operates utility and public tran…
Financial Analysis - Veolia environnement operates utility and public tran…Financial Analysis - Veolia environnement operates utility and public tran…
Financial Analysis - Veolia environnement operates utility and public tran…
 
Financial Analysis - Osisko Mining Corporation is a gold exploration compa…
Financial Analysis - Osisko Mining Corporation is a gold exploration compa…Financial Analysis - Osisko Mining Corporation is a gold exploration compa…
Financial Analysis - Osisko Mining Corporation is a gold exploration compa…
 
Financial Analysis - OGX Petroleo e Gas Participacoes SA is an oil and gas…
Financial Analysis - OGX Petroleo e Gas Participacoes SA is an oil and gas…Financial Analysis - OGX Petroleo e Gas Participacoes SA is an oil and gas…
Financial Analysis - OGX Petroleo e Gas Participacoes SA is an oil and gas…
 
Financial analysis kinross gold corp - kinross gold corporation is involved...
Financial analysis   kinross gold corp - kinross gold corporation is involved...Financial analysis   kinross gold corp - kinross gold corporation is involved...
Financial analysis kinross gold corp - kinross gold corporation is involved...
 

Mehr von BCV

Vers la couverture des risques systémiques
Vers la couverture des risques systémiquesVers la couverture des risques systémiques
Vers la couverture des risques systémiquesBCV
 
Le plus convexe des investissements linéaires
Le plus convexe des investissements linéairesLe plus convexe des investissements linéaires
Le plus convexe des investissements linéairesBCV
 
Keine angst vor zinsanstieg
Keine angst vor zinsanstiegKeine angst vor zinsanstieg
Keine angst vor zinsanstiegBCV
 
Des performances stables avec les certificats de primes de risque
Des performances stables avec les certificats de primes de risqueDes performances stables avec les certificats de primes de risque
Des performances stables avec les certificats de primes de risqueBCV
 
Evaluation de l'incidence des produits structurés sur les marchés actions
Evaluation de l'incidence des produits structurés sur les marchés actionsEvaluation de l'incidence des produits structurés sur les marchés actions
Evaluation de l'incidence des produits structurés sur les marchés actionsBCV
 
Erfolg ohne Absturzrisiko - Derivate machen es möglich
Erfolg ohne Absturzrisiko - Derivate machen es möglichErfolg ohne Absturzrisiko - Derivate machen es möglich
Erfolg ohne Absturzrisiko - Derivate machen es möglichBCV
 
Vers la couverture des risques systémiques?
Vers la couverture des risques systémiques?Vers la couverture des risques systémiques?
Vers la couverture des risques systémiques?BCV
 
qCIO Global Macro Hedge Fund Strategy - March 2015
qCIO Global Macro Hedge Fund Strategy - March 2015qCIO Global Macro Hedge Fund Strategy - March 2015
qCIO Global Macro Hedge Fund Strategy - March 2015BCV
 
qCIO Global Macro Hedge Fund Strategy - November 2014
qCIO Global Macro Hedge Fund Strategy - November 2014qCIO Global Macro Hedge Fund Strategy - November 2014
qCIO Global Macro Hedge Fund Strategy - November 2014BCV
 
Le Temps - 20 Octobre 2014 - Eclairage psychologique d'un choix rationnel
Le Temps - 20 Octobre 2014 - Eclairage psychologique d'un choix rationnelLe Temps - 20 Octobre 2014 - Eclairage psychologique d'un choix rationnel
Le Temps - 20 Octobre 2014 - Eclairage psychologique d'un choix rationnelBCV
 
Le Temps - 21 octobre 2013 - Benchmarker un produit structuré
Le Temps - 21 octobre 2013 - Benchmarker un produit structuréLe Temps - 21 octobre 2013 - Benchmarker un produit structuré
Le Temps - 21 octobre 2013 - Benchmarker un produit structuréBCV
 
Le temps - 30 juin 2014 - Des instruments plus flexibles dans l'obligataire
Le temps - 30 juin 2014 - Des instruments plus flexibles dans l'obligataireLe temps - 30 juin 2014 - Des instruments plus flexibles dans l'obligataire
Le temps - 30 juin 2014 - Des instruments plus flexibles dans l'obligataireBCV
 
INDICES Mai 2014 Produits financiers - Surévaluation de la volatilité implicit...
INDICES Mai 2014 Produits financiers - Surévaluation de la volatilité implicit...INDICES Mai 2014 Produits financiers - Surévaluation de la volatilité implicit...
INDICES Mai 2014 Produits financiers - Surévaluation de la volatilité implicit...BCV
 
Fundamental analysis & recommendations qms advisors flex index spi index - ...
Fundamental analysis & recommendations   qms advisors flex index spi index - ...Fundamental analysis & recommendations   qms advisors flex index spi index - ...
Fundamental analysis & recommendations qms advisors flex index spi index - ...BCV
 
Fundamental Analysis & Recommendations - QMS Advisors FlexIndex KOSPI 100
Fundamental Analysis & Recommendations - QMS Advisors FlexIndex KOSPI 100 Fundamental Analysis & Recommendations - QMS Advisors FlexIndex KOSPI 100
Fundamental Analysis & Recommendations - QMS Advisors FlexIndex KOSPI 100 BCV
 
Fundamental Equity Analysis - QMS Advisors HDAX FlexIndex 110
Fundamental Equity Analysis - QMS Advisors HDAX FlexIndex 110Fundamental Equity Analysis - QMS Advisors HDAX FlexIndex 110
Fundamental Equity Analysis - QMS Advisors HDAX FlexIndex 110BCV
 
Fundamental Analysis & Recommendations - OEX Index - The Standard & Poor's 10...
Fundamental Analysis & Recommendations - OEX Index - The Standard & Poor's 10...Fundamental Analysis & Recommendations - OEX Index - The Standard & Poor's 10...
Fundamental Analysis & Recommendations - OEX Index - The Standard & Poor's 10...BCV
 
Fundamental analysis & recommendations spi index - the swiss performance in...
Fundamental analysis & recommendations   spi index - the swiss performance in...Fundamental analysis & recommendations   spi index - the swiss performance in...
Fundamental analysis & recommendations spi index - the swiss performance in...BCV
 
Fundamental Equity Analysis - QMS Global Agriculture FlexIndex - The QMS Advi...
Fundamental Equity Analysis - QMS Global Agriculture FlexIndex - The QMS Advi...Fundamental Equity Analysis - QMS Global Agriculture FlexIndex - The QMS Advi...
Fundamental Equity Analysis - QMS Global Agriculture FlexIndex - The QMS Advi...BCV
 
Fundamental Equity Analysis and Analyst Recommandations - MSCI Emerging Marke...
Fundamental Equity Analysis and Analyst Recommandations - MSCI Emerging Marke...Fundamental Equity Analysis and Analyst Recommandations - MSCI Emerging Marke...
Fundamental Equity Analysis and Analyst Recommandations - MSCI Emerging Marke...BCV
 

Mehr von BCV (20)

Vers la couverture des risques systémiques
Vers la couverture des risques systémiquesVers la couverture des risques systémiques
Vers la couverture des risques systémiques
 
Le plus convexe des investissements linéaires
Le plus convexe des investissements linéairesLe plus convexe des investissements linéaires
Le plus convexe des investissements linéaires
 
Keine angst vor zinsanstieg
Keine angst vor zinsanstiegKeine angst vor zinsanstieg
Keine angst vor zinsanstieg
 
Des performances stables avec les certificats de primes de risque
Des performances stables avec les certificats de primes de risqueDes performances stables avec les certificats de primes de risque
Des performances stables avec les certificats de primes de risque
 
Evaluation de l'incidence des produits structurés sur les marchés actions
Evaluation de l'incidence des produits structurés sur les marchés actionsEvaluation de l'incidence des produits structurés sur les marchés actions
Evaluation de l'incidence des produits structurés sur les marchés actions
 
Erfolg ohne Absturzrisiko - Derivate machen es möglich
Erfolg ohne Absturzrisiko - Derivate machen es möglichErfolg ohne Absturzrisiko - Derivate machen es möglich
Erfolg ohne Absturzrisiko - Derivate machen es möglich
 
Vers la couverture des risques systémiques?
Vers la couverture des risques systémiques?Vers la couverture des risques systémiques?
Vers la couverture des risques systémiques?
 
qCIO Global Macro Hedge Fund Strategy - March 2015
qCIO Global Macro Hedge Fund Strategy - March 2015qCIO Global Macro Hedge Fund Strategy - March 2015
qCIO Global Macro Hedge Fund Strategy - March 2015
 
qCIO Global Macro Hedge Fund Strategy - November 2014
qCIO Global Macro Hedge Fund Strategy - November 2014qCIO Global Macro Hedge Fund Strategy - November 2014
qCIO Global Macro Hedge Fund Strategy - November 2014
 
Le Temps - 20 Octobre 2014 - Eclairage psychologique d'un choix rationnel
Le Temps - 20 Octobre 2014 - Eclairage psychologique d'un choix rationnelLe Temps - 20 Octobre 2014 - Eclairage psychologique d'un choix rationnel
Le Temps - 20 Octobre 2014 - Eclairage psychologique d'un choix rationnel
 
Le Temps - 21 octobre 2013 - Benchmarker un produit structuré
Le Temps - 21 octobre 2013 - Benchmarker un produit structuréLe Temps - 21 octobre 2013 - Benchmarker un produit structuré
Le Temps - 21 octobre 2013 - Benchmarker un produit structuré
 
Le temps - 30 juin 2014 - Des instruments plus flexibles dans l'obligataire
Le temps - 30 juin 2014 - Des instruments plus flexibles dans l'obligataireLe temps - 30 juin 2014 - Des instruments plus flexibles dans l'obligataire
Le temps - 30 juin 2014 - Des instruments plus flexibles dans l'obligataire
 
INDICES Mai 2014 Produits financiers - Surévaluation de la volatilité implicit...
INDICES Mai 2014 Produits financiers - Surévaluation de la volatilité implicit...INDICES Mai 2014 Produits financiers - Surévaluation de la volatilité implicit...
INDICES Mai 2014 Produits financiers - Surévaluation de la volatilité implicit...
 
Fundamental analysis & recommendations qms advisors flex index spi index - ...
Fundamental analysis & recommendations   qms advisors flex index spi index - ...Fundamental analysis & recommendations   qms advisors flex index spi index - ...
Fundamental analysis & recommendations qms advisors flex index spi index - ...
 
Fundamental Analysis & Recommendations - QMS Advisors FlexIndex KOSPI 100
Fundamental Analysis & Recommendations - QMS Advisors FlexIndex KOSPI 100 Fundamental Analysis & Recommendations - QMS Advisors FlexIndex KOSPI 100
Fundamental Analysis & Recommendations - QMS Advisors FlexIndex KOSPI 100
 
Fundamental Equity Analysis - QMS Advisors HDAX FlexIndex 110
Fundamental Equity Analysis - QMS Advisors HDAX FlexIndex 110Fundamental Equity Analysis - QMS Advisors HDAX FlexIndex 110
Fundamental Equity Analysis - QMS Advisors HDAX FlexIndex 110
 
Fundamental Analysis & Recommendations - OEX Index - The Standard & Poor's 10...
Fundamental Analysis & Recommendations - OEX Index - The Standard & Poor's 10...Fundamental Analysis & Recommendations - OEX Index - The Standard & Poor's 10...
Fundamental Analysis & Recommendations - OEX Index - The Standard & Poor's 10...
 
Fundamental analysis & recommendations spi index - the swiss performance in...
Fundamental analysis & recommendations   spi index - the swiss performance in...Fundamental analysis & recommendations   spi index - the swiss performance in...
Fundamental analysis & recommendations spi index - the swiss performance in...
 
Fundamental Equity Analysis - QMS Global Agriculture FlexIndex - The QMS Advi...
Fundamental Equity Analysis - QMS Global Agriculture FlexIndex - The QMS Advi...Fundamental Equity Analysis - QMS Global Agriculture FlexIndex - The QMS Advi...
Fundamental Equity Analysis - QMS Global Agriculture FlexIndex - The QMS Advi...
 
Fundamental Equity Analysis and Analyst Recommandations - MSCI Emerging Marke...
Fundamental Equity Analysis and Analyst Recommandations - MSCI Emerging Marke...Fundamental Equity Analysis and Analyst Recommandations - MSCI Emerging Marke...
Fundamental Equity Analysis and Analyst Recommandations - MSCI Emerging Marke...
 

Financial analysis nobel biocare holding ag develops and produces dental implants and dental prosthetics. the company manufactures permanent replacements for tooth roots, and dental crowns and bridges

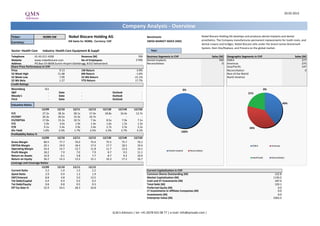
  • 1. 20.02.2013 Company Analysis - Overview Ticker: NOBN SW Nobel Biocare Holding AG Benchmark: Nobel Biocare Holding AG develops and produces dental implants and dental SIX Swiss Ex: NOBN, Currency: CHF SWISS MARKET INDEX (SMI) prosthetics. The Company manufactures permanent replacements for tooth roots, and Currency: dental crowns and bridges. Nobel Biocare sells under the brand names Branemark System, Steri-Oss/Replace, and Procera on the global market. Sector: Health Care Industry: Health Care Equipment & Suppli Year: Telephone 41-43-211-4200 Revenue (M) 700 Business Segments in CHF Sales (M) Geographic Segments in CHF Sales (M) Website www.nobelbiocare.com No of Employees 2'496 Dental Implants 700 EMEA 277 Address PO Box CH-8058 Zurich-Airport Glattbrugg, 8152 Switzerland Reconciliation 0 Americas 275 Share Price Performance in CHF Asia/Pacific 147 Price 9.13 1M Return -3.9% Reconciliation 0 52 Week High 11.68 6M Return -1.6% Rest of the World 52 Week Low 7.09 52 Wk Return -21.1% North America 52 Wk Beta 1.27 YTD Return 17.7% Credit Ratings Bloomberg IG1 0% 0% S&P - Date - Outlook - 21% Moody's - Date - Outlook - Fitch - Date - Outlook - 40% Valuation Ratios 12/09 12/10 12/11 12/12 12/13E 12/14E 12/15E P/E 27.2x 38.3x 28.1x 17.4x 18.8x 16.4x 12.7x EV/EBIT 20.3x 20.5x 15.5x 10.7x - - - EV/EBITDA 17.0x 15.2x 10.7x 7.3x 8.5x 7.9x 7.1x P/S 5.0x 3.0x 1.9x 1.4x 1.6x 1.5x 1.5x P/B 9.1x 5.4x 3.9x 2.4x 2.7x 2.5x 2.2x 39% Div Yield 1.6% 2.5% 1.7% 2.5% 2.3% 2.7% 3.1% 100% Profitability Ratios % 12/09 12/10 12/11 12/12 12/13E 12/14E 12/15E Gross Margin 80.5 77.7 76.0 75.4 75.5 75.7 76.1 EBITDA Margin 29.1 19.9 18.4 17.4 17.7 18.5 19.4 EMEA Americas Operating Margin 24.4 14.7 12.7 11.8 11.7 12.6 14.1 Dental Implants Reconciliation Profit Margin 18.2 7.9 7.0 7.9 8.7 9.5 11.1 Return on Assets 14.9 6.1 5.8 7.7 8.7 9.2 10.0 Asia/Pacific Reconciliation Return on Equity 36.2 14.3 13.2 15.1 16.3 17.2 16.7 Leverage and Coverage Ratios 12/09 12/10 12/11 12/12 Current Ratio 3.2 1.0 1.5 2.2 Current Capitalization in CHF Quick Ratio 2.9 0.9 1.3 1.9 Common Shares Outstanding (M) 122.8 EBIT/Interest 8.8 4.8 5.0 13.5 Market Capitalization (M) 1130.2 Tot Debt/Capital 0.4 0.4 0.3 0.2 Cash and ST Investments (M) 187.0 Tot Debt/Equity 0.8 0.8 0.5 0.3 Total Debt (M) 120.1 Eff Tax Rate % 22.9 54.5 28.3 24.8 Preferred Equity (M) 0.0 LT Investments in Affiliate Companies (M) 0.0 Investments (M) 0.0 Enterprise Value (M) 1063.2 Q.M.S Advisors | tel: +41 (0)78 922 08 77 | e-mail: info@qmsadv.com |
  • 2. Company Analysis - Analysts Ratings Nobel Biocare Holding AG Target price in CHF Broker Recommendation Buy and Sell Recommendations vs Price and Target Price Price Brokers' Target Price 16 30 100% 14 25 80% 42% 42% 20 46% 46% 46% 46% 46% 46% 50% 50% 50% 50% 12 15 10 60% 10 8 5 40% 33% 33% 42% 6 0 38% 38% 38% 46% 42% Bryan Garnier & Cie Morgan Stanley Barclays Kepler Capital Markets Main First Bank AG Equita SIM SpA S&P Capital IQ Commerzbank Corporates & CA Cheuvreux Credit Suisse Exane BNP Paribas Sanford C. Bernstein & Co JPMorgan Helvea Nomura Bank Vontobel AG HSBC EVA Dimensions Berenberg Bank Goldman Sachs Northcoast Research Deutsche Bank Zuercher Kantonalbank Jefferies 42% 42% 42% 46% 4 20% 2 Markets 17% 21% 21% 17% 17% 17% 13% 12% 8% 8% 8% 4% 0% 0 févr.12 mars.12 avr.12 mai.12 juin.12 juil.12 août.12 sept.12 oct.12 nov.12 déc.12 janv.13 Buy Hold Sell Price Target Price Date Buy Hold Sell Date Price Target Price Broker Analyst Recommendation Target Date 31-Jan-13 4% 46% 50% 20-Feb-13 9.13 8.69 Deutsche Bank YI-DAN WANG sell 5.90 20-Feb-13 31-Dec-12 8% 42% 50% 19-Feb-13 9.61 8.91 Goldman Sachs VERONIKA DUBAJOVA neutral/neutral 9.20 20-Feb-13 30-Nov-12 8% 42% 50% 18-Feb-13 9.93 8.91 Credit Suisse CHRISTOPH GRETLER neutral 10.80 20-Feb-13 31-Oct-12 8% 42% 50% 15-Feb-13 9.62 8.91 Berenberg Bank TOM JONES buy 12.25 20-Feb-13 28-Sep-12 12% 42% 46% 14-Feb-13 9.62 8.58 Kepler Capital Markets MAJA PATAKI hold 9.30 20-Feb-13 31-Aug-12 13% 46% 42% 13-Feb-13 9.78 8.58 S&P Capital IQ JACOB THRANE sell 8.60 20-Feb-13 31-Jul-12 17% 38% 46% 12-Feb-13 9.44 8.42 Main First Bank AG STEPHAN VOLLERT underperform 8.80 20-Feb-13 29-Jun-12 17% 38% 46% 11-Feb-13 9.38 8.42 Exane BNP Paribas JULIEN DORMOIS underperform 9.00 20-Feb-13 31-May-12 17% 42% 42% 8-Feb-13 9.34 8.63 Barclays ALEXANDER KLEBAN underweight 6.60 20-Feb-13 30-Apr-12 21% 33% 46% 7-Feb-13 9.15 8.63 Morgan Stanley MICHAEL K JUNGLING Underwt/Attractive 5.90 19-Feb-13 30-Mar-12 21% 33% 46% 6-Feb-13 9.33 8.63 JPMorgan DAVID J ADLINGTON underweight 7.30 19-Feb-13 29-Feb-12 17% 38% 46% 5-Feb-13 9.28 8.63 Sanford C. Bernstein & Co LISA BEDELL CLIVE market perform 9.00 19-Feb-13 4-Feb-13 9.17 8.63 Bank Vontobel AG CARLA BAENZIGER hold 8.60 19-Feb-13 1-Feb-13 9.46 8.63 Bryan Garnier & Cie MATHIEU CHABERT sell 8.90 19-Feb-13 31-Jan-13 9.54 8.63 Nomura MARTIN BRUNNINGER neutral 10.00 19-Feb-13 30-Jan-13 9.58 8.56 Helvea SIMON GOETSCHMANN neutral 9.70 19-Feb-13 29-Jan-13 9.58 8.52 Northcoast Research EDWIN SNYDER sell 6.50 19-Feb-13 28-Jan-13 9.69 8.52 Commerzbank Corporates & Markets OLIVER METZGER hold 9.10 15-Feb-13 25-Jan-13 9.71 8.52 HSBC HENDRIK LOFRUTHE neutral 9.00 15-Feb-13 24-Jan-13 9.70 8.52 EVA Dimensions ANDREW S ZAMFOTIS underweight 23-Jan-13 23-Jan-13 9.90 8.52 Zuercher Kantonalbank SIBYLLE BISCHOFBERGER FRICK underperform 16-Jan-13 22-Jan-13 9.44 8.40 CA Cheuvreux DANIEL JELOVCAN underperform 7.25 8-Nov-12 21-Jan-13 9.42 8.40 Jefferies INGEBORG OIE hold 9.00 15-Oct-12 18-Jan-13 9.50 8.40 Equita SIM SpA FABIO FAZZARI not rated 26.00 21-May-09 17-Jan-13 9.05 8.40 16-Jan-13 8.69 8.40 15-Jan-13 8.70 8.43 14-Jan-13 8.60 8.43 11-Jan-13 8.65 8.43 10-Jan-13 8.65 8.43 Q.M.S Advisors | tel: +41 (0)78 922 08 77 | e-mail: info@qmsadv.com |
  • 3. 20.02.2013 Nobel Biocare Holding AG Company Analysis - Ownership Ownership Type Ownership Statistics Geographic Ownership Distribution Geographic Ownership 0% Shares Outstanding (M) 122.8 United States 29.78% 5% 5% Float 87.0% Britain 24.96% 6% Short Interest (M) Switzerland 10.66% 30% Short Interest as % of Float Singapore 9.98% Days to Cover Shorts 45% Canada 8.38% 8% Institutional Ownership 54.70% 55% Norway 5.69% Retail Ownership 45.07% Luxembourg 5.32% Insider Ownership 0.23% Others 5.23% 10% 25% Institutional Ownership Distribution Investment Advisor 62.78% 11% Government 15.52% Mutual Fund Manager 10.29% Institutional Ownership Retail Ownership Insider Ownership Other 5.74% United States Britain Switzerland Singapore Pricing data is in CHF Others 5.66% Canada Norway Luxembourg Others Top 20 Owners: TOP 20 ALL Institutional Ownership Holder Name Position Position Change Market Value % of Ownership Report Date Source Country SILCHESTER INTL INVE 12'605'473 6'383'119 115'087'968 10.18% 24.08.2012 EXCH BRITAIN 6% FRANKLIN RESOURCES 7'387'481 72'834 67'447'702 5.97% 14.01.2013 ULT-AGG UNITED STATES 6% GOVT OF SINGAPORE IN 6'795'557 0 62'043'435 5.49% 31.12.2011 ULT-AGG SINGAPORE INVESCO LTD 6'216'059 2'445'504 56'752'619 5.02% 11.04.2012 EXCH UNITED STATES 10% TRIMARK INVESTMENT M 5'030'544 0 45'928'867 4.06% 30.09.2012 MF-AGG CANADA GOVERNANCE FOR OWNER 3'909'643 0 35'695'041 3.16% 31.12.2011 Co File BRITAIN NORGES BANK 3'768'834 0 34'409'454 3.04% 05.02.2013 EXCH NORWAY 62% CREDIT SUISSE ASSET 2'500'726 -42'449 22'831'628 2.02% 28.12.2012 MF-AGG SWITZERLAND 16% VANGUARD GROUP INC 2'274'825 21'757 20'769'152 1.84% 31.12.2012 MF-AGG UNITED STATES NEW JERSEY DIVISION 2'183'120 0 19'931'886 1.76% 30.06.2012 MF-AGG UNITED STATES UNION INVESTMENT GMB 2'000'000 -232'723 18'260'000 1.62% 28.09.2012 MF-AGG GERMANY CAPITAL GROUP COMPAN 1'350'000 0 12'325'500 1.09% 31.12.2012 ULT-AGG UNITED STATES SWISSCANTO FONDSLEIT 1'325'169 -51'431 12'098'793 1.07% 30.11.2012 MF-AGG SWITZERLAND UNION INVESTMENT LUX 1'323'847 0 12'086'723 1.07% 28.09.2012 MF-AGG LUXEMBOURG Investment Advisor Government Mutual Fund Manager Other Others NOBEL BIOCARE HOLDIN 1'303'120 0 11'897'486 1.05% 31.12.2011 Co File SWITZERLAND PICTET & CIE 681'647 1'555 6'223'437 0.55% 31.10.2012 MF-AGG SWITZERLAND UBS FUND MANAGEMENT 670'183 1'761 6'118'771 0.54% 31.10.2012 MF-AGG SWITZERLAND INVESCO CANADA LTD 565'501 0 5'163'024 0.46% 30.09.2012 MF-AGG CANADA SCHRODER INVESTMENT 529'332 -192'242 4'832'801 0.43% 31.10.2012 MF-AGG BRITAIN FMR LLC 427'359 427'359 3'901'788 0.35% 30.04.2012 ULT-AGG UNITED STATES Top 5 Insiders: Holder Name Position Position Change Market Value % of Ownership Report Date Source LAUBE RICHARD T 110'000 1'004'300 0.09% 31.12.2011 Co File BREU RAYMUND 70'000 639'100 0.06% 31.12.2011 Co File WATTER ROLF URS 53'500 488'455 0.04% 31.12.2011 Co File LILJA ROBERT 18'375 167'764 0.02% 31.12.2011 Co File FLURI EDGAR 16'500 150'645 0.01% 31.12.2011 Co File Q.M.S Advisors | tel: +41 (0)78 922 08 77 | e-mail: info@qmsadv.com |
  • 4. Company Analysis - Financials I/IV Nobel Biocare Holding AG Financial information is in CHF (M) Equivalent Estimates Periodicity: Fiscal Year 12/02 12/03 12/04 12/05 12/06 12/07 12/08 12/09 12/10 12/11 12/12 12/13E 12/14E 12/15E Income Statement Revenue 456 508 600 750 945 1'094 982 878 796 702 700 705 731 770 - Cost of Goods Sold 111 120 122 133 151 175 199 171 178 168 172 Gross Income 345 388 478 617 794 919 783 706 619 533 527 532 553 586 - Selling, General & Admin Expenses 242 255 291 364 452 548 572 493 501 444 444 (Research & Dev Costs) 19 21 22 26 28 37 52 38 44 36 42 Operating Income 103 133 190 270 342 371 211 214 117 89 83 83 92 109 - Interest Expense 4 5 3 4 3 6 28 24 24 18 6 - Foreign Exchange Losses (Gains) 1 0 13 19 16 4 -97 -40 -44 -36 -0 - Net Non-Operating Losses (Gains) 9 -11 -5 -44 4 12 27 23 -2 39 4 Pretax Income 90 139 179 292 319 348 253 207 139 68 74 80 91 110 - Income Tax Expense 34 28 37 52 70 75 79 47 76 19 18 Income Before XO Items 56 111 142 239 249 273 174 160 63 49 55 - Extraordinary Loss Net of Tax 0 0 0 0 0 0 0 0 0 - Minority Interests 1 1 1 0 0 0 0 0 0 0 0 Diluted EPS Before XO Items 1.09 1.85 1.98 2.20 1.43 1.28 0.51 0.39 0.45 Net Income Adjusted* 55 109 147 201 249 273 184 160 109 49 59 61 70 85 EPS Adjusted 0.44 0.87 1.15 1.57 1.99 2.21 1.50 1.30 0.88 0.39 0.47 0.49 0.56 0.72 Dividends Per Share 0.15 0.26 0.53 0.70 0.85 0.95 0.59 0.55 0.48 0.18 0.19 0.21 0.24 0.29 Payout Ratio % 34.8 29.5 74.5 58.7 44.0 46.2 41.7 42.4 95.0 46.3 43.6 0.44 0.44 0.40 Total Shares Outstanding 126 127 129 126 124 122 123 123 123 122 123 Diluted Shares Outstanding 132 132 130 130 126 124 122 124 123 123 123 EBITDA 135 163 221 290 366 399 256 256 158 129 121 125 135 149 *Net income excludes extraordinary gains and losses and one-time charges. Q.M.S Advisors | tel: +41 (0)78 922 08 77 | e-mail: info@qmsadv.com |
  • 5. Company Analysis - Financials II/IV Periodicity: 12/02 12/03 12/04 12/05 12/06 12/07 12/08 12/09 12/10 12/11 12/12 12/13E 12/14E 12/15E Balance Sheet Total Current Assets 206.207909 331.12563 463.403059 500.117142 492.379793 762.130423 629.90881 626.598869 532.918185 325.679126 365.411287 + Cash & Near Cash Items 76 171 301 201 213 312 246 358 299 131 177 + Short Term Investments 0 0 54 0 82 6 15 9 10 + Accounts & Notes Receivable 77 92 110 163 200 253 211 203 166 133 116 + Inventories 41 35 27 47 49 59 55 30 29 29 25 + Other Current Assets 12 33 25 35 31 139 37 30 23 24 38 Total Long-Term Assets 265 259 263 302 319 324 410 445 430 395 359 + Long Term Investments 1 1 1 3 4 3 0 Gross Fixed Assets 104 126 136 159 180 204 215 239 241 251 249 Accumulated Depreciation 64 82 86 94 102 110 109 127 128 146 164 + Net Fixed Assets 40 44 49 66 78 94 106 112 113 105 86 + Other Long Term Assets 224 214 213 234 237 227 304 332 317 290 274 Total Current Liabilities 78 97 120 201 185 270 213 198 519 212 163 + Accounts Payable 20 14 20 29 51 49 42 33 24 19 23 + Short Term Borrowings 2 0 1 2 3 42 3 315 45 0 + Other Short Term Liabilities 56 83 100 171 131 217 128 162 179 148 140 Total Long Term Liabilities 81 48 56 45 46 373 429 402 45 166 170 + Long Term Borrowings 43 1 1 0 0 342 356 351 0 120 120 + Other Long Term Borrowings 37 46 55 45 46 31 72 51 45 47 50 Total Liabilities 159 144 176 246 231 643 641 600 563 378 333 + Long Preferred Equity 0 0 0 0 0 0 0 0 0 0 0 + Minority Interest 3 4 2 0 0 0 0 0 0 0 0 + Share Capital & APIC 135 175 188 205 247 365 322 294 228 174 169 + Retained Earnings & Other Equity 174 267 361 352 334 78 77 177 171 169 223 Total Shareholders Equity 312 446 551 557 581 444 399 471 399 342 392 Total Liabilities & Equity 471 590 727 803 811 1'086 1'040 1'071 963 721 725 Book Value Per Share 2.46 3.47 4.27 4.42 4.67 3.64 3.24 3.83 3.25 2.80 3.19 3.34 3.64 4.22 Tangible Book Value Per Share 2.79 2.72 2.91 1.95 0.99 1.33 0.98 0.68 1.17 Q.M.S Advisors | tel: +41 (0)78 922 08 77 | e-mail: info@qmsadv.com |
  • 6. Company Analysis - Financials III/IV Periodicity: 12/02 12/03 12/04 12/05 12/06 12/07 12/08 12/09 12/10 12/11 12/12 12/13E 12/14E 12/15E Cash Flows Net Income 55 109 141 239 249 273 174 160 63 49 55 61 71 86 + Depreciation & Amortization 32 30 31 20 24 28 45 42 41 40 39 + Other Non-Cash Adjustments 24 1 43 -37 7 -4 -12 17 5 -0 2 + Changes in Non-Cash Capital -11 -13 -10 -53 -27 -76 56 39 17 21 21 Cash From Operating Activities 100 128 205 170 254 222 263 258 126 110 117 + Disposal of Fixed Assets 0 0 + Capital Expenditures -16 -19 -25 -30 -31 -41 -48 -28 -32 -21 -9 -30 -31 -36 + Increase in Investments -54 + Decrease in Investments + Other Investing Activities -4 5 -26 46 42 -120 -50 -43 2 -39 0 Cash From Investing Activities -20 -14 -51 -39 11 -161 -98 -71 -30 -60 -9 + Dividends Paid -12 -20 -33 -68 -88 -106 -117 -68 -64 -41 -18 + Change in Short Term Borrowings 22 -38 -2 -284 -45 + Increase in Long Term Borrowings 7 0 382 0 118 + Decrease in Long Term Borrowings -33 -42 -1 0 -18 -49 + Increase in Capital Stocks 1 39 13 17 41 248 50 8 0 3 + Decrease in Capital Stocks -182 -214 -486 -26 -10 -7 -6 + Other Financing Activities -3 -4 -2 -0 0 -9 -130 55 24 0 -1 Cash From Financing Activities -39 -27 -22 -234 -260 30 -201 -70 -98 -213 -61 Net Changes in Cash 41 87 132 -103 5 91 -36 117 -2 -163 47 Free Cash Flow (CFO-CAPEX) 84 108 180 139 222 181 215 230 94 89 108 66 78 86 Free Cash Flow To Firm 86 112 183 142 224 186 234 249 105 102 112 Free Cash Flow To Equity 58 67 138 222 563 236 175 43 -77 Free Cash Flow per Share 0.67 0.86 1.41 1.09 1.78 1.46 1.76 1.87 0.76 0.73 0.88 Q.M.S Advisors | tel: +41 (0)78 922 08 77 | e-mail: info@qmsadv.com |
  • 7. Company Analysis - Financials IV/IV Periodicity: 12/02 12/03 12/04 12/05 12/06 12/07 12/08 12/09 12/10 12/11 12/12 12/13E 12/14E 12/15E Ratio Analysis Valuation Ratios Price Earnings 40.8x 28.1x 37.2x 30.7x 35.3x 27.1x 16.0x 27.2x 38.3x 28.1x 17.4x 18.8x 16.4x 12.7x EV to EBIT 21.6x 22.2x 26.2x 25.9x 25.0x 19.8x 13.7x 20.3x 20.5x 15.5x 10.7x EV to EBITDA 16.5x 18.0x 22.6x 24.1x 23.3x 18.4x 11.3x 17.0x 15.2x 10.7x 7.3x 8.5x 7.9x 7.1x Price to Sales 4.9x 6.1x 8.8x 9.8x 9.3x 6.8x 2.8x 5.0x 3.0x 1.9x 1.4x 1.6x 1.5x 1.5x Price to Book 7.3x 7.3x 9.7x 13.1x 15.4x 16.6x 6.6x 9.1x 5.4x 3.9x 2.4x 2.7x 2.5x 2.2x Dividend Yield 0.9% 1.1% 1.3% 1.2% 1.2% 1.6% 2.6% 1.6% 2.5% 1.7% 2.5% 2.3% 2.7% 3.1% Profitability Ratios Gross Margin 75.6% 76.4% 79.7% 82.3% 84.0% 84.0% 79.7% 80.5% 77.7% 76.0% 75.4% 75.5% 75.7% 76.1% EBITDA Margin 29.5% 32.1% 36.9% 38.7% 38.7% 36.5% 26.0% 29.1% 19.9% 18.4% 17.4% 17.7% 18.5% 19.4% Operating Margin 22.6% 26.1% 31.8% 36.0% 36.2% 33.9% 21.5% 24.4% 14.7% 12.7% 11.8% 11.7% 12.6% 14.1% Profit Margin 12.1% 21.6% 23.6% 31.9% 26.3% 25.0% 17.7% 18.2% 7.9% 7.0% 7.9% 8.7% 9.5% 11.1% Return on Assets 11.5% 20.6% 21.6% 31.4% 31.0% 28.7% 16.2% 14.9% 6.1% 5.8% 7.7% 8.7% 9.2% 10.0% Return on Equity 17.9% 29.1% 28.7% 43.4% 44.0% 52.9% 41.0% 36.2% 14.3% 13.2% 15.1% 16.3% 17.2% 16.7% Leverage & Coverage Ratios Current Ratio 2.64 3.42 3.86 2.49 2.67 2.83 2.96 3.16 1.03 1.54 2.24 Quick Ratio 1.96 2.72 3.42 2.08 2.23 2.09 2.54 2.86 0.93 1.29 1.86 Interest Coverage Ratio (EBIT/I) 27.26 28.76 67.10 70.90 132.22 58.89 7.54 8.75 4.81 5.04 13.51 Tot Debt/Capital 0.13 0.00 0.00 0.00 0.00 0.44 0.50 0.43 0.44 0.32 0.23 Tot Debt/Equity 0.14 0.00 0.00 0.00 0.00 0.78 1.00 0.75 0.79 0.48 0.31 Others Asset Turnover 0.95 0.95 0.92 0.98 1.18 1.15 0.92 0.82 0.77 0.83 0.97 Accounts Receivable Turnover 5.80 5.97 5.97 5.51 5.24 4.81 4.21 4.18 4.28 4.70 5.65 Accounts Payable Turnover 6.34 6.42 6.73 6.19 3.78 3.62 4.37 3.86 6.35 7.92 8.07 Inventory Turnover 2.93 3.14 3.94 3.60 3.16 3.24 3.49 3.98 5.86 5.77 6.44 Effective Tax Rate 37.4% 20.4% 20.7% 17.9% 22.0% 21.6% 31.2% 22.9% 54.5% 28.3% 24.8% Q.M.S Advisors | tel: +41 (0)78 922 08 77 | e-mail: info@qmsadv.com |
  • 8. Company Analysis - Peers Comparision NOBEL BIOCAR- STRAUMANN SONOVA HOLDING SIRONA DENTAL FRESENIUS TECAN GROUP AG- ZIMMER HLDGS DENTSPLY INTL WILLIAM DEMANT SMITH & NEPHEW FRESENIUS SE & C CELESIO AG GALENICA -REG REG HLDG-R A SY MEDICA R Latest Fiscal Year: 12/2012 12/2011 12/2012 03/2012 12/2012 09/2012 12/2011 12/2011 12/2012 12/2011 12/2011 12/2011 12/2011 52-Week High 11.68 160.70 76.75 115.30 43.51 73.98 60.27 596.50 738.00 96.93 90.00 15.57 626.00 52-Week High Date 27.04.2012 29.05.2012 13.02.2013 15.02.2013 19.02.2013 08.02.2013 30.07.2012 19.07.2012 30.01.2013 16.10.2012 13.02.2013 22.10.2012 11.07.2012 52-Week Low 7.09 97.90 57.46 82.23 35.04 40.59 47.79 454.00 567.50 68.60 59.05 10.72 479.25 52-Week Low Date 21.11.2012 16.11.2012 26.07.2012 22.05.2012 02.08.2012 04.06.2012 10.01.2013 16.11.2012 06.06.2012 26.04.2012 06.06.2012 05.06.2012 16.11.2012 Daily Volume 1'761'304 97'702 314'095 97'282 218'400 347'910 424'277 88'274 806'940 312'402 15'262 303'411 8'643 Current Price (2/dd/yy) 9.13 127.00 76.04 113.80 43.14 71.51 51.84 487.50 711.00 88.74 88.15 13.50 539.50 52-Week High % Change -21.8% -21.0% -0.9% -1.3% -0.9% -3.3% -14.0% -18.3% -3.7% -8.4% -2.1% -13.3% -13.8% 52-Week Low % Change 28.8% 29.7% 32.3% 38.4% 23.1% 76.2% 8.5% 7.4% 25.3% 29.4% 49.3% 25.9% 12.6% Total Common Shares (M) 122.8 15.5 173.5 66.5 141.7 55.1 304.1 57.6 902.5 163.2 11.4 170.1 6.4 Market Capitalization 1'130.2 1'990.9 13'193.1 7'600.9 6'122.8 4'063.6 15'865.5 28'445.6 6'432.9 15'815.0 1'008.8 2'296.4 3'506.8 Total Debt 99.5 1.8 1'820.9 257.8 1'766.7 75.5 7'211.4 2'312.0 468.0 10'208.0 4.4 2'067.0 1'165.2 Preferred Stock - - - - - - - - - - - - - Minority Interest - - - 1.8 36.1 3.0 570.0 4.0 - 4'923.0 - 32.2 45.7 Cash and Equivalents 154.9 378.0 1'555.9 198.7 77.1 151.1 457.3 288.0 178.0 635.0 165.1 448.3 345.3 Enterprise Value 860.3 1'874.1 13'458.1 7'648.6 7'754.6 4'018.3 22'364.4 30'530.6 10'127.5 31'578.0 875.8 4'142.0 4'422.8 Valuation Total Revenue LFY 580.5 693.6 4'471.7 1'619.8 2'928.4 979.4 12'795.1 8'041.0 4'137.0 16'522.0 377.0 23'026.4 3'480.6 LTM 580.5 688.0 4'471.7 1'729.3 2'928.4 993.6 13'417.2 8'399.0 4'137.0 18'533.0 377.3 22'560.6 3'545.8 CY+1 570.8 694.9 4'612.8 1'839.0 2'996.3 1'086.7 13'734.6 8'673.0 4'408.4 19'233.0 393.0 22'542.0 3'441.6 CY+2 591.7 699.3 4'798.8 1'988.6 3'172.3 1'181.4 14'706.6 9'384.5 4'599.3 20'953.4 425.3 22'562.5 3'558.3 EV/Total Revenue LFY 1.3x 3.0x 2.6x 3.9x 2.4x 3.6x 2.4x 4.1x 2.5x 1.9x 1.5x 0.2x 1.4x LTM 1.3x 3.0x 2.6x 3.7x 2.4x 3.5x 2.3x 3.9x 2.5x 1.7x 1.5x 0.2x 1.4x CY+1 1.5x 2.6x 2.9x 4.1x 2.4x 3.6x 2.2x 3.5x 2.2x 1.6x 2.2x 0.2x 1.2x CY+2 1.4x 2.5x 2.7x 3.7x 2.2x 3.1x 2.0x 3.2x 2.0x 1.4x 1.9x 0.2x 1.1x EBITDA LFY 100.7 116.7 1'676.9 366.1 421.6 263.5 2'632.2 1'905.0 1'271.0 3'237.0 60.4 486.6 399.9 LTM 100.7 128.5 1'676.9 416.9 488.9 266.7 2'817.0 - 1'236.0 3'672.0 62.1 597.0 408.2 CY+1 100.9 130.2 1'767.4 462.0 632.9 297.0 2'907.4 1'955.8 1'257.4 3'830.3 63.6 554.7 417.9 CY+2 109.4 156.6 1'846.2 522.1 672.9 330.1 3'114.3 2'260.3 1'365.9 4'161.5 72.3 612.1 421.7 EV/EBITDA LFY 7.3x 17.7x 7.1x 17.4x 16.7x 13.3x 11.7x 17.2x 8.1x 9.9x 9.6x 8.7x 12.1x LTM 7.3x 16.1x 7.1x 15.3x 14.4x 13.1x 11.0x - 8.3x 8.7x 9.3x 7.1x 11.8x CY+1 8.6x 14.0x 7.6x 16.2x 11.4x 13.0x 10.2x 15.5x 7.7x 8.0x 13.4x 7.4x 10.1x CY+2 7.5x 11.3x 7.0x 14.0x 10.2x 11.1x 9.3x 13.2x 6.8x 7.2x 11.1x 6.4x 9.6x EPS LFY 0.37 4.54 5.30 3.71 1.99 2.33 3.51 - 0.67 4.18 4.12 0.46 34.46 LTM 0.37 4.91 5.32 4.40 1.94 2.42 4.08 21.23 0.82 5.30 3.63 1.01 36.64 CY+1 0.39 5.27 5.76 5.02 2.45 3.46 3.72 21.12 0.78 5.41 4.06 1.20 37.80 CY+2 0.45 6.75 6.26 5.73 2.72 3.84 4.00 25.90 0.85 5.94 4.86 1.34 39.02 P/E LFY 20.0x 25.9x 14.3x 25.9x 22.2x 29.5x 17.0x 23.0x 13.3x 16.7x 24.3x 13.4x 14.7x LTM 20.0x 25.9x 14.3x 25.9x 22.2x 29.5x 17.1x - 16.0x 18.7x 24.4x 12.8x 14.8x CY+1 18.8x 24.1x 13.2x 22.7x 17.6x 20.7x 18.6x 23.1x 13.9x 16.4x 21.7x 11.3x 14.3x CY+2 16.4x 18.8x 12.1x 19.9x 15.9x 18.6x 17.3x 18.8x 12.8x 14.9x 18.1x 10.1x 13.8x Revenue Growth 1 Year 2.0% (6.0%) 0.4% 0.2% 15.4% 7.2% 6.2% 16.7% (3.1%) 3.4% 1.7% (1.1%) 1.0% 5 Year (3.2%) 0.9% 2.0% 8.4% 7.5% 6.8% 7.1% 10.0% 2.3% 11.9% (1.2%) 0.2% 7.4% EBITDA Growth 1 Year (3.7%) (44.7%) 3.7% (2.0%) - 8.8% 8.5% 17.5% 5.2% 5.9% (6.8%) (26.8%) (9.9%) 5 Year (16.1%) (11.5%) 1.6% 3.7% 2.6% 11.9% 10.7% 6.0% 6.2% 11.9% (0.9%) (9.3%) 21.9% EBITDA Margin LTM 17.4% 18.7% 37.5% 24.1% 16.8% 26.8% 21.0% - 29.9% 19.8% 16.4% 2.6% 11.5% CY+1 17.7% 18.7% 38.3% 25.1% 21.1% 27.3% 21.2% 22.6% 28.5% 19.9% 16.2% 2.5% 12.1% CY+2 18.5% 22.4% 38.5% 26.3% 21.2% 27.9% 21.2% 24.1% 29.7% 19.9% 17.0% 2.7% 11.9% Leverage/Coverage Ratios Total Debt / Equity % 30.6% 0.3% 31.0% 17.5% 95.6% 7.6% 91.3% 70.1% 12.0% 171.0% 1.6% 81.2% 100.7% FALSE Total Debt / Capital % 23.4% 0.3% 23.7% 14.9% 48.4% 7.1% 46.0% 41.2% 10.8% 48.4% 1.6% 44.5% 49.2% FALSE Total Debt / EBITDA 0.988x 0.011x 1.086x 0.604x 3.373x 0.283x 2.996x - 0.379x 3.072x 0.101x 3.317x 2.978x FALSE Net Debt / EBITDA -0.550x -0.910x 0.158x 0.111x 3.258x -0.183x 2.777x - 0.235x 2.808x -2.143x 3.041x 2.189x FALSE EBITDA / Int. Expense 19.811x 197.209x 23.003x 61.253x 9.623x 54.441x 7.386x 22.952x 105.917x 5.514x 597.723x 3.093x 10.010x FALSE Credit Ratings S&P LT Credit Rating - - A- - BBB+ - BB+ - - BB+ - - - FALSE S&P LT Credit Rating Date - - 13.04.2007 - 02.09.2011 - 19.09.2012 - - 19.09.2012 - - - FALSE Moody's LT Credit Rating - - Baa1 - Baa2 - - - - WR - - - FALSE Moody's LT Credit Rating Date - - 12.11.2009 - 16.08.2011 - - - - 30.04.2006 - - - FALSE Q.M.S Advisors | tel: +41 (0)78 922 08 77 | e-mail: info@qmsadv.com |