
Empfohlen
Weitere ähnliche Inhalte
Andere mochten auch
Andere mochten auch (19)
Mehr von scottbrooker
Mehr von scottbrooker (17)
Kürzlich hochgeladen
Kürzlich hochgeladen (20)
Q4 2010 Ottawa Industrial Marketbeat Report
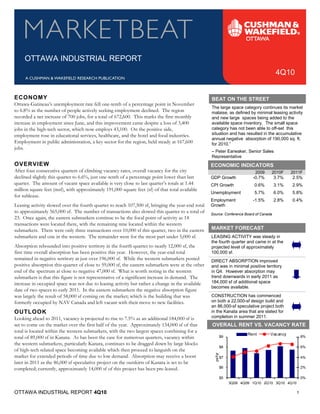
- 1. OTTAWA INDUSTRIAL REPORT 4Q10 ECONOMY BEAT ON THE STREET The large space category continues its market Ottawa-Gatineau’s unemployment rate fell one-tenth of a percentage point in November to 6.8% as the number of people actively seeking employment declined. The region malaise, as defined by minimal leasing activity recorded a net increase of 700 jobs, for a total of 672,600. This marks the first monthly and new large spaces being added to the available space inventory. The small space category has not been able to off-set this increase in employment since June, and this improvement came despite a loss of 3,400 situation and has resulted in the accumulative jobs in the high-tech sector, which now employs 43,100. On the positive side, annual negative absorption of 190,000 sq. ft. employment rose in educational services, healthcare, and the hotel and food industries. Employment in public administration, a key sector for the region, held steady at 167,600 for 2010.” – Peter Earwaker, Senior Sales jobs. Representative OVERVIEW ECONOMIC INDICATORS After four consecutive quarters of climbing vacancy rates, overall vacancy for the city 2009 2010F 2011F declined slightly this quarter to 6.6%, just one-tenth of a percentage point lower than last GDP Growth -0.7% 3.7% 2.5% quarter. The amount of vacant space available is very close to last quarter’s totals at 1.44 CPI Growth 0.6% 3.1% 2.9% Unemployment 5.7% 6.0% 5.8% million square feet (msf), with approximately 191,000 square feet (sf) of that total available Employment -1.5% 2.8% 0.4% for sublease. Leasing activity slowed over the fourth quarter to reach 107,500 sf, bringing the year-end total Growth Source: Conference Board of Canada to approximately 565,000 sf. The number of transactions also slowed this quarter to a total of 23. Once again, the eastern submarkets continue to be the focal point of activity as 14 MARKET FORECAST transactions were located there, with the remaining nine located within the western submarkets. There were only three transactions over 10,000 sf this quarter, two in the eastern LEASING ACTIVITY was steady in the fourth quarter and came in at the submarkets and one in the western. The remainder were for the most part under 5,000 sf. Absorption rebounded into positive territory in the fourth quarter to nearly 12,000 sf, the projected level of approximately first time overall absorption has been positive this year. However, the year-end total 100,000 sf. DIRECT ABSORPTION improved remained in negative territory at just over 196,000 sf. While the western submarkets posted positive absorption this quarter of close to 59,000 sf, the eastern submarkets were at the other and was in minimal positive territory in Q4. However absorption may trend downwards in early 2011 as end of the spectrum at close to negative 47,000 sf. What is worth noting in the western 184,000 sf of additional space submarkets is that this figure is not representative of a significant increase in demand. The becomes available. increase in occupied space was not due to leasing activity but rather a change in the available CONSTRUCTION has commenced date of two spaces to early 2011. In the eastern submarkets the negative absorption figure on both a 22,000-sf design build and was largely the result of 58,000 sf coming on the market; which is the building that was an 86,000-sf speculative project both formerly occupied by NAV Canada and left vacant with their move to new facilities. OUTLOOK in the Kanata area that are slated for completion in summer 2011. OVERALL RENT VS. VACANCY RATE Looking ahead to 2011, vacancy is projected to rise to 7.5% as an additional 184,000 sf is set to come on the market over the first half of the year. Approximately 134,000 sf of that Rent Vac ancy $9 8% total is located within the western submarkets, with the two largest spaces combining for a total of 89,000 sf in Kanata. As has been the case for numerous quarters, vacancy within $8 6% the western submarkets, particularly Kanata, continues to be dragged down by large blocks psf/yr of high-tech related space becoming available which then proceed to languish on the market for extended periods of time due to low demand. Absorption may receive a boost $7 4% $6 2% later in 2011 as the 86,000 sf speculative project on the outskirts of Kanata is set to be completed; currently, approximately 14,000 sf of this project has been pre-leased. $5 0% 3Q09 4Q09 1Q10 2Q10 3Q10 4Q10 OTTAWA INDUSTRIAL REPORT 4Q10 1
- 2. WEST OTTAWA INDUSTRIAL REPORT 4Q10 Vacancy Rate vs. Overall Rental Overall Available Space vs. Leasing Activity Rent Vacancy Available Spac e Leasing Activity $10 10.0% 820 $9 8.0% 620 sf ( '00 0 ) psf/yr $8 6.0% 420 $7 4.0% 220 20 $6 2.0% 3Q09 4Q09 1Q10 2Q10 3Q10 4Q10 3Q09 4Q09 1Q10 2Q10 3Q10 4Q10 Vacancy declined for the first time this year, dropping to 8.8% The amount of available space located in the western submarkets from 9.5% last quarter. This decrease was the result of numerous decreased to approximately 728,000 sf this quarter, about 59,000 sf submarkets posting slight declines in their vacancy. lower than what was available during the third quarter. Asking average rental rates declined for the first time in 2010 to Leasing activity slowed over the fourth quarter to total close to now sit at $7.44 per square foot (psf). However, this dollar figure 32,000 sf, which brings the year-end total to just over 200,000 sf. is still higher than what was posted in the first quarter of this year. Although Kanata was very quiet this quarter, overall for the year it As was the case with vacancy, a handful of submarkets either had accounted for about half of all the leasing activity in the western unchanging rents or slightly declining rents which led to the submarkets. Only five submarkets reported activity this quarter, decrease in the overall average. with the largest amount seen in the Woodward/Carling area with one estimated transaction of approximately 11,000 sf. Available Space Trends Overall vs. Sublease Absorption Overall Sublease 150 800 100 650 s f (' 00 0) 500 50 sf ('0 00 ) 350 0 200 -50 50 -100 3Q09 4Q09 1Q10 2Q10 3Q10 4Q10 3Q09 4Q09 1Q10 2Q10 3Q10 4Q10 -150 The amount of sublet space in the western submarkets slightly Absorption levels in the western submarkets moved into positive increased this quarter to reach just over 171,000 sf. This change territory this quarter for the first time in a year at nearly 59,000 sf. was due to a 1,600-sf space becoming available in the West Although this improved the year-end amount, the total was still a Merivale Business Park. Otherwise, the space available for negative 146,000 sf. The increase in occupied space was due to sublease is exactly the same as the previous quarter. spaces being withdrawn from the market. Absorption levels are expected to trend downward over at least the first half of 2011, as close to 134,000 sf becomes available. The majority of this space is located in Kanata and, as has been the trend for this submarket for well over a year, is high-tech related. 2
- 3. EAST OTTAWA INDUSTRIAL REPORT 4Q10 Vacancy Rate vs. Overall Rental Overall Available Space vs. Leasing Activity Rent Vacancy Available Spac e Leasing Activity $9 6.0% 5.0% 750 $8 4.0% 600 sf ('0 00 ) ps f/yr $7 3.0% 450 2.0% 300 $6 1.0% 150 $5 0.0% 0 3Q09 4Q09 1Q10 2Q10 3Q10 4Q10 3Q09 4Q09 1Q10 2Q10 3Q10 4Q10 Vacancy continued its march upwards this quarter, increasing to The amount of vacant space available continued to climb this 5.3%, a four-tenths of a percentage point increase from the third quarter and is now at approximately 712,000 sf. Over the course of quarter. 2010 the amount of vacant space has risen by over 160,000 sf. Rental rates contracted slightly from last quarter to $7.93 psf. After a fairly active third quarter, leasing activity slowed to There were no dramatic changes in rents in the eastern submarkets approximately 76,000 sf. This brings the year-end total to 365,000 this quarter; rather there were just small decreases in numerous sf. Over the course of the year the Cyrville area was the most active submarkets plus the removal this quarter of a more expensive than in terms of square footage leased. The largest transaction for the average space. quarter was also located in this submarket with an estimated deal for 13,500 sf. Available Space Trends Overall vs. Sublease Absorption Overall Sublease 150 100 750 50 600 0 sf ('0 0 0) -50 sf ('0 0 0) 450 -100 300 -150 150 -200 0 -250 -300 3Q09 4Q09 1Q10 2Q10 3Q10 4Q10 3Q09 4Q09 1Q10 2Q10 3Q10 4Q10 The amount of sublet space decreased once again this quarter and Demand this quarter was lower than recent quarters, with is now at 20,000 sf, its lowest level in the past five quarters. absorption at approximately negative 47,000 sf. This significantly Currently, the space available for sublease is located in just one contributed to the year-end total of just over negative 50,000 sf. property in the Stevenage/Belgreen area and has been available for There were five pockets of negative absorption over 10,000 sf this well over a year. quarter with the largest about 58,000 sf. This space was vacated by NAV Canada as they moved to their new premises. It is anticipated that absorption into the first half of 2011 will be fairly minimal, either on the positive or the negative side. About 50,000 sf of additional space is set to come on the market in the next six months. However, demand should be sufficient to counteract that to a certain degree. 3
- 4. OTTAWA INDUSTRIAL REPORT 4Q10 MARKET/SUBMARKET STATISTICS Overall Direct EOY EOY EOY Average No. of Vacancy Vacancy Leasing Under Construction Overall Rental Market/Submarket Inventory Bldgs. Rate Rate Activity Construction Completions Absorption Rate West Ottawa Submarkets Kanata 3,176,784 53 14.2% 11.9% 105,461 108,752 0 (72,207) $7.00 Bell’s Corners 334,655 11 2.4% 2.4% 0 0 0 (2,700) N/A Morrison/Queensview 415,519 9 0.0% 0.0% 16,206 0 0 16,206 N/A Woodward/Carling 540,800 23 7.4% 7.4% 11,258 0 0 (1,122) $8.00 Ottawa Centre 755,339 26 2.6% 2.6% 11,600 0 0 8,295 $9.00 Ottawa South 695,111 11 12.2% 5.8% 4,500 0 0 (68,764) $6.53 West Merivale 534,593 26 2.1% 1.8% 9,095 0 0 (8,748) $8.63 East Merivale 587,403 26 7.6% 7.6% 1,800 0 0 (26,930) $9.27 Colonnade 621,923 21 10.0% 1.5% 33,666 0 0 9,990 $10.31 Rideau Heights 622,918 28 1.3% 1.3% 6,415 0 0 0 N/A East Ottawa Submarkets South Walkley 325,180 13 0.0% 0.0% 8,588 0 0 8,588 N/A Ottawa Business Park 1,439,259 31 1.7% 1.7% 39,440 0 0 (14,355) $7.50 Coventry/Belfast 1,835,250 50 1.6% 1.6% 53,463 0 0 20,989 $8.44 Cyrville 2,021,942 58 3.3% 3.3% 87,066 0 0 5,822 $8.12 Sheffield 3,186,043 61 9.3% 9.3% 45,085 0 0 (56,401) $7.24 Sheffield/Lancaster 1,170,820 20 4.6% 4.6% 23,240 0 0 (38,598) $9.23 Stevenage/Belgreen 1,854,224 52 4.6% 3.5% 35,866 0 0 3,406 $8.82 South Gloucester/Albion 409,334 16 5.6% 5.6% 10,139 0 0 (8,100) N/A Queensway 761,685 23 11.5% 11.5% 50,154 0 122,500 43,922 $8.02 Orleans 474,178 14 9.8% 9.8% 12,250 0 0 (15,300) $7.50 Total 21,762,960 572 6.6% 5.7% 565,292 108,752 122,500 (196,007) $7.75 *Rental rates reflect $psf/year MARKET HIGHLIGHTS SIGNIFICANT 4Q10 NEW LEASE TRANSACTIONS BUILDING SUBMARKET TENANT SQ FT BLDG CLASS 2700 Lancaster Road Sheffield/Lancaster Alpine Specialty Chemicals Ltd. 2,683 SIGNIFICANT 4Q10 SALE TRANSACTIONS BUILDING SUBMARKET BUYER SQ FT PURCHASE PRICE 2630 Sheffield Road Sheffield/Lancaster Richcraft Ltd. 47,321 $4,020,000 2370 Lancaster Road Sheffield/Lancaster Canada Post 25,935 $3,800,000 SIGNIFICANT 4Q10 CONSTRUCTION COMPLETIONS BUILDING SUBMARKET MAJOR TENANT SQ FT COMPLETION DATE N/A SIGNIFICANT PROJECTS UNDER CONSTRUCTION BUILDING SUBMARKET MAJOR TENANT SQ FT COMPLETION DATE 116 Willowlea Drive Kanata N/A 108,752 06/11 For industry-leading intelligence to support your real estate and This report contains information available to the public and has been relied upon by business decisions, go to Cushman & Wakefield’s Knowledge Cushman & Wakefield Ottawa on the basis that it is accurate and complete. Cushman & Wakefield Ottawa accepts no responsibility if this should prove not to be the case. No Center at www.cwottawa.com/knowledge warranty or representation, express or implied, is made to the accuracy or completeness of the information contained herein, and same is submitted subject to errors, omissions, Cushman & Wakefield Ottawa change of price, rental or other conditions, withdrawal without notice, and to any special 99 Bank Street Suite 700 listing conditions imposed by our principals. Ottawa, ON K1P 1B9 (613) 236-7777 ©2010 Cushman & Wakefield Ottawa All rights reserved.