
Empfohlen
Weitere ähnliche Inhalte
Was ist angesagt?
Was ist angesagt? (12)
Ähnlich wie "Climate Change, Sea Level Rise and Sustainable Communities: Defining the Challenge and the Opportunities" by Sacha Spector
Ähnlich wie "Climate Change, Sea Level Rise and Sustainable Communities: Defining the Challenge and the Opportunities" by Sacha Spector (20)
Mehr von scenichudson
Mehr von scenichudson (6)
Kürzlich hochgeladen
Kürzlich hochgeladen (20)
"Climate Change, Sea Level Rise and Sustainable Communities: Defining the Challenge and the Opportunities" by Sacha Spector
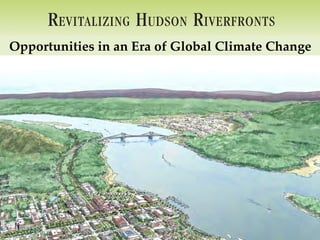
- 1. R EVITALIZING H UDSON R IVERFRONTS Illustrated Conservation & Development Strategies for Creating Healthy, Prosperous Communities Opportunities in an Era of Global Climate Change
- 2. Revitalizing Hudson Riverfronts Opportunity in an Era of Climate Change
- 3. what’s happening now 3-strategy roadmap co-benefits of action The Opportunity of a Lifetime
- 4. Indicators of a Warming World Glaciers Humidity Temperature Over Land Snow Cover Air Temperature Near Surface (troposphere) Temperature Over Oceans Tree-lines shifting poleward and upward Sea Surface Temperature Sea Level Spring coming earlier Ice Sheets Ocean Heat Content Species migrating poleward and upward Sea Ice
- 5. Indicators of a Warming World source: National Center for Atmospheric Research http://www2.ucar.edu/news/1036/record-high-temperatures-far-outpace-record-lows-across-us
- 6. Northeast annual avg. temp up 1.4°F since 1970 New York winter temperatures almost 5oF warmer than 30 years ago. Observed Changes in New York
- 7. 1990 USDA Hardiness Zones vs. 2006 Arborday.org Hardiness Zones differences reflect warmer climate Later frost in fall Earlier plant germination and blooms Earlier arrival of zone change migratory birds +2 +1 no change Timing of lake ice -1 -2 formation and melting 1990 2006 Changes in species ranges Changes in precipitation Observed Changes in New York
- 8. Return Period (Years) Return (Years) Years) Rainfall (in.) 110 5.55 105 5.50 • More precipitation 100 5.45 (slightly) 95 5.40 • More rain in winter 90 5.35 85 5.30 • Increasing extreme 80 5.25 storms (heavy rain 75 1961 1981 2001 2021 2041 2061 5.20 in a short period of time) Return Return Period in. per Y Equivalent to 1961-1990 100-year storm Number Events > 1 of Stormear Year Amount of 100-year storm 10 Observed • Summers warmer, 8 HADCM3 with drier soils and periodic drought 6 • Summer low 4 streamflow period 2 will be longer 1961 1981 2001 2021 2041 2061 2081 Year Year Observed Changes in New York
- 9. the imperative to facilitate the persistence of the tinue to provide ecological services that sustain optimal balance will require locally-specific tactics edge, and regional strategies that coordinate efforts mework. Hudson River Sea Level 1856-2009 Sea level is 1’ higher Sea Level a (in mm, observed at Manhattan) than 100 years ago Rise 500 Rate of sea level average = 2.79mm/yr by 2080 rise is accelerating 400 Lower emissions: 300 8-23 inches 200 Higher emissions: 100 source: NOAA 37-50 inches 0 1856 1881 1906 1931 1956 1981 2006 Figure 2. Sea level change since 1856, observed by tidal gauge at the Battery, Manhattan, NYC. er Sea Level Rise on the Hudson we can expect water levels on the Hudson River – ral Dam at Troy - to rise by up to five feet by the end
- 10. SAVING THE LAND THAT MATTERS MOST 2020 2050 2080 Hudson River Sea Level Rise Projections 1155 additional acres 2641 additional acres 4647 additional acres inundation zone > 5000 acres by Sea Level Rise on the Hudson 2080
- 11. The Hudson Valley: A Climate Crossroads
- 12. 160+ miles of estuarine river globally rare habitats 85% of NY’s vertebrate species global hotspots What’s at Stake? RamsHorn Marsh
- 13. 82 communities >250,000 people $Bs of infrastructure historic & cultural centers What’s at Stake?
- 14. underpinnings of local What’s at Stake? & regional economies
- 15. security resilience justice Sustainable Waterfront viable economies Communities healthy environments
- 16. Save taxpayer dollars Spur local economies and create millions of green jobs Improve public health Reduce risks to people and property Enhance national security Create a legacy of leadership and conservation ...and avert catastrophe. Opportunity
- 17. How Do We Plan Toward the Best of Both Worlds?
- 18. Restored Tributary SAV Preserved Ecologically Sensitive Area Diverse Housing Types, Sizes and Affordability 4 Wetland 4 Parking Garage and On-Street Parking Alley and Parking Behind Buildings 4 Local Street Along Greenways and Parks 4 4 Renovated Existing 4 4 Buildings 4 4 4 70-FOOT SETBACK In Built Riverfront Areas 4 4 4 Special Public Spaces Viewing Piers, Marinas 4 Tour Boat Facilities 4 4 4 4 4 Bioretention Areas Parking Lot Screening Restored Historic Building 100-YEAR FLOODPLAIN 100-FOOT SETBACK In Parks, Greenways, and Natural Areas 4 4 Plan by Raymond Curran 100” 200” 300” 400” 500” Mixed-Use Buildings Public Buildings Residential Buildings Resilient Soften and Protect Riverfront Restore Tidal Wetlands Communities Shorelines and Floodplains
- 19. R EVITALIZING H UDSON R IVERFRONTS Illustrated Conservation & Development Strategies for Creating Healthy, Prosperous Communities www.revitalizinghudonsriverfronts.org
- 20. Restored Tributary SAV Preserved Ecologically Sensitive Area Diverse Housing Types, • Identify built and natural assets Sizes and Affordability 4 Wetland 4 Parking Garage and On-Street Parking Alley and Parking at risk Behind Buildings • Steer development away from 4 Local Street Along Greenways and Parks 4 4 Renovated Existing shorelines and floodplains 4 4 Buildings 4 4 4 • Site new infrastructure out of 70-FOOT SETBACK In Built Riverfront Areas 4 the 500+ year floodplain 4 4 Special Public Spaces Viewing Piers, Marinas 4 Tour Boat Facilities 4 4 • New structures elevated or 4 resilient 4 4 Bioretention Areas • Employ softer, greener Parking Lot Screening shoreline treatments where Restored Historic Building 100-YEAR FLOODPLAIN appropriate 100-FOOT SETBACK In Parks, Greenways, and Natural Areas 4 4 Plan by Raymond Curran 100” 200” 300” 400” 500” Mixed-Use Buildings Public Buildings Residential Buildings
- 21. Four Basic Typologies Natural Area The Riverfront Greenway Community Park RFRONT 100 / 100 rule OR This mostly vegetated -looking steps waterfront ish a riverfront greenway corridor corridor should extend inland reenway corridor serves as continuous, hat provides public access, recreation, Built Riverfront to the 100-year floodplain conditions allow, this mostly vegetated he 100-year floodplain boundary OR boundary OR 100 feet from ter line, whichever is GREATER. the mean high-water line, s can be thought of as falling into four whichever is GREATER. ost urban form of the riverfront ctions as a direct extension of the Linear Riverfront r municipal center. It provides public Park should include lively, mixed-use, estinations drawing upon local cultural, tal assets. Long, narrow public areas within the
- 22. A Gradient of Riverfront Communities
- 23. d T k 3 Identify Resources, Risks, and Vulnerability: v y Cornwall’s Waterfront r on Sea Level Rise Sea-Level Habitats Ramshorn Marsh photo: Jeffery Anzevino
- 25. Inunda&on Zone
- 26. Inunda&on Zone Tidal Wetland
- 27. Inunda&on Zone Tidal Wetland Hardened Shoreline ^^^ Natural Shoreline
- 28. Inunda&on Zone Tidal Wetland Hardened Shoreline ^^^ Natural Shoreline Inundated Infrastructure ROW
- 29. v T 3 r yv d k Inunda&on Zone Tidal Wetland j Hardened Shoreline ^^^ Natural Shoreline y Inundated Infrastructure ROW
- 30. Soften and Restore Shorelines
- 31. Dead stout stake to secure geotextile fabric * Not to scale Eroded streambank Install additional vegetation like live stakes, rooted seedlings, etc. Compacted soil about 1-foot thick Live cuttings Geotextile fabric Height varies: 8-feet max. High tide Low tide Streambed Rock fill 2 to 3 ft. NOTE: Rooted/leafed condition Esopus Meadows Watertrail Preserve, Esopus of living plant material does not 3 to 4 f represent time of installation. eet Geotextile fabric recommended High tide Low tide Streambed Dead stout stake used to secure geotextile fabric Riprap Live stakes Foundry Dock Park, Cold Spring
- 32. Existing vegetation, plantings or soil bioengineering systems Live branch cuttings (1/2 to 1 inch diameter) Erosion control High tide fabric Low tide Compacted fill material Streambed 2 to 3 feet Geotextile fabric Gabion baskets NOTE: Rooted/leafed condition of living plant material does not represent time of installation. * Not to scale
- 33. Protect Tidal and Supratidal Habitats Ramshorn Marsh
- 34. Restore Tidal and Supratidal Habitats Hudson South Bay
- 35. Current Legend Tidal Wetlands Non-Tidal Wetlands NHP Occurrences
- 36. 2020 Legend Tidal Wetlands Non-Tidal Wetlands NHP Occurrences
- 37. 2050 Legend Tidal Wetlands Non-Tidal Wetlands NHP Occurrences
- 38. 2080 Legend Tidal Wetlands Non-Tidal Wetlands NHP Occurrences