Soliculture NSF Final Presentation
•Als PPTX, PDF herunterladen•
2 gefällt mir•1,794 views


Empfohlen
Weitere ähnliche Inhalte
Ähnlich wie Soliculture NSF Final Presentation
Ähnlich wie Soliculture NSF Final Presentation (17)
Mehr von Stanford University
Mehr von Stanford University (20)
Kürzlich hochgeladen
Kürzlich hochgeladen (20)
Soliculture NSF Final Presentation
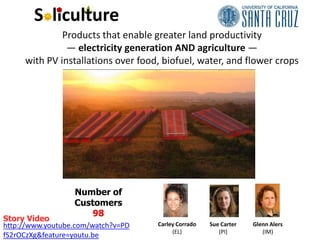
- 1. S liculture Products that enable greater land productivity — electricity generation AND agriculture — with PV installations over food, biofuel, water, and flower crops Number of Customers 98 Story Video http://www.youtube.com/watch?v=PD Carley Corrado Sue Carter Glenn Alers (EL) (PI) (IM) fS2rOCzXg&feature=youtu.be
- 2. Soliculture – Initial Canvas Product Design Greenhouse Growers Manufacturing Personal Assistance Sales Channels Increased Profits Farmers Sales & Marketing Communities Material Suppliers Cost Reduction Utilities Installations Technical support Greater Productivity Governments Contract Manufacturers Reduce Risk Installers Growers Custom Design Intellectual Property Improve Branding Employee Expertise Direct Sales Facilities Partner Sales Material Expenses Product Sales Contract Manufacturing Product Leasing Fixed Costs Service Contracts
- 3. screen, use the "Print" link next to the map. To see all the details that are visible on the screen, use the "Print" link next to the map. Soliculture Customer Discovery: Face to face Shafer ZD Wines Belmont Houweling Rieter Grolink Jacobs Farm Floranova PP& Windset Suncrest Everbloom Colorama Nurserymans Ocean Breeze KB Farms Four Winds Maximum Sun Valley Group Eurofloria Altman Rocket Farms Westerlay Paul Ecke Ranch Matsui Green Valley Floricultura Customer Discovery by Phone: Kula Dave’s Tomatoes, Greenheart Farms, Village Farms, Abalone Farm, Sun Valley Group (Arcata), Green Fields Forever, Takao Nurseries, Speedling,©2012 TerraMetrics, Hilo Orchid Farm, - Imagery Colorspot, Map data ©2012 Google, INEGI Hawaiin Orchid Nursery, Aikane Nursery, Monsanto, Hollandia, Plant It Hawaii
- 4. What some of our Customers are Telling Us Annual Desired Pay Company Main Crop Electricity $ Back years Comments Four Winds citrus $6000 5 Trial at UCSC, New Shafer & ZD Wines grapes ~$50,000 4 to 20 New Sun Valley Group Variety/Gerbera $200,000 5 Trial, Retrofit Everbloom Berbera $34,000 5 Trial, Retrofit Houweling tomatoes $400,000 10 Trial, Retrofit Reiter Berries Unknown 3 to 5 Trial, New Grolink Pointsettas $100,000 5 Trial, Retrofit Altman Plants variety Unknown 3 Trial at Non-Profit Paul Ecke Ranch Pointsettas Unknown <7 Retrofit Belmont Nursery variety $50,000 4 to 8 years Retrofit Jacobs Farm herbs $50,000 3 to 5 Trial, Retrofit Green Valley roses $150,000 <5 years Retrofit Windset Farms tomatoes Unknown 6 max Retrofit + New Floricultura Orchid media $34,000 5 Retrofit KB Farms Cut flowers Unknown 5 Trial, Retrofit Rocket Farms diverse $400,000 5 Trial, Retrofit Nurseyman Exch flowers $1,000,000 5 Trial, Retrofit Majority of customers are telling us: 5-year payback, retrofit, and data on how panels impact their plants will be required prior to purchasing.
- 5. Nurseryman’s Exchange Lighting for mini roses: 100 W/m2 $1 million/year Electricity Bill “It should be illegal how much electricity we use.”
- 6. Soliculture – iteration Product Design Greenhouse Growers Material Suppliers Manufacturing Lower-cost clean Personal Assistance Electricity Farmers Contract Sales & Marketing Communities Manufacturers Increased Profits Utilities Installations Technical support Greater Productivity Governments Growers Theft/Vandalism Partner Sales Installers Governments protection Intellectual Property GH Manufacturers Reduce Risk Ag Distributors Employee Expertise PV Installers Custom Design Ag/PV Financers Facilities Plant Trial Data Improve Branding Direct Sales Material Expenses Product Sales Contract Manufacturing Product Leasing Product Trial Installations Service Contracts
- 7. World Map of our Customers US Average CA #1 $0.10 kWh $0.12 kWh TX #3 $0.05 kWh FL #2 $0.05 kWh Hawaii $0.23 kWh Japan US Europe $0.42 kWh $0.10 kWh $0.20 kWh - 50,000 hectares 5,000 hectares $0.40 kWh >100,000 hectares
- 8. Putting Numbers to the Value Propositions We have two main customers: 1) Growers who want to zero out their power bills (Net-metering). 2) Growers who want to make money from their land through power-purchase (Feed-in Tariff). Pay Back Installed 30% ITC + Net System Annual Annual Pay Back Average years Power Type System other install cost Electric Deprec years $/kW-hr 2 incentives $/m2 2 2 +$5/m2 Cost $/m $/m $/m (PV Only) crops PG&E Net- metering 0.12 100 40 60 11 3 4.3 3.2 Hawaii Net- meter/FIT 0.25 110 36 74 23 4 2.7 2.3 PG&E Feed- in Tariff 0.10 80 34 46 9 2 4.2 NA Japan Feed- in Tariff 0.42 120 NA 120 29 NA 4.1 3.5 Higher prices in Hawaii/Japan represent higher transport and channel costs. Even with <5 year pay-back, upfront costs are high ($200,000 for a 100 kW system). Some growers can’t afford this unless we provide financing or leasing options.
- 9. Soliculture Payment Flow Nursery Farmers $80 to $120/m2 Wholesalers $100 to $200/m2 Cost of partner channels Agriculture may be too high for most US Greenhouse Suppliers markets to meet value v Manufacturers 10% to 25% cut 10 to 25% cut proposition and assure profit. PV financers will Installation of panels Soliculture: Solar Solutions for Ag Industry allow us to sell Product Cost: <$1.6/W installed ($64 to $160/m2) product to will largely be done Selling Price: $2.0/W installed ($80 to $200/m2) growers who by growers, eliminating this cost. can’t afford high upfront payment Electronics Supply Contract Materials Suppliers Financers + Install Labor Manufacturer $28 to $74/m2 $1 to $5/m2 $10 to $35/m2 $5 to $40/m2
- 10. Soliculture Final Product Design Greenhouse Growers Material Suppliers Manufacturing Lower-cost Personal Assistance Electricity Farmers Contract Sales & Marketing Communities Manufacturers Increased Profits Utilities Installations Technical support Greater Productivity Growers Theft/Vandalism Direct Sales (retrofit Financers protection & US) Intellectual Property Employee Expertise Partner Sales Governments & (new & International) Solar Lobby Groups Facilities GH Manufacturers Ag Distributors Plant Trial Data Ag/PV Financers PV Installers Material Expenses Product Sales Contract Manufacturing Product Leasing Product Trial Installations Service Contracts
- 11. Soliculture Market Size1,2,3 Annual TAM (in billions) Annual Target (in millions) 0.3B US Greenhouse 15M 10B 100M US Crop Covers Japan Greenhouse 30B 10B 300M 100M Europe Greenhouse 1Farm and Ranch Irrigation Survey (2003), USDA, Issued November 2004 2Existing Greenhouse area in m2 * $120/m2 (Europe and Japan) 3Does not include China, South Korea, Australia, Africa, Middle East, Canada, Russia, India, South America or large Solar Power Plant installations
- 12. S liculture Soliculture’s price: $2/W installed Competitor’s price: >$3/W installed Lower costs achieved through free land, free frame, free glass, replacing expensive PV and installation labor