
Empfohlen
Weitere ähnliche Inhalte
Was ist angesagt?
Was ist angesagt? (18)
Andere mochten auch
Ähnlich wie May2011 stats 3 to8
Ähnlich wie May2011 stats 3 to8 (16)
Kürzlich hochgeladen
Kürzlich hochgeladen (20)
May2011 stats 3 to8
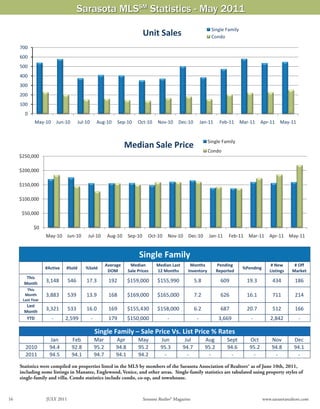
- 1. Sarasota MLSSM Statistics - May 2011 Single Family Unit Sales Condo 700 600 500 400 300 200 100 0 May‐10 Jun‐10 Jul‐10 Aug‐10 Sep‐10 Oct‐10 Nov‐10 Dec‐10 Jan‐11 Feb‐11 Mar‐11 Apr‐11 May‐11 Single Family Median Sale Price Condo $250,000 $200,000 $150,000 $100,000 $50,000 $0 May‐10 Jun‐10 Jul‐10 Aug‐10 Sep‐10 Oct‐10 Nov‐10 Dec‐10 Jan‐11 Feb‐11 Mar‐11 Apr‐11 May‐11 Single Family Average Median Median Last Months Pending # New # Off #Active #Sold %Sold %Pending DOM Sale Prices 12 Months Inventory Reported Listings Market This Month 3,148 546 17.3 192 $159,000 $155,990 5.8 609 19.3 434 186 This Month 3,883 539 13.9 168 $169,000 $165,000 7.2 626 16.1 711 214 Last Year Last Month 3,321 533 16.0 169 $155,430 $158,000 6.2 687 20.7 512 166 YTD ‐ 2,599 ‐ 179 $150,000 ‐ ‐ 3,669 ‐ 2,842 ‐ Single Family – Sale Price Vs. List Price % Rates Jan Feb Mar Apr May Jun Jul Aug Sept Oct Nov Dec 2010 94.4 92.8 95.2 94.8 95.2 95.3 94.7 95.2 94.6 95.2 94.8 94.1 2011 94.5 94.1 94.7 94.1 94.2 ‐ ‐ ‐ ‐ ‐ ‐ ‐ Statistics were compiled on properties listed in the MLS by members of the Sarasota Association of Realtors® as of June 10th, 2011, including some listings in Manatee, Englewood, Venice, and other areas. Single-family statistics are tabulated using property styles of single-family and villa. Condo statistics include condo, co-op, and townhouse. Source: Sarasota Association of Realtors® 16 JULY 2011 Sarasota Realtor® Magazine www.sarasotarealtors.com
- 2. Sarasota MLSSM Statistics - May 2011 Single Family Inventory Condo 5,000 4,000 3,000 2,000 1,000 0 May‐10 Jun‐10 Jul‐10 Aug‐10 Sep‐10 Oct‐10 Nov‐10 Dec‐10 Jan‐11 Feb‐11 Mar‐11 Apr‐11 May‐11 Single Family Pending Sales Condo 1000 900 800 700 600 500 400 300 200 100 0 May‐10 Jun‐10 Jul‐10 Aug‐10 Sep‐10 Oct‐10 Nov‐10 Dec‐10 Jan‐11 Feb‐11 Mar‐11 Apr‐11 May‐11 Condo Average Median Sale Median Last Months of Pending # New # Off #Active #Sold %Sold %Pending DOM Prices 12 Months Inventory Reported Listings Market This Month 1,862 250 13.4 228 $218,750 $160,000 7.4 232 12.4 212 211 This Month 2,211 227 10.3 213 $184,500 $192,000 9.7 231 10.4 298 209 Last Year Last Month 1,937 226 11.7 230 $185,500 $160,000 8.6 272 14.0 224 197 YTD ‐ 1,076 ‐ 214 $170,000 ‐ ‐ 1,275 ‐ 1,362 ‐ Condo – Sale Price Vs. List Price % Rates Jan Feb Mar Apr May Jun Jul Aug Sept Oct Nov Dec 2010 92.5 92.4 92.5 93.2 94.2 93.7 94.2 93.5 93.2 94.3 94.5 92.9 2011 93.4 91.2 92.2 93.4 94.5 ‐ ‐ ‐ ‐ ‐ ‐ ‐ Median sales price is the middle value, where half of the homes sold for more, and half sold for less. Listings sold were closed transac- tions during the month. Pending sales are sales where an offer has been accepted during the month, but the sale has not yet closed. Even though some pending sales never close, pending sales are an indicator of current buyer activity. DOM indicates the average number of days that sold properties were on the market before a contract was executed. Sarasota Association of Realtors® MLS www.sarasotarealtors.com Sarasota Realtor® Magazine JULY 2011 17
- 3. Single Family Days on Market The Xtra Pages - Digital Version Only Condo 250 200 150 100 50 0 May‐10 Jun‐10 Jul‐10 Aug‐10 Sep‐10 Oct‐10 Nov‐10 Dec‐10 Jan‐11 Feb‐11 Mar‐11 Apr‐11 May‐11 Single Family New Listings Condo 900 800 700 600 500 400 300 200 100 0 May‐10 Jun‐10 Jul‐10 Aug‐10 Sep‐10 Oct‐10 Nov‐10 Dec‐10 Jan‐11 Feb‐11 Mar‐11 Apr‐11 May‐11 Single Family Months of Inventory Condo 18.0 16.0 14.0 12.0 10.0 8.0 6.0 4.0 2.0 0.0 May‐10 Jun‐10 Jul‐10 Aug‐10 Sep‐10 Oct‐10 Nov‐10 Dec‐10 Jan‐11 Feb‐11 Mar‐11 Apr‐11 May‐11 Single Family Sales Volume Condo $200,000,000 $180,000,000 $160,000,000 $140,000,000 $120,000,000 $100,000,000 Sarasota Association of Realtors® MLS $80,000,000 $60,000,000 $40,000,000 $20,000,000 $0 May‐10 Jun‐10 Jul‐10 Aug‐10 Sep‐10 Oct‐10 Nov‐10 Dec‐10 Jan‐11 Feb‐11 Mar‐11 Apr‐11 May‐11
- 4. First Quarter 2011 Report Single Family Sales ‐ By Quarter REO Short Arm's Length 1000 800 600 400 200 0 2008‐Q3 2008‐Q4 2009‐Q1 2009‐Q2 2009‐Q3 2009‐Q4 2010‐Q1 2010‐Q2 2010‐Q3 2010‐Q4 2011‐Q1 * Homebuyer Tax Credit In Effect Condo Sales ‐ By Quarter REO Short Arm's Length 500 400 300 200 100 0 2008‐Q3 2008‐Q4 2009‐Q1 2009‐Q2 2009‐Q3 2009‐Q4 2010‐Q1 2010‐Q2 2010‐Q3 2010‐Q4 2011‐Q1 * Homebuyer Tax Credit In Effect Single Family Median Sale Price REO Short Arm's Length $300,000 $250,000 $200,000 $150,000 $100,000 $50,000 $0 2008‐3rdQ 2008‐4thQ 2009‐1stQ 2009‐2ndQ 2009‐3rdQ 2009‐4thQ 2010‐Q1 2010‐Q2 2010‐Q3 2010‐Q4 2011‐Q1 Condo Median Sale Price REO Short Arm's Length $350,000 $300,000 $250,000 $200,000 $150,000 $100,000 Source: Sarasota Association of Realtors® $50,000 $0 2008‐3rdQ 2008‐4thQ 2009‐1stQ 2009‐2ndQ 2009‐3rdQ 2009‐4thQ 2010‐Q1 2010‐Q2 2010‐Q3 2010‐Q4 2011‐Q1
- 5. Single Family REO Sales ‐ By Quarter Condo 600 500 400 300 200 100 0 2008‐Q1 2008‐Q2 2008‐Q3 2008‐Q4 2009‐Q1 2009‐Q2 2009‐Q3 2009‐Q4 2010‐Q1 2010‐Q2 2010‐Q3 2010‐Q4 2011‐Q1 * Homebuyer Tax Credit In Effect Single Family Short Sales ‐ By Quarter Condo 400 350 300 250 200 150 100 50 0 2008‐Q3 2008‐Q4 2009‐Q1 2009‐Q2 2009‐Q3 2009‐Q4 2010‐Q1 2010‐Q2 2010‐Q3 2010‐Q4 2011‐Q1 * Homebuyer Tax Credit In Effect Single Family Arm's Length Sales ‐ By Quarter Condo 1000 800 600 400 200 0 2008‐Q3 2008‐Q4 2009‐Q1 2009‐Q2 2009‐Q3 2009‐Q4 2010‐Q1 2010‐Q2 2010‐Q3 2010‐Q4 2011‐Q1 * Homebuyer Tax Credit In Effect Source: Sarasota Association of Realtors®
- 6. Annual Sales ‐ 2000 to 2010 Single Family Single Family Condo Total 11267 10562 9697 8167 7,596 7603 7036 6,841 6533 6739 6,504 6 504 6358 6042 5820 5,603 5,466 5,183 4,940 4,626 4,349 4,353 3,721 3 721 3,922 , 3,671 3 671 3,193 2,564 2,184 2,096 2,005 2,120 2,137 1,556 1,194 2000 2001 2002 2003 2004 2005 2006 2007 2008 2009 2010 Annual Median Sale Price ‐ 2000 to 2010 Condo Single Family $351,000 $342,000 $336,250 $320,000 $272,500 $301,225 $305,000 $226,000 $225,000 $303,000 $191,000 $210,000 $172,500 $191,000 $230,000 $163,000 $142,000 $173,000 $145,000 $160,000 $163,000 $132,300 2000 2001 2002 2003 2004 2005 2006 2007 2008 2009 2010