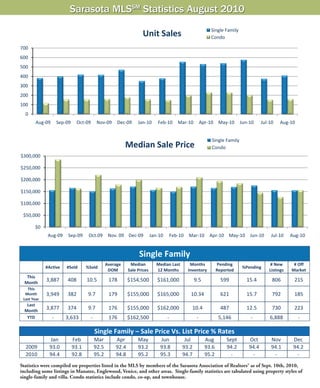
Sales of property in the Sarasota real estate market rebounded in August 2010 after dipping in July following the expiration of a federal homebuyer incentive. Sales were up 8% from July and 14.3% from August 2009. The median sales price for single family homes was steady at $154,500, similar to the previous month. Condo median prices rose 22% to $155,000. Pending sales also increased 25% over July, indicating increased buyer activity in the fall market.
M3M 129 E Brochure Noida Expressway, Sector 129, Noida
August2010 stats
1. For Immediate Release
Sarasota Association of Realtors®
Sept. 13, 2010
For more information contact Kathy Roberts, 941-328-1170
August property sales up; prices remain stable
The Sarasota real estate market rebounded in August 2010 after an expected slower July,
following the expiration of the federal $8,000 homebuyer incentive. Sales were up 8 percent over
July 2010, and up 14.3 percent over August 2009.
Property sales in August 2010 stood at 567 total sales. This compared to 525 sales in July 2010
and 496 sales in August 2009.
There were 408 single family home sales in August, with the median price at $154,500, almost
identical to last month’s figure of $155,000. The median price was also $155,000 in August
2009, and has been steady throughout the last 12 months ($161,000), fluctuating between a high
of $170,000 and a low of $150,000.
Condos saw 159 sales in August, with the median price rising by 22 percent to $155,000 from
last month’s figure of $127,000. For the last 12 months combined, the median sale price for
condos was $169,900. Distressed condo sales have dragged the overall median price down
substantially, with normal arm’s length sales garnering three-times as much as bank-owned
properties, and twice as much as short sales on average.
Pending sales also rose in August to 816, from last month’s figure of 653, for a 25 percent
increase. The rise bodes well for closings in the early fall months.
“It was very encouraging to see that the market recovered nicely after a drop in sales from June
to July,” said 2010 SAR President Erick Shumway. “After experiencing a five-year high in sales
for the second quarter, everyone knew the loss of the homebuyer tax credit would have a
negative impact. But we saw a big jump in sales for August, and prices held steady, so this
market still has legs and the recovery appears to be a healthy one.”
The level of sales of distressed properties (foreclosures and short sales) dropped in August 2010
to 47 percent from last month’s figure of 48.7 percent of the overall market. Distressed market
sales were at a high in late 2009, and have hovered in the range between 44 and 48 percent since
that time.
2. The property inventory level remained fairly consistent, remaining just over the 6,000 level in
August 2010, which remains one of the lowest monthly levels since late summer of 2005.
The months of inventory for single family homes in August 2010 dropped to 9.5 months from
10.4 months in July. The figure was 10.3 months in August 2009. This figure represents the
number of months it would take to sell all available homes at the current pace. For condos, the
figure dropped to 13.5 months from 14.4 months in July 2010. It was substantially lower than the
August 2009 figure of 20.5 months. Once the market reaches the 6 month level it is considered to
be in equilibrium between a buyers and sellers market.
###
3. Sarasota MLSSM Statistics August 2010
Single Family
Unit Sales Condo
700
600
500
400
300
200
100
0
Aug‐09 Sep‐09 Oct‐09 Nov‐09 Dec‐09 Jan‐10 Feb‐10 Mar‐10 Apr‐10 May‐10 Jun‐10 Jul‐10 Aug‐10
Single Family
Median Sale Price Condo
$300,000
$250,000
$200,000
$150,000
$100,000
$50,000
$0
Aug‐09 Sep‐09 Oct.09 Nov. 09 Dec‐09 Jan‐10 Feb‐10 Mar‐10 Apr‐10 May‐10 Jun‐10 Jul‐10 Aug‐10
Single Family
Average Median Median Last Months Pending # New # Off
#Active #Sold %Sold %Pending
DOM Sale Prices 12 Months Inventory Reported Listings Market
This
Month
3,887 408 10.5 178 $154,500 $161,000 9.5 599 15.4 806 215
This
Month 3,949 382 9.7 179 $155,000 $165,000 10.34 621 15.7 792 185
Last Year
Last
Month
3,877 374 9.7 176 $155,000 $162,000 10.4 487 12.5 730 223
YTD ‐ 3,633 ‐ 176 $162,500 ‐ ‐ 5,146 ‐ 6,888 ‐
Single Family – Sale Price Vs. List Price % Rates
Jan Feb Mar Apr May Jun Jul Aug Sept Oct Nov Dec
2009 93.0 93.1 92.5 92.4 93.2 93.8 93.2 93.6 94.2 94.4 94.1 94.2
2010 94.4 92.8 95.2 94.8 95.2 95.3 94.7 95.2 ‐ ‐ ‐ ‐
Statistics were compiled on properties listed in the MLS by members of the Sarasota Association of Realtors® as of Sept. 10th, 2010,
including some listings in Manatee, Englewood, Venice, and other areas. Single-family statistics are tabulated using property styles of
single-family and villa. Condo statistics include condo, co-op, and townhouse.
4. Sarasota MLSSM Statistics August 2010
Single Family
Inventory Condo
5,000
4,000
3,000
2,000
1,000
0
Aug‐09 Sep‐09 Oct‐09 Nov‐09 Dec‐09 Jan‐10 Feb‐10 Mar‐10 Apr‐10 May‐10 Jun‐10 Jul‐10 Aug‐10
Single Family
Pending Sales Condo
900
800
700
600
500
400
300
200
100
0
Aug‐09 Sep‐09 Oct‐09 Nov‐09 Dec‐09 Jan‐10 Feb‐10 Mar‐10 Apr‐10 May‐10 Jun‐10 Jul‐10 Aug‐10
Condo
Average Median Sale Median Last Months of Pending # New # Off
#Active #Sold %Sold %Pending
DOM Prices 12 Months Inventory Reported Listings Market
This
Month
2,152 159 7.4 193 $155,000 $169,900 13.5 217 10.1 254 169
This
Month 2,343 114 4.9 230 $285,000 $200,000 20.5 209 8.9 203 257
Last Year
Last
Month
2,177 151 6.9 203 $127,000 $175,000 14.4 166 7.6 261 189
YTD ‐ 1,467 ‐ 204 $166,000 ‐ ‐ 1,980 ‐ 2,516 ‐
Condo – Sale Price Vs. List Price % Rates
Jan Feb Mar Apr May Jun Jul Aug Sept Oct Nov Dec
2009 91.0 90.2 90.4 92.2 90.1 91.4 92.1 92.4 91.5 92.4 92.3 93.1
2010 92.5 92.4 92.5 93.2 94.2 93.7 94.2 93.5 ‐ ‐ ‐ ‐
Median sales price is the middle value, where half of the homes sold for more, and half sold for less. Listings sold were closed transac-
tions during the month. Pending sales are sales where an offer has been accepted during the month, but the sale has not yet closed. Even
though some pending sales never close, pending sales are an indicator of current buyer activity. DOM indicates the average number of
days that sold properties were on the market before a contract was executed.