SlideShare ist ein Scribd-Unternehmen logo
1 von 14
Arlene Yu, LIS 697-06 , Fall 2009


                           The New York Public Library

                           Mapping New York’s Shoreline, 1609-2009:
                           Celebrating the Quadricentennial of Henry Hudson’s Exploration
                           of the Waterways of New York

                                                                                                                   1    Boundary line
                                                                                                                   2    Cartographer
                                                                                                                   3    Cartouche
                                                                                                                   4    Coat of arms
                                                             12                                                    5    Compass rose
                                                                                                                   6    Fleur de lys
                                                                                                                   7    Inset
                                                                                                                   8    Latitude
                                                                                              13                   9    Longitude
                                                                  1
                                                                                                                  10 Map grid

                                                                                                                  11 Panoramic view

                                                                                                                  12 Pictorial relief
                                                                                                   8              13 Rhumb lines

                                                                                                                  14 Title
                                                                      4

                                                         3                                               10
                                                                              14
                                      6        5

                                                                          2               7


                                                                                     11

                       9


Maps blend art and science and sometimes, propaganda                                                          The Exhibition
                                                                                                               (visit these sections)

Maps are abstract graphic representations of the real or imagined world. Mapmaking, or
cartography, involves the art of designing these graphics as well as the science of making             From the Netherlands to
                                                                                                                                            1
them accurate. Mapmakers, who are called cartographers, select and show the only                       Nieuw Nederland
information they think is important to fulfill the purpose of the map they are making.
                                                                                                       Exploration & Colonialism           2
Although there is some information on the inland areas of the map, notice how much
more detail there is in the coastal areas and along the rivers. The cartographer probably              The Great Port                      3
derived a lot of his information from nautical charts, which were designed to help sailors
navigate. The map is also a political map, showing the boundaries between the Dutch
                                                                                                       The Greater Harbor                  4
colonies (in yellow) and the British (in pink). The map is also political in the sense that
cartography at the time was dominated by the Dutch, and the Dutch cartographer,
Nicolaes Visscher, exaggerated the size and importance of the Dutch areas (Novi Belgii).               The Hudson River                    5

                                                                                                       Environmental Issues &
A glossary of map terms, some of which are identified on the map above, is on page 2.                                                      6
                                                                                                       The Future of the Harbor

                                                                                                                                        Page 1
A brief glossary of maps and mapmaking
Aerial view. A perspective from directly above a site looking down, so that only tops of buildings and objects are shown.
Atlas. A collection of maps or charts bound together into a book.
Bird's eye view. A perspective from above, but at an angle, so that tops and sides of buildings and objects are shown in a three-
dimensional view. See also Panoramic view.
Cartouche. A scroll or panel used on many globes and maps to give the title of the object and often the name of the maker.
Cartouches were also used to fill up empty space or distract the viewer's attention from missing geographical data.
Cartographer. A map maker. On this chart, the cartographer is Gerard van Keulen.
Cartography. The art and science of making maps.
Chart. A detailed map of seas and coasts, designed for sailors.
Coat of arms. A decorative heraldic badge usually centered on the shape of a shield, used on flags, battle dress, house fronts and
so on to show that they belonged to a particular family, clan or nation.
Compass. A device for determining direction, which consists of a magnetized needle that pivots and points to magnetic north.
Compass rose or wind rose. A drawing of a compass on a chart which usually shows either 16 or 32 compass points, showing
courses to sail. Wind roses showed the directions of the eight named winds in early charts. The fleur-de-lys symbols at the top of
the compass roses on this chart indicate north.
Contour line. An imaginary line on the ground which connects points of the same altitude. Used to show relief.
Equator. An imaginary line drawn around the Earth, midway between the North and South Poles.
Fleur de lys. A representation of a lily flower with three distinct petals, the old symbol of France. The fleur de lys is used to
symbolize north because it is shaped like a “T,” which stands for the old name of the North Wind, the Tramontana.
Hachure. A series of lines used on a map to indicate the general direction and steepness of slopes. Hachures are drawn in the
direction of slopes. Compare to pictorial relief and contour line.
Inset. Small image within the border of a larger map.
Key. A list or chart that explains the symbols on a map or chart.
Latitude. Distance north or south of the Equator (latitude 0°)on the surface of the Earth, measured in degrees (angles) relative to
the earth’s center. Latitude gets higher (bigger) as you go north or south.
Longitude. Distance east or west from a known position (meridian) on the surface of the Earth, measured in degrees relative to
the earth’s center. Today the Prime Meridian (longitude 0°) from which longitude is measured is at Greenwich, England. In the
past, the Prime Meridian has been located in many places, including Paris and the Canary Islands.
Map. An abstract graphic representation of the real or imagined world, using points, lines, and areas that vary in size, shape,
value, texture or pattern, color, and orientation.
Map grid. A network of horizontal and vertical lines, uniformly spaced, used to locate points on a map.
Map projection. A method of representing the earth's three-dimensional surface as a flat two-dimensional surface. One of the
most famous projections is the Mercator projection.
Panoramic view. A bird's eye view, usually of a wide area.
Pictorial relief. Elevations of the land shown through stylized drawings of hills and forests.
Political map. A map showing where one country, region, state, or city ends and another begins.
Portolan. An early type of sea chart from the Mediterranean Sea, featuring wind roses or compass roses, and rhumb lines.
Prime Meridian. An imaginary line drawn from the North to the South Pole which determines 0° longitude.
Relief. Elevations and depressions of the land or sea bottom.
Rhumb lines. The lines of compass headings extended from compass roses.
Scale. Relationship existing between a distance on a map, chart, or photograph and the corresponding distance on the Earth.
Vellum. A map material made from sheepskin. It is tough and survived well at sea, so it was often used for charts.

Page 2
The cartographer defines the world we see
Walk through sections 1 and 2 of the exhibit. In each section, pick one map and analyze it using the worksheets.
Do not analyze the map shown on page 1 of this booklet.

Section 1. From the Netherlands to Nieuw Nederland

1.   What map elements or features do you see?

             rhumb lines                                   coat of arms
             latitude                                      colored areas
             longitude
             compass rose(s)                               advertising (describe)
             fleur-de-lys
             relief (pictorial, contour lines, hachures)
             water depths (“soundings”)
             rivers
             scale                                         decorations in seas or land masses (describe)
             cartouche
             inset
             cartographer
             date
             political boundaries                          decorative border (describe)
             railroad lines
             roads/trails
             panoramic view


2. Which way is north?


3. Who created this map?


4. When was it created?


5. Was any of it made by hand (drawn, engraved, colored)?


6. If you can find them, list some place names on the map that are used today that were originally

     Dutch

     English

     Native American


                                                                                                             Page 3
Section 1. From the Netherlands to Nieuw Nederland (continued)


 What is the map's purpose?


 What things on the map (or left off of it) show the map's purpose?


 What things on the map (or left off of it) show what people knew and didn't know?


 How does the map compare to a current map of the same place? What's different and what's the same?


 Write a question for the cartographer about something the map leaves out


Page 4
Section 2. Exploration & Colonialism


1.   What map elements or features do you see?

             rhumb lines                                   coat of arms
             latitude                                      colored areas
             longitude
             compass rose(s)                               advertising (describe)
             fleur-de-lys
             relief (pictorial, contour lines, hachures)
             water depths (“soundings”)
             rivers
             scale                                         decorations in seas or land masses (describe)
             cartouche
             inset
             cartographer
             date
             political boundaries                          decorative border (describe)
             railroad lines
             roads/trails
             panoramic view


2. Which way is north?


3. Who created this map?


4. When was it created?


5. Was any of it made by hand (drawn, engraved, colored)?


6. If you can find them, list some place names on the map that are used today that were originally

     Dutch

     English

     Native American


                                                                                                           Page 5
Section 2. Exploration & Colonialism (continued)


 What is the map's purpose?


 What things on the map (or left off of it) show the map's purpose?


 What things on the map (or left off of it) show what people knew and didn't know?


 How does the map compare to a current map of the same place? What's different and what's the same?


 Write a question for the cartographer about something the map leaves out


Page 6
Maps bear witness to history
In Section 3, find the alcove for Rutgers Farm and look at the real estate maps and bird’s eye views showing the
changes in the neighborhood over time.

Section 3. The Great Port – Rutgers Farm


1. Estimate how many city blocks the original Rutgers Farm encompassed as of 1897.


2. Compare the Map of the Rutgers Farm as it Existed in 1784 (showing city blocks as of 1874) and the 1897 map by Bromley
   of the same area on the opposite wall. These maps were created only 23 years apart.

   a) What could each of these maps be used for?


   b) Describe any street changes that you see. Have new streets been added? Have old streets disappeared?


   c) Which way is north on each of these maps? Why do you think the cartographers oriented the maps in this way?


3. Compare the 1857 maps by Perris with the 1897 maps by Bromley to see the changes that happened over 40 years.

   a) Which map is larger scale?


   b) Find William B. Crosby’s mansion, the only leftover from Rutger's Farm, on the 1857 map. What’s the block number
      for the corresponding block on the 1897 Bromley map?


   c) Describe the changes in the industries that are shown on the maps. What new industries appeared by 1897, and
      what old industries disappeared? Name two parks that were created between 1857 and 1897.


                                                                                                                    Page 7
Maps for every purpose, including fun
Find Section 5 of the exhibit, about maps of the Hudson River. Walk along the map on the floor and look at all
the different map elements it incorporates.

Section 5. The Hudson River


 1.   Remembering that this map consists of numerous pages bound into an atlas, what purpose(s) could this map serve
      and why? Can you think of any other uses for the map?


 2.   Pick a town on the floor map. Choose two other maps in the room, both of which are geared toward tourism, to
      compare how they depict the same town.

                                   Map 1                                     Map 2
      Map title

      Cartographer

      Date

      Why did you chose this
      map?


      What features from the
      floor map are missing from
      this map?


      Why do you think the
      cartographer for this map
      left those features out?


Page 8
The cartographer’s dilemma

Draw your own map of the exhibit below so that someone can locate and identify the four maps you reviewed in Sections
1, 2, and 5 of the exhibit. Find a way to make your favorite map stand out. The map you draw can be geographically
accurate, or extremely abstract, but it must be obviously designed for navigation. Include the following elements:
1. A cartouche containing the map title, your name as the cartographer, and the date
2. An inset showing all four of your chosen maps on a timeline. The timeline must also include at least two of the
     following dates: 1609, the year Henry Hudson sailed up the Hudson River, 1664, the year the English took control of
     Nieuw Nederland, 1776, the year of American independence, 1812, the start of the War of 1812, and 1865, the end of the
     Civil War.


                                                                                                                       Page 9
Arlene Yu, LIS 697-06, Fall 2009


                The New York Public Library

                Learning at the Library:
                K-12 Outreach at the Research Libraries


Educator Packet

Mapping New York's Shoreline, 1609-2009:
Celebrating the Quadricentennial of Henry Hudson's Exploration of the Waterways of New York


Grade level    9-12

Tour length    1 ½ hours

               The tour will begin with a 10 minute slide lecture in the Celeste Bartos Education Center at
               South Court, located on the first floor, followed by a visit to the exhibit in the D. Samuel and
               Jeane H. Gottesman Exhibition Hall next door. Students will be provided with a tour packet
               that includes activities for them to explore the exhibit. Please leave extra time for your
               students to arrive and depart as all bags are checked upon entering and exiting the building.

Introduction   The objective of this tour is to introduce students to cartography and the study of maps as
               historical documents. Historic maps (old maps, as opposed to historical maps created today
               about the past) convey far more information than what factual errors the cartographers
               committed out of ignorance. Cartographers select what information to include and what to
               omit from every map they make, and their decisions can affect their audience's perceptions of
               the world. The center of a map is usually regarded as more important than the edges, for
               example.

               But old maps can be difficult for students to read and understand. This tour will provide
               students with a framework for analyzing old maps while teaching them cartographic
               terminology. Students will learn how paying attention to map details can help them determine
               cartographers' purposes as well as biases, and the importance of evaluating any map to
               determine what it betrays about how people understand the world around them.

NY State       Social Studies
education
standards      1. History of the United States and New York
                  Students will use a variety of intellectual skills to demonstrate their understanding of major
                  ideas, eras, themes, developments, and turning points in the history of the United States
                  and New York.

               2. World history
                  Students will use a variety of intellectual skills to demonstrate their understanding of major
                  ideas, eras, themes, developments, and turning points in world history and examine the
                  broad sweep of history from a variety of perspectives.

               3. Geography
                  Students will use a variety of intellectual skills to demonstrate their understanding of the
                  geography of the interdependent world in which we live – local, national, and global –
                  including the distribution of people, places, and environments over the Earth’s surface.

                                                                                                                    Page 1
4. Economics
            Students will use a variety of intellectual skills to demonstrate their understanding of how
            the United States and other societies develop economic systems and associated institutions
            to allocate scarce resources, how major decision-making units function in the United States
            and other national economies, and how an economy solves the scarcity problem through
            market and nonmarket mechanisms.

         Language Arts

         1. Students will read, write, listen, and speak for information and understanding
            As listeners and readers, students will collect data, facts, and ideas, discover relationships,
            concepts, and generalizations; and use knowledge generated from oral, written, and
            electronically produced texts. As speakers and writers, they will use oral and written
            language to acquire, interpret, apply, and transmit information.

         3. Students will read, write, listen, and speak for critical analysis and evaluation
            As listeners and readers, students will analyze experiences, ideas, information, and issues
            presented by others using a variety of established criteria. As speakers and writers, they will
            present, in oral and written language and from a variety of perspectives, their opinions and
            judgments on experiences, ideas, information and issues.

         4. Students will read, write, listen, and speak for social interaction
            Students will use oral and written language for effective social communication with a wide
            variety of people. As readers and listeners, they will use the social communications of
            others to enrich their understanding of people and their views.

         The Arts

         3. Responding to and analyzing works of art
            Students will respond critically to a variety of works in the arts, connecting the individual
            work to other works and to other aspects of human endeavor and thought.

         4. Understanding the cultural dimensions and contributions of the arts
            Students will develop an understanding of the personal and cultural forces that shape
            artistic communication and how the arts in turn shape the diverse cultures of past and
            present society.

         Technology

         2. Students will access, generate, process, and transfer information using appropriate
            technologies

         5. Students will apply technological knowledge and skills to design, construct, use, and
            evaluate products and systems to satisfy human and environmental needs.

         Career Development and Occupational Studies

         1. Career development
            Students will be knowledgeable about the world of work, explore career options, and relate
            personal skills, aptitudes, and abilities to future career decisions.

         2. Integrated learning
            Students will demonstrate how academic knowledge and skills are applied in the workplace
            and other settings.

Page 2
Pre-tour      1. Download, print, and post the twelve letter-size tiles that make up the wall-size
preparation      Waldseemuller map of the world. The map was the first map ever made to include the word
                 "America," and the only existing copy is in the Library of Congress. There are two files,
                 http://myloc.gov/Education/LessonPlans/Pages/lessonplans/world/docs/world1507-pt1.pdf
                 and http://myloc.gov/Education/LessonPlans/Pages/lessonplans/world/docs/world1507-
                 pt2.pdf. Then optionally use the website, Maps and Mapmakers: Seeing What's On the Map
                 (http://myloc.gov/Education/OnlineActivities/Pages/onlineactivities/mapmaking/
                 index.html), to explore the cartographer's choices in what to show and what to omit. Ask
                 students how we can determine the cartographer's emphasis and what that might say about
                 he and/or his contemporaries viewed the world. Explore what maps are and what areas of
                 life are affected by maps (trade, travel, politics, communication, environment, etc.)

              2. Next, visit the British Library's Learning Mapping History site and explore the 1644 Chinese
                 World Map (http://www.bl.uk/learning/artimages/maphist/deception/chineseworldmap/
                 chinese.html), as well as the fake map of Roman Britain (http://www.bl.uk/learning/
                 artimages/maphist/deception/fakemap/fake.html), to learn about how map design can be
                 deceptive in intent.

Materials     For the tour, please be sure students bring:
                  • Notebooks or other items suitable for acting as writing surfaces
                  • Pencils
                  • Erasers

Post-tour     1. Using the supplied images (none of which are in the exhibit) from before and after the
activities       American Revolution, divide the students into groups. Ask each group to analyze the map
                 using the framework they learned at the library. Then ask each group to write plausible
                 news stories, based on their knowledge of the period, for which the map could serve as an
                 appropriate illustration. Then ask the groups to design maps for a current news story –
                 local, regional, national, or international.

              2. Using Google Earth, ask students to make their own maps of New York City or their
                 hometown, locating and marking important information, activating layers to be viewed,
                 and drawing lines or shapes on top of the map if appropriate. Encourage students to think
                 of the various Hudson River maps in Section 5 of the exhibit as examples of maps with
                 different agendas. Students should strive for visual clarity and pleasing design, in addition
                 to making their maps fulfill a specific, stated purpose.

                 Each student should save their place marks in a KMZ file, and then present their map to the
                 class, explaining their layer and place mark selections and their use of drawing objects, as
                 well as how they were able to locate their places of interest (latitude/longitude, street
                 address, zooming in).

                 In the discussions of student presentations, try to cover the following points:
                  • How different locating methods (latitude/longitude, street address, zooming in) work,
                      and how accurate they seem.
                  • How latitude and longitude can pinpoint something on a map, but aren't as meaningful
                      to us as a street address can be.
                  • How Google Earth's satellite imagery might actually interfere with designing a clear
                      map. Compare Google Earth to Google Maps map view and terrain view and to plain
                      outline maps and discuss which would best suit the students' designs.

Extended      1. Explore the connection between maps and math, using resources from
activities       http://math.rice.edu/~lanius/pres/map/ and materials from the US Geological Survey at
                 http://egsc.usgs.gov/isb/pubs/teachers-packets/exploringmaps/ and
                 http://egsc.usgs.gov/isb/pubs/MapProjections/projections.html.

                                                                                                          Page 3
2. Use the National Geographic lesson plan, Maps and Current Events
                (http://www.nationalgeographic.com/resources/ngo/education/xpeditions/lessons/03/g912
                /exploremaps.html), to develop and look at modern maps with a critical eye.

             3. Have students explore making mental maps of a work of fiction or of a particular topic as a
                different way to approach outlining and memorization.

Suggested    1. NYPL online guide to the exhibit, Mapping New York's Shoreline, 1609-2009:
reading/        http://www.nypl.org/research/chss/shoreline/index.html.
additional
resources    2. NYPL online exhibit American Shores: Maps of the Middle Atlantic Region to 1850:
                http://www.nypl.org/research/midatlantic/index.html and the NYPL Digital Gallery
                (http://digitalgallery.nypl.org/nypldigital/explore/dgexplore.cfm?topic=history&col_id=149
                and http://digitalgallery.nypl.org/nypldigital/explore/dgexplore.cfm?topic=history&
                col_id=442). Additional historical maps.

             3. The British Library's Learning Mapping History website:
                http://www.bl.uk/learning/artimages/maphist/mappinghistory.html.

             4. The University of Southern Maine's discussion of the Mitchell Map, 1755-1782: An Irony of
                Empire (http://usm.maine.edu/maps/web-document/2/1/sub-/1-introduction-and-
                overview). NYPL has a copy of the map, available in the Digital Gallery at:
                http://digitalgallery.nypl.org/nypldigital/id?484185).

             5. The Young Oxford Companion to Maps and Mapmaking, by Rebecca Stefoff. Oxford
                University Press, 1995. ISBN 0195080424, ISBN-13 9780195080421. 303 pages.


Page 4

Weitere ähnliche Inhalte

Kürzlich hochgeladen

How to Manage Global Discount in Odoo 17 POS
How to Manage Global Discount in Odoo 17 POSHow to Manage Global Discount in Odoo 17 POS
How to Manage Global Discount in Odoo 17 POSCeline George
 
General Principles of Intellectual Property: Concepts of Intellectual Proper...
General Principles of Intellectual Property: Concepts of Intellectual  Proper...General Principles of Intellectual Property: Concepts of Intellectual  Proper...
General Principles of Intellectual Property: Concepts of Intellectual Proper...Poonam Aher Patil
 
SKILL OF INTRODUCING THE LESSON MICRO SKILLS.pptx
SKILL OF INTRODUCING THE LESSON MICRO SKILLS.pptxSKILL OF INTRODUCING THE LESSON MICRO SKILLS.pptx
SKILL OF INTRODUCING THE LESSON MICRO SKILLS.pptxAmanpreet Kaur
 
Basic Civil Engineering first year Notes- Chapter 4 Building.pptx
Basic Civil Engineering first year Notes- Chapter 4 Building.pptxBasic Civil Engineering first year Notes- Chapter 4 Building.pptx
Basic Civil Engineering first year Notes- Chapter 4 Building.pptxDenish Jangid
 
80 ĐỀ THI THỬ TUYỂN SINH TIẾNG ANH VÀO 10 SỞ GD – ĐT THÀNH PHỐ HỒ CHÍ MINH NĂ...
80 ĐỀ THI THỬ TUYỂN SINH TIẾNG ANH VÀO 10 SỞ GD – ĐT THÀNH PHỐ HỒ CHÍ MINH NĂ...80 ĐỀ THI THỬ TUYỂN SINH TIẾNG ANH VÀO 10 SỞ GD – ĐT THÀNH PHỐ HỒ CHÍ MINH NĂ...
80 ĐỀ THI THỬ TUYỂN SINH TIẾNG ANH VÀO 10 SỞ GD – ĐT THÀNH PHỐ HỒ CHÍ MINH NĂ...Nguyen Thanh Tu Collection
 
Food safety_Challenges food safety laboratories_.pdf
Food safety_Challenges food safety laboratories_.pdfFood safety_Challenges food safety laboratories_.pdf
Food safety_Challenges food safety laboratories_.pdfSherif Taha
 
SOC 101 Demonstration of Learning Presentation
SOC 101 Demonstration of Learning PresentationSOC 101 Demonstration of Learning Presentation
SOC 101 Demonstration of Learning Presentationcamerronhm
 
This PowerPoint helps students to consider the concept of infinity.
This PowerPoint helps students to consider the concept of infinity.This PowerPoint helps students to consider the concept of infinity.
This PowerPoint helps students to consider the concept of infinity.christianmathematics
 
Sociology 101 Demonstration of Learning Exhibit
Sociology 101 Demonstration of Learning ExhibitSociology 101 Demonstration of Learning Exhibit
Sociology 101 Demonstration of Learning Exhibitjbellavia9
 
Graduate Outcomes Presentation Slides - English
Graduate Outcomes Presentation Slides - EnglishGraduate Outcomes Presentation Slides - English
Graduate Outcomes Presentation Slides - Englishneillewis46
 
Accessible Digital Futures project (20/03/2024)
Accessible Digital Futures project (20/03/2024)Accessible Digital Futures project (20/03/2024)
Accessible Digital Futures project (20/03/2024)Jisc
 
Fostering Friendships - Enhancing Social Bonds in the Classroom
Fostering Friendships - Enhancing Social Bonds  in the ClassroomFostering Friendships - Enhancing Social Bonds  in the Classroom
Fostering Friendships - Enhancing Social Bonds in the ClassroomPooky Knightsmith
 
TỔNG ÔN TẬP THI VÀO LỚP 10 MÔN TIẾNG ANH NĂM HỌC 2023 - 2024 CÓ ĐÁP ÁN (NGỮ Â...
TỔNG ÔN TẬP THI VÀO LỚP 10 MÔN TIẾNG ANH NĂM HỌC 2023 - 2024 CÓ ĐÁP ÁN (NGỮ Â...TỔNG ÔN TẬP THI VÀO LỚP 10 MÔN TIẾNG ANH NĂM HỌC 2023 - 2024 CÓ ĐÁP ÁN (NGỮ Â...
TỔNG ÔN TẬP THI VÀO LỚP 10 MÔN TIẾNG ANH NĂM HỌC 2023 - 2024 CÓ ĐÁP ÁN (NGỮ Â...Nguyen Thanh Tu Collection
 
Key note speaker Neum_Admir Softic_ENG.pdf
Key note speaker Neum_Admir Softic_ENG.pdfKey note speaker Neum_Admir Softic_ENG.pdf
Key note speaker Neum_Admir Softic_ENG.pdfAdmir Softic
 
Spellings Wk 3 English CAPS CARES Please Practise
Spellings Wk 3 English CAPS CARES Please PractiseSpellings Wk 3 English CAPS CARES Please Practise
Spellings Wk 3 English CAPS CARES Please PractiseAnaAcapella
 
Salient Features of India constitution especially power and functions
Salient Features of India constitution especially power and functionsSalient Features of India constitution especially power and functions
Salient Features of India constitution especially power and functionsKarakKing
 
Application orientated numerical on hev.ppt
Application orientated numerical on hev.pptApplication orientated numerical on hev.ppt
Application orientated numerical on hev.pptRamjanShidvankar
 
ICT role in 21st century education and it's challenges.
ICT role in 21st century education and it's challenges.ICT role in 21st century education and it's challenges.
ICT role in 21st century education and it's challenges.MaryamAhmad92
 
REMIFENTANIL: An Ultra short acting opioid.pptx
REMIFENTANIL: An Ultra short acting opioid.pptxREMIFENTANIL: An Ultra short acting opioid.pptx
REMIFENTANIL: An Ultra short acting opioid.pptxDr. Ravikiran H M Gowda
 
Making communications land - Are they received and understood as intended? we...
Making communications land - Are they received and understood as intended? we...Making communications land - Are they received and understood as intended? we...
Making communications land - Are they received and understood as intended? we...Association for Project Management
 

Kürzlich hochgeladen (20)

How to Manage Global Discount in Odoo 17 POS
How to Manage Global Discount in Odoo 17 POSHow to Manage Global Discount in Odoo 17 POS
How to Manage Global Discount in Odoo 17 POS
 
General Principles of Intellectual Property: Concepts of Intellectual Proper...
General Principles of Intellectual Property: Concepts of Intellectual  Proper...General Principles of Intellectual Property: Concepts of Intellectual  Proper...
General Principles of Intellectual Property: Concepts of Intellectual Proper...
 
SKILL OF INTRODUCING THE LESSON MICRO SKILLS.pptx
SKILL OF INTRODUCING THE LESSON MICRO SKILLS.pptxSKILL OF INTRODUCING THE LESSON MICRO SKILLS.pptx
SKILL OF INTRODUCING THE LESSON MICRO SKILLS.pptx
 
Basic Civil Engineering first year Notes- Chapter 4 Building.pptx
Basic Civil Engineering first year Notes- Chapter 4 Building.pptxBasic Civil Engineering first year Notes- Chapter 4 Building.pptx
Basic Civil Engineering first year Notes- Chapter 4 Building.pptx
 
80 ĐỀ THI THỬ TUYỂN SINH TIẾNG ANH VÀO 10 SỞ GD – ĐT THÀNH PHỐ HỒ CHÍ MINH NĂ...
80 ĐỀ THI THỬ TUYỂN SINH TIẾNG ANH VÀO 10 SỞ GD – ĐT THÀNH PHỐ HỒ CHÍ MINH NĂ...80 ĐỀ THI THỬ TUYỂN SINH TIẾNG ANH VÀO 10 SỞ GD – ĐT THÀNH PHỐ HỒ CHÍ MINH NĂ...
80 ĐỀ THI THỬ TUYỂN SINH TIẾNG ANH VÀO 10 SỞ GD – ĐT THÀNH PHỐ HỒ CHÍ MINH NĂ...
 
Food safety_Challenges food safety laboratories_.pdf
Food safety_Challenges food safety laboratories_.pdfFood safety_Challenges food safety laboratories_.pdf
Food safety_Challenges food safety laboratories_.pdf
 
SOC 101 Demonstration of Learning Presentation
SOC 101 Demonstration of Learning PresentationSOC 101 Demonstration of Learning Presentation
SOC 101 Demonstration of Learning Presentation
 
This PowerPoint helps students to consider the concept of infinity.
This PowerPoint helps students to consider the concept of infinity.This PowerPoint helps students to consider the concept of infinity.
This PowerPoint helps students to consider the concept of infinity.
 
Sociology 101 Demonstration of Learning Exhibit
Sociology 101 Demonstration of Learning ExhibitSociology 101 Demonstration of Learning Exhibit
Sociology 101 Demonstration of Learning Exhibit
 
Graduate Outcomes Presentation Slides - English
Graduate Outcomes Presentation Slides - EnglishGraduate Outcomes Presentation Slides - English
Graduate Outcomes Presentation Slides - English
 
Accessible Digital Futures project (20/03/2024)
Accessible Digital Futures project (20/03/2024)Accessible Digital Futures project (20/03/2024)
Accessible Digital Futures project (20/03/2024)
 
Fostering Friendships - Enhancing Social Bonds in the Classroom
Fostering Friendships - Enhancing Social Bonds  in the ClassroomFostering Friendships - Enhancing Social Bonds  in the Classroom
Fostering Friendships - Enhancing Social Bonds in the Classroom
 
TỔNG ÔN TẬP THI VÀO LỚP 10 MÔN TIẾNG ANH NĂM HỌC 2023 - 2024 CÓ ĐÁP ÁN (NGỮ Â...
TỔNG ÔN TẬP THI VÀO LỚP 10 MÔN TIẾNG ANH NĂM HỌC 2023 - 2024 CÓ ĐÁP ÁN (NGỮ Â...TỔNG ÔN TẬP THI VÀO LỚP 10 MÔN TIẾNG ANH NĂM HỌC 2023 - 2024 CÓ ĐÁP ÁN (NGỮ Â...
TỔNG ÔN TẬP THI VÀO LỚP 10 MÔN TIẾNG ANH NĂM HỌC 2023 - 2024 CÓ ĐÁP ÁN (NGỮ Â...
 
Key note speaker Neum_Admir Softic_ENG.pdf
Key note speaker Neum_Admir Softic_ENG.pdfKey note speaker Neum_Admir Softic_ENG.pdf
Key note speaker Neum_Admir Softic_ENG.pdf
 
Spellings Wk 3 English CAPS CARES Please Practise
Spellings Wk 3 English CAPS CARES Please PractiseSpellings Wk 3 English CAPS CARES Please Practise
Spellings Wk 3 English CAPS CARES Please Practise
 
Salient Features of India constitution especially power and functions
Salient Features of India constitution especially power and functionsSalient Features of India constitution especially power and functions
Salient Features of India constitution especially power and functions
 
Application orientated numerical on hev.ppt
Application orientated numerical on hev.pptApplication orientated numerical on hev.ppt
Application orientated numerical on hev.ppt
 
ICT role in 21st century education and it's challenges.
ICT role in 21st century education and it's challenges.ICT role in 21st century education and it's challenges.
ICT role in 21st century education and it's challenges.
 
REMIFENTANIL: An Ultra short acting opioid.pptx
REMIFENTANIL: An Ultra short acting opioid.pptxREMIFENTANIL: An Ultra short acting opioid.pptx
REMIFENTANIL: An Ultra short acting opioid.pptx
 
Making communications land - Are they received and understood as intended? we...
Making communications land - Are they received and understood as intended? we...Making communications land - Are they received and understood as intended? we...
Making communications land - Are they received and understood as intended? we...
 

Empfohlen

How Race, Age and Gender Shape Attitudes Towards Mental Health
How Race, Age and Gender Shape Attitudes Towards Mental HealthHow Race, Age and Gender Shape Attitudes Towards Mental Health
How Race, Age and Gender Shape Attitudes Towards Mental HealthThinkNow
 
AI Trends in Creative Operations 2024 by Artwork Flow.pdf
AI Trends in Creative Operations 2024 by Artwork Flow.pdfAI Trends in Creative Operations 2024 by Artwork Flow.pdf
AI Trends in Creative Operations 2024 by Artwork Flow.pdfmarketingartwork
 
PEPSICO Presentation to CAGNY Conference Feb 2024
PEPSICO Presentation to CAGNY Conference Feb 2024PEPSICO Presentation to CAGNY Conference Feb 2024
PEPSICO Presentation to CAGNY Conference Feb 2024Neil Kimberley
 
Content Methodology: A Best Practices Report (Webinar)
Content Methodology: A Best Practices Report (Webinar)Content Methodology: A Best Practices Report (Webinar)
Content Methodology: A Best Practices Report (Webinar)contently
 
How to Prepare For a Successful Job Search for 2024
How to Prepare For a Successful Job Search for 2024How to Prepare For a Successful Job Search for 2024
How to Prepare For a Successful Job Search for 2024Albert Qian
 
Social Media Marketing Trends 2024 // The Global Indie Insights
Social Media Marketing Trends 2024 // The Global Indie InsightsSocial Media Marketing Trends 2024 // The Global Indie Insights
Social Media Marketing Trends 2024 // The Global Indie InsightsKurio // The Social Media Age(ncy)
 
Trends In Paid Search: Navigating The Digital Landscape In 2024
Trends In Paid Search: Navigating The Digital Landscape In 2024Trends In Paid Search: Navigating The Digital Landscape In 2024
Trends In Paid Search: Navigating The Digital Landscape In 2024Search Engine Journal
 
5 Public speaking tips from TED - Visualized summary
5 Public speaking tips from TED - Visualized summary5 Public speaking tips from TED - Visualized summary
5 Public speaking tips from TED - Visualized summarySpeakerHub
 
ChatGPT and the Future of Work - Clark Boyd
ChatGPT and the Future of Work - Clark Boyd ChatGPT and the Future of Work - Clark Boyd
ChatGPT and the Future of Work - Clark Boyd Clark Boyd
 
Getting into the tech field. what next
Getting into the tech field. what next Getting into the tech field. what next
Getting into the tech field. what next Tessa Mero
 
Google's Just Not That Into You: Understanding Core Updates & Search Intent
Google's Just Not That Into You: Understanding Core Updates & Search IntentGoogle's Just Not That Into You: Understanding Core Updates & Search Intent
Google's Just Not That Into You: Understanding Core Updates & Search IntentLily Ray
 
Time Management & Productivity - Best Practices
Time Management & Productivity -  Best PracticesTime Management & Productivity -  Best Practices
Time Management & Productivity - Best PracticesVit Horky
 
The six step guide to practical project management
The six step guide to practical project managementThe six step guide to practical project management
The six step guide to practical project managementMindGenius
 
Beginners Guide to TikTok for Search - Rachel Pearson - We are Tilt __ Bright...
Beginners Guide to TikTok for Search - Rachel Pearson - We are Tilt __ Bright...Beginners Guide to TikTok for Search - Rachel Pearson - We are Tilt __ Bright...
Beginners Guide to TikTok for Search - Rachel Pearson - We are Tilt __ Bright...RachelPearson36
 
Unlocking the Power of ChatGPT and AI in Testing - A Real-World Look, present...
Unlocking the Power of ChatGPT and AI in Testing - A Real-World Look, present...Unlocking the Power of ChatGPT and AI in Testing - A Real-World Look, present...
Unlocking the Power of ChatGPT and AI in Testing - A Real-World Look, present...Applitools
 
12 Ways to Increase Your Influence at Work
12 Ways to Increase Your Influence at Work12 Ways to Increase Your Influence at Work
12 Ways to Increase Your Influence at WorkGetSmarter
 

Empfohlen (20)

How Race, Age and Gender Shape Attitudes Towards Mental Health
How Race, Age and Gender Shape Attitudes Towards Mental HealthHow Race, Age and Gender Shape Attitudes Towards Mental Health
How Race, Age and Gender Shape Attitudes Towards Mental Health
 
AI Trends in Creative Operations 2024 by Artwork Flow.pdf
AI Trends in Creative Operations 2024 by Artwork Flow.pdfAI Trends in Creative Operations 2024 by Artwork Flow.pdf
AI Trends in Creative Operations 2024 by Artwork Flow.pdf
 
Skeleton Culture Code
Skeleton Culture CodeSkeleton Culture Code
Skeleton Culture Code
 
PEPSICO Presentation to CAGNY Conference Feb 2024
PEPSICO Presentation to CAGNY Conference Feb 2024PEPSICO Presentation to CAGNY Conference Feb 2024
PEPSICO Presentation to CAGNY Conference Feb 2024
 
Content Methodology: A Best Practices Report (Webinar)
Content Methodology: A Best Practices Report (Webinar)Content Methodology: A Best Practices Report (Webinar)
Content Methodology: A Best Practices Report (Webinar)
 
How to Prepare For a Successful Job Search for 2024
How to Prepare For a Successful Job Search for 2024How to Prepare For a Successful Job Search for 2024
How to Prepare For a Successful Job Search for 2024
 
Social Media Marketing Trends 2024 // The Global Indie Insights
Social Media Marketing Trends 2024 // The Global Indie InsightsSocial Media Marketing Trends 2024 // The Global Indie Insights
Social Media Marketing Trends 2024 // The Global Indie Insights
 
Trends In Paid Search: Navigating The Digital Landscape In 2024
Trends In Paid Search: Navigating The Digital Landscape In 2024Trends In Paid Search: Navigating The Digital Landscape In 2024
Trends In Paid Search: Navigating The Digital Landscape In 2024
 
5 Public speaking tips from TED - Visualized summary
5 Public speaking tips from TED - Visualized summary5 Public speaking tips from TED - Visualized summary
5 Public speaking tips from TED - Visualized summary
 
ChatGPT and the Future of Work - Clark Boyd
ChatGPT and the Future of Work - Clark Boyd ChatGPT and the Future of Work - Clark Boyd
ChatGPT and the Future of Work - Clark Boyd
 
Getting into the tech field. what next
Getting into the tech field. what next Getting into the tech field. what next
Getting into the tech field. what next
 
Google's Just Not That Into You: Understanding Core Updates & Search Intent
Google's Just Not That Into You: Understanding Core Updates & Search IntentGoogle's Just Not That Into You: Understanding Core Updates & Search Intent
Google's Just Not That Into You: Understanding Core Updates & Search Intent
 
How to have difficult conversations
How to have difficult conversations How to have difficult conversations
How to have difficult conversations
 
Introduction to Data Science
Introduction to Data ScienceIntroduction to Data Science
Introduction to Data Science
 
Time Management & Productivity - Best Practices
Time Management & Productivity -  Best PracticesTime Management & Productivity -  Best Practices
Time Management & Productivity - Best Practices
 
The six step guide to practical project management
The six step guide to practical project managementThe six step guide to practical project management
The six step guide to practical project management
 
Beginners Guide to TikTok for Search - Rachel Pearson - We are Tilt __ Bright...
Beginners Guide to TikTok for Search - Rachel Pearson - We are Tilt __ Bright...Beginners Guide to TikTok for Search - Rachel Pearson - We are Tilt __ Bright...
Beginners Guide to TikTok for Search - Rachel Pearson - We are Tilt __ Bright...
 
Unlocking the Power of ChatGPT and AI in Testing - A Real-World Look, present...
Unlocking the Power of ChatGPT and AI in Testing - A Real-World Look, present...Unlocking the Power of ChatGPT and AI in Testing - A Real-World Look, present...
Unlocking the Power of ChatGPT and AI in Testing - A Real-World Look, present...
 
12 Ways to Increase Your Influence at Work
12 Ways to Increase Your Influence at Work12 Ways to Increase Your Influence at Work
12 Ways to Increase Your Influence at Work
 
ChatGPT webinar slides
ChatGPT webinar slidesChatGPT webinar slides
ChatGPT webinar slides
 

Educational Experience for NYPL

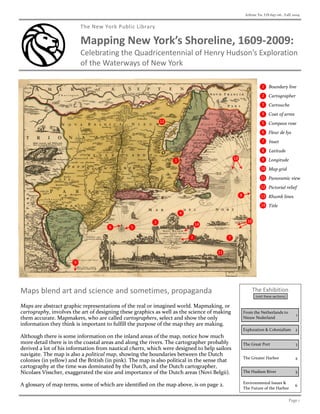
  • 1. Arlene Yu, LIS 697-06 , Fall 2009 The New York Public Library Mapping New York’s Shoreline, 1609-2009: Celebrating the Quadricentennial of Henry Hudson’s Exploration of the Waterways of New York 1 Boundary line 2 Cartographer 3 Cartouche 4 Coat of arms 12 5 Compass rose 6 Fleur de lys 7 Inset 8 Latitude 13 9 Longitude 1 10 Map grid 11 Panoramic view 12 Pictorial relief 8 13 Rhumb lines 14 Title 4 3 10 14 6 5 2 7 11 9 Maps blend art and science and sometimes, propaganda The Exhibition (visit these sections) Maps are abstract graphic representations of the real or imagined world. Mapmaking, or cartography, involves the art of designing these graphics as well as the science of making From the Netherlands to 1 them accurate. Mapmakers, who are called cartographers, select and show the only Nieuw Nederland information they think is important to fulfill the purpose of the map they are making. Exploration & Colonialism 2 Although there is some information on the inland areas of the map, notice how much more detail there is in the coastal areas and along the rivers. The cartographer probably The Great Port 3 derived a lot of his information from nautical charts, which were designed to help sailors navigate. The map is also a political map, showing the boundaries between the Dutch The Greater Harbor 4 colonies (in yellow) and the British (in pink). The map is also political in the sense that cartography at the time was dominated by the Dutch, and the Dutch cartographer, Nicolaes Visscher, exaggerated the size and importance of the Dutch areas (Novi Belgii). The Hudson River 5 Environmental Issues & A glossary of map terms, some of which are identified on the map above, is on page 2. 6 The Future of the Harbor Page 1
  • 2. A brief glossary of maps and mapmaking Aerial view. A perspective from directly above a site looking down, so that only tops of buildings and objects are shown. Atlas. A collection of maps or charts bound together into a book. Bird's eye view. A perspective from above, but at an angle, so that tops and sides of buildings and objects are shown in a three- dimensional view. See also Panoramic view. Cartouche. A scroll or panel used on many globes and maps to give the title of the object and often the name of the maker. Cartouches were also used to fill up empty space or distract the viewer's attention from missing geographical data. Cartographer. A map maker. On this chart, the cartographer is Gerard van Keulen. Cartography. The art and science of making maps. Chart. A detailed map of seas and coasts, designed for sailors. Coat of arms. A decorative heraldic badge usually centered on the shape of a shield, used on flags, battle dress, house fronts and so on to show that they belonged to a particular family, clan or nation. Compass. A device for determining direction, which consists of a magnetized needle that pivots and points to magnetic north. Compass rose or wind rose. A drawing of a compass on a chart which usually shows either 16 or 32 compass points, showing courses to sail. Wind roses showed the directions of the eight named winds in early charts. The fleur-de-lys symbols at the top of the compass roses on this chart indicate north. Contour line. An imaginary line on the ground which connects points of the same altitude. Used to show relief. Equator. An imaginary line drawn around the Earth, midway between the North and South Poles. Fleur de lys. A representation of a lily flower with three distinct petals, the old symbol of France. The fleur de lys is used to symbolize north because it is shaped like a “T,” which stands for the old name of the North Wind, the Tramontana. Hachure. A series of lines used on a map to indicate the general direction and steepness of slopes. Hachures are drawn in the direction of slopes. Compare to pictorial relief and contour line. Inset. Small image within the border of a larger map. Key. A list or chart that explains the symbols on a map or chart. Latitude. Distance north or south of the Equator (latitude 0°)on the surface of the Earth, measured in degrees (angles) relative to the earth’s center. Latitude gets higher (bigger) as you go north or south. Longitude. Distance east or west from a known position (meridian) on the surface of the Earth, measured in degrees relative to the earth’s center. Today the Prime Meridian (longitude 0°) from which longitude is measured is at Greenwich, England. In the past, the Prime Meridian has been located in many places, including Paris and the Canary Islands. Map. An abstract graphic representation of the real or imagined world, using points, lines, and areas that vary in size, shape, value, texture or pattern, color, and orientation. Map grid. A network of horizontal and vertical lines, uniformly spaced, used to locate points on a map. Map projection. A method of representing the earth's three-dimensional surface as a flat two-dimensional surface. One of the most famous projections is the Mercator projection. Panoramic view. A bird's eye view, usually of a wide area. Pictorial relief. Elevations of the land shown through stylized drawings of hills and forests. Political map. A map showing where one country, region, state, or city ends and another begins. Portolan. An early type of sea chart from the Mediterranean Sea, featuring wind roses or compass roses, and rhumb lines. Prime Meridian. An imaginary line drawn from the North to the South Pole which determines 0° longitude. Relief. Elevations and depressions of the land or sea bottom. Rhumb lines. The lines of compass headings extended from compass roses. Scale. Relationship existing between a distance on a map, chart, or photograph and the corresponding distance on the Earth. Vellum. A map material made from sheepskin. It is tough and survived well at sea, so it was often used for charts. Page 2
  • 3. The cartographer defines the world we see Walk through sections 1 and 2 of the exhibit. In each section, pick one map and analyze it using the worksheets. Do not analyze the map shown on page 1 of this booklet. Section 1. From the Netherlands to Nieuw Nederland 1. What map elements or features do you see? rhumb lines coat of arms latitude colored areas longitude compass rose(s) advertising (describe) fleur-de-lys relief (pictorial, contour lines, hachures) water depths (“soundings”) rivers scale decorations in seas or land masses (describe) cartouche inset cartographer date political boundaries decorative border (describe) railroad lines roads/trails panoramic view 2. Which way is north? 3. Who created this map? 4. When was it created? 5. Was any of it made by hand (drawn, engraved, colored)? 6. If you can find them, list some place names on the map that are used today that were originally Dutch English Native American Page 3
  • 4. Section 1. From the Netherlands to Nieuw Nederland (continued) What is the map's purpose? What things on the map (or left off of it) show the map's purpose? What things on the map (or left off of it) show what people knew and didn't know? How does the map compare to a current map of the same place? What's different and what's the same? Write a question for the cartographer about something the map leaves out Page 4
  • 5. Section 2. Exploration & Colonialism 1. What map elements or features do you see? rhumb lines coat of arms latitude colored areas longitude compass rose(s) advertising (describe) fleur-de-lys relief (pictorial, contour lines, hachures) water depths (“soundings”) rivers scale decorations in seas or land masses (describe) cartouche inset cartographer date political boundaries decorative border (describe) railroad lines roads/trails panoramic view 2. Which way is north? 3. Who created this map? 4. When was it created? 5. Was any of it made by hand (drawn, engraved, colored)? 6. If you can find them, list some place names on the map that are used today that were originally Dutch English Native American Page 5
  • 6. Section 2. Exploration & Colonialism (continued) What is the map's purpose? What things on the map (or left off of it) show the map's purpose? What things on the map (or left off of it) show what people knew and didn't know? How does the map compare to a current map of the same place? What's different and what's the same? Write a question for the cartographer about something the map leaves out Page 6
  • 7. Maps bear witness to history In Section 3, find the alcove for Rutgers Farm and look at the real estate maps and bird’s eye views showing the changes in the neighborhood over time. Section 3. The Great Port – Rutgers Farm 1. Estimate how many city blocks the original Rutgers Farm encompassed as of 1897. 2. Compare the Map of the Rutgers Farm as it Existed in 1784 (showing city blocks as of 1874) and the 1897 map by Bromley of the same area on the opposite wall. These maps were created only 23 years apart. a) What could each of these maps be used for? b) Describe any street changes that you see. Have new streets been added? Have old streets disappeared? c) Which way is north on each of these maps? Why do you think the cartographers oriented the maps in this way? 3. Compare the 1857 maps by Perris with the 1897 maps by Bromley to see the changes that happened over 40 years. a) Which map is larger scale? b) Find William B. Crosby’s mansion, the only leftover from Rutger's Farm, on the 1857 map. What’s the block number for the corresponding block on the 1897 Bromley map? c) Describe the changes in the industries that are shown on the maps. What new industries appeared by 1897, and what old industries disappeared? Name two parks that were created between 1857 and 1897. Page 7
  • 8. Maps for every purpose, including fun Find Section 5 of the exhibit, about maps of the Hudson River. Walk along the map on the floor and look at all the different map elements it incorporates. Section 5. The Hudson River 1. Remembering that this map consists of numerous pages bound into an atlas, what purpose(s) could this map serve and why? Can you think of any other uses for the map? 2. Pick a town on the floor map. Choose two other maps in the room, both of which are geared toward tourism, to compare how they depict the same town. Map 1 Map 2 Map title Cartographer Date Why did you chose this map? What features from the floor map are missing from this map? Why do you think the cartographer for this map left those features out? Page 8
  • 9. The cartographer’s dilemma Draw your own map of the exhibit below so that someone can locate and identify the four maps you reviewed in Sections 1, 2, and 5 of the exhibit. Find a way to make your favorite map stand out. The map you draw can be geographically accurate, or extremely abstract, but it must be obviously designed for navigation. Include the following elements: 1. A cartouche containing the map title, your name as the cartographer, and the date 2. An inset showing all four of your chosen maps on a timeline. The timeline must also include at least two of the following dates: 1609, the year Henry Hudson sailed up the Hudson River, 1664, the year the English took control of Nieuw Nederland, 1776, the year of American independence, 1812, the start of the War of 1812, and 1865, the end of the Civil War. Page 9
  • 10.
  • 11. Arlene Yu, LIS 697-06, Fall 2009 The New York Public Library Learning at the Library: K-12 Outreach at the Research Libraries Educator Packet Mapping New York's Shoreline, 1609-2009: Celebrating the Quadricentennial of Henry Hudson's Exploration of the Waterways of New York Grade level 9-12 Tour length 1 ½ hours The tour will begin with a 10 minute slide lecture in the Celeste Bartos Education Center at South Court, located on the first floor, followed by a visit to the exhibit in the D. Samuel and Jeane H. Gottesman Exhibition Hall next door. Students will be provided with a tour packet that includes activities for them to explore the exhibit. Please leave extra time for your students to arrive and depart as all bags are checked upon entering and exiting the building. Introduction The objective of this tour is to introduce students to cartography and the study of maps as historical documents. Historic maps (old maps, as opposed to historical maps created today about the past) convey far more information than what factual errors the cartographers committed out of ignorance. Cartographers select what information to include and what to omit from every map they make, and their decisions can affect their audience's perceptions of the world. The center of a map is usually regarded as more important than the edges, for example. But old maps can be difficult for students to read and understand. This tour will provide students with a framework for analyzing old maps while teaching them cartographic terminology. Students will learn how paying attention to map details can help them determine cartographers' purposes as well as biases, and the importance of evaluating any map to determine what it betrays about how people understand the world around them. NY State Social Studies education standards 1. History of the United States and New York Students will use a variety of intellectual skills to demonstrate their understanding of major ideas, eras, themes, developments, and turning points in the history of the United States and New York. 2. World history Students will use a variety of intellectual skills to demonstrate their understanding of major ideas, eras, themes, developments, and turning points in world history and examine the broad sweep of history from a variety of perspectives. 3. Geography Students will use a variety of intellectual skills to demonstrate their understanding of the geography of the interdependent world in which we live – local, national, and global – including the distribution of people, places, and environments over the Earth’s surface. Page 1
  • 12. 4. Economics Students will use a variety of intellectual skills to demonstrate their understanding of how the United States and other societies develop economic systems and associated institutions to allocate scarce resources, how major decision-making units function in the United States and other national economies, and how an economy solves the scarcity problem through market and nonmarket mechanisms. Language Arts 1. Students will read, write, listen, and speak for information and understanding As listeners and readers, students will collect data, facts, and ideas, discover relationships, concepts, and generalizations; and use knowledge generated from oral, written, and electronically produced texts. As speakers and writers, they will use oral and written language to acquire, interpret, apply, and transmit information. 3. Students will read, write, listen, and speak for critical analysis and evaluation As listeners and readers, students will analyze experiences, ideas, information, and issues presented by others using a variety of established criteria. As speakers and writers, they will present, in oral and written language and from a variety of perspectives, their opinions and judgments on experiences, ideas, information and issues. 4. Students will read, write, listen, and speak for social interaction Students will use oral and written language for effective social communication with a wide variety of people. As readers and listeners, they will use the social communications of others to enrich their understanding of people and their views. The Arts 3. Responding to and analyzing works of art Students will respond critically to a variety of works in the arts, connecting the individual work to other works and to other aspects of human endeavor and thought. 4. Understanding the cultural dimensions and contributions of the arts Students will develop an understanding of the personal and cultural forces that shape artistic communication and how the arts in turn shape the diverse cultures of past and present society. Technology 2. Students will access, generate, process, and transfer information using appropriate technologies 5. Students will apply technological knowledge and skills to design, construct, use, and evaluate products and systems to satisfy human and environmental needs. Career Development and Occupational Studies 1. Career development Students will be knowledgeable about the world of work, explore career options, and relate personal skills, aptitudes, and abilities to future career decisions. 2. Integrated learning Students will demonstrate how academic knowledge and skills are applied in the workplace and other settings. Page 2
  • 13. Pre-tour 1. Download, print, and post the twelve letter-size tiles that make up the wall-size preparation Waldseemuller map of the world. The map was the first map ever made to include the word "America," and the only existing copy is in the Library of Congress. There are two files, http://myloc.gov/Education/LessonPlans/Pages/lessonplans/world/docs/world1507-pt1.pdf and http://myloc.gov/Education/LessonPlans/Pages/lessonplans/world/docs/world1507- pt2.pdf. Then optionally use the website, Maps and Mapmakers: Seeing What's On the Map (http://myloc.gov/Education/OnlineActivities/Pages/onlineactivities/mapmaking/ index.html), to explore the cartographer's choices in what to show and what to omit. Ask students how we can determine the cartographer's emphasis and what that might say about he and/or his contemporaries viewed the world. Explore what maps are and what areas of life are affected by maps (trade, travel, politics, communication, environment, etc.) 2. Next, visit the British Library's Learning Mapping History site and explore the 1644 Chinese World Map (http://www.bl.uk/learning/artimages/maphist/deception/chineseworldmap/ chinese.html), as well as the fake map of Roman Britain (http://www.bl.uk/learning/ artimages/maphist/deception/fakemap/fake.html), to learn about how map design can be deceptive in intent. Materials For the tour, please be sure students bring: • Notebooks or other items suitable for acting as writing surfaces • Pencils • Erasers Post-tour 1. Using the supplied images (none of which are in the exhibit) from before and after the activities American Revolution, divide the students into groups. Ask each group to analyze the map using the framework they learned at the library. Then ask each group to write plausible news stories, based on their knowledge of the period, for which the map could serve as an appropriate illustration. Then ask the groups to design maps for a current news story – local, regional, national, or international. 2. Using Google Earth, ask students to make their own maps of New York City or their hometown, locating and marking important information, activating layers to be viewed, and drawing lines or shapes on top of the map if appropriate. Encourage students to think of the various Hudson River maps in Section 5 of the exhibit as examples of maps with different agendas. Students should strive for visual clarity and pleasing design, in addition to making their maps fulfill a specific, stated purpose. Each student should save their place marks in a KMZ file, and then present their map to the class, explaining their layer and place mark selections and their use of drawing objects, as well as how they were able to locate their places of interest (latitude/longitude, street address, zooming in). In the discussions of student presentations, try to cover the following points: • How different locating methods (latitude/longitude, street address, zooming in) work, and how accurate they seem. • How latitude and longitude can pinpoint something on a map, but aren't as meaningful to us as a street address can be. • How Google Earth's satellite imagery might actually interfere with designing a clear map. Compare Google Earth to Google Maps map view and terrain view and to plain outline maps and discuss which would best suit the students' designs. Extended 1. Explore the connection between maps and math, using resources from activities http://math.rice.edu/~lanius/pres/map/ and materials from the US Geological Survey at http://egsc.usgs.gov/isb/pubs/teachers-packets/exploringmaps/ and http://egsc.usgs.gov/isb/pubs/MapProjections/projections.html. Page 3
  • 14. 2. Use the National Geographic lesson plan, Maps and Current Events (http://www.nationalgeographic.com/resources/ngo/education/xpeditions/lessons/03/g912 /exploremaps.html), to develop and look at modern maps with a critical eye. 3. Have students explore making mental maps of a work of fiction or of a particular topic as a different way to approach outlining and memorization. Suggested 1. NYPL online guide to the exhibit, Mapping New York's Shoreline, 1609-2009: reading/ http://www.nypl.org/research/chss/shoreline/index.html. additional resources 2. NYPL online exhibit American Shores: Maps of the Middle Atlantic Region to 1850: http://www.nypl.org/research/midatlantic/index.html and the NYPL Digital Gallery (http://digitalgallery.nypl.org/nypldigital/explore/dgexplore.cfm?topic=history&col_id=149 and http://digitalgallery.nypl.org/nypldigital/explore/dgexplore.cfm?topic=history& col_id=442). Additional historical maps. 3. The British Library's Learning Mapping History website: http://www.bl.uk/learning/artimages/maphist/mappinghistory.html. 4. The University of Southern Maine's discussion of the Mitchell Map, 1755-1782: An Irony of Empire (http://usm.maine.edu/maps/web-document/2/1/sub-/1-introduction-and- overview). NYPL has a copy of the map, available in the Digital Gallery at: http://digitalgallery.nypl.org/nypldigital/id?484185). 5. The Young Oxford Companion to Maps and Mapmaking, by Rebecca Stefoff. Oxford University Press, 1995. ISBN 0195080424, ISBN-13 9780195080421. 303 pages. Page 4