Becoming a Data Informed Nonprofit - Beth Kanter Webinar

Nonprofits spend considerable time creating and curating content to share on Twitter, Facebook, and other social networks. But most groups aren’t properly measuring whether these efforts are worth the time and cost. And it can seem like a daunting task to put together an effective strategy for collecting and analyzing data about your social-media efforts. How does one know where to begin? Beth Kanter, co-author of Measuring the Networked Nonprofit, will discuss how to measure the return on social-media investments with a FREE WEBINAR. During this free webinar, you’ll learn how to: • Do more than just count friends and followers. • Explore how to identify what data is available. • Collect and analyze these numbers so that you can make smart decisions about your social-media strategies. Beth Kanter, co-author of Measuring the Networked Nonprofit, will teach this webinar.

Empfohlen
Empfohlen
Weitere ähnliche Inhalte
Was ist angesagt?
Was ist angesagt? (20)
Andere mochten auch
Andere mochten auch (7)
Ähnlich wie Becoming a Data Informed Nonprofit - Beth Kanter Webinar
Ähnlich wie Becoming a Data Informed Nonprofit - Beth Kanter Webinar (20)
Mehr von Salesforce.org
Mehr von Salesforce.org (20)
Kürzlich hochgeladen
Kürzlich hochgeladen (20)
Becoming a Data Informed Nonprofit - Beth Kanter Webinar
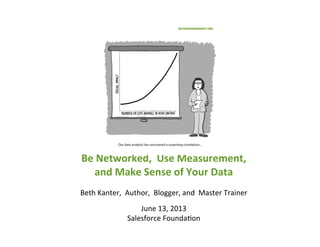
- 1. Be Networked, Use Measurement, and Make Sense of Your Data Beth Kanter, Author, Blogger, and Master Trainer June 13, 2013 Salesforce Founda>on
- 2. Beth Kanter: Master Trainer, Author, and Blogger @kanter
- 3. Who are you? ANSWER THE QUESTIONS ON THE ONLINE POLL .… Budget Size Social Media ImplementaOon Currently Measure?
- 4. Networked Nonprofits Data Informed How To Measure Agenda #netnon Ask your ques>on in the chat
- 5. Maturity of PracOce Framework: Networked Nonprofits If you can’t fly then run, if you can’t run then walk, if you can’t walk then crawl, but whatever you do you have to keep moving forward.”
- 6. CRAWL WALK RUN FLY Where is your organization? Linking Social with Results and Networks Pilot: Focus one program or channel with measurement Incremental Capacity Ladder of Engagement Content Strategy Best Practices Measurement and learning in all above Communications Strategy Development Culture Change Network Building Many Free Agents work for you Multi-Channel Engagement, Content, and Measurement Reflection and Continuous Improvement
- 7. Maturity of PracOce: Crawl-‐Walk-‐Run-‐Fly Categories PracOces Average CULTURE Networked Mindset 2.3 Ins>tu>onal Support 1.5 CAPACITY Staffing 1.8 Strategy 1.5 MEASUREMENT Analysis 1.5 Tools 2.0 Adjustment 1.8 LISTENING Brand Monitoring 1.5 Influencer Research 1.3 ENGAGEMENT Ladder of Engagement 1.5 CONTENT Integra>on/Op>miza>on 1.8 NETWORK Influencer Engagement 2.0 Rela>onship Mapping 1.3 1 2 3 4 0.0 0.5 1.0 1.5 2.0 2.5 Arts & Cultural Alliance of Central Florida LA Stage Alliance The Alliance of Resident Theatres/New York Aus>n Crea>ve Alliance Theatre Bay Area C4 Atlanta All Indicators
- 8. The Data Informed Nonprofit
- 9. Crawl Walk Run Fly Lacks consistent data collec>on Data collec>on consistent but not shared Data from mul>ple sources Org Wide KPIs No repor>ng or synthesis Data not linked to results, could be wrong data System and structure for data collec>on Organiza>onal Dashboard with different views, sharing Decisions based on gut Rarely makes decisions to improve Discussed at staff mee>ngs, decisions made using it Data visualiza>on, real-‐ >me repor>ng, formal reflec>on process CWRF: Becoming Data Informed: What Does It look like? Analysis Tools Sense-‐Making
- 10. Data-Informed Culture: It starts from the top! Do Something.org
- 11. Data Nerds Partner with Staff
- 12. Tear down those silos and walls around data …
- 13. More time think about that the data, then collect it
- 15. Video
- 19. HSUS Analysis Process: • Everyone gathers their data • We sit in a room and analyze it • The project manager develops a report of “what we did/what we learned/what we recommend for next >me “+ data Scaling Data-‐Informed
- 20. Jogging! 2011: Not Using Source Codes for All Campaigns To Measure Social Media Conversion 2013: Using Source Codes for All Campaigns To Measure Social Media Conversion
- 22. 0 20000 40000 60000 80000 100000 120000 140000 Jan-12 Feb-12 Mar-12 Apr-12 May-12 Jun-12 Jul-12 Aug-12 Sep-12 Oct-12 Nov-12 Ocean Acidification Cetaceans Gulf of Mexico MPAs Ocean Overfishing Sustainable Seafood Sharks Tuna 140,000 120,000 100,000 80,000 60,000 40,000 20,000
- 23. 0 20000 40000 60000 80000 100000 120000 140000 Jan-12 Feb-12 Mar-12 Apr-12 May-12 Jun-12 Jul-12 Aug-12 Sep-12 Oct-12 Nov-12 Ocean Acidification Cetaceans Gulf of Mexico MPAs Ocean Overfishing Sustainable Seafood Sharks Tuna 140,000 120,000 100,000 80,000 60,000 40,000 20,000
- 24. 133,167 745,030 1,683,670 0 200,000 400,000 600,000 800,000 1,000,000 1,200,000 1,400,000 1,600,000 1,800,000 Shark Week 2010 Shark Week 2011 Shark Week 2012 One Metric That Maers: Increase Shark ConservaOon ConversaOon
- 25. Audience: Ar>sts and people in their community Show the human face of ar>sts, remove the mys>que, get audience to share their favorites, connect with other organiza>ons. Focused on one channel (Facebook) to use best prac>ces to: Increase engagement by comments per post Conversa>ons that made the organiza>on more accessible Increase enrollment in classes and ajendance at events 10% new students /ajenders say they heard about us through Facebook Measurement Pilots: Small Steps
- 26. Crawl Walk Run Fly Lacks consistent data collec>on Data collec>on consistent but not shared Data from mul>ple sources Org Wide KPIs No repor>ng or synthesis Data not linked to results, could be wrong data System and structure for data collec>on Organiza>onal Dashboard with different views, sharing Decisions based on gut Rarely makes decisions to improve Discussed at staff mee>ngs, decisions made using it Data visualiza>on, real-‐ >me repor>ng, formal reflec>on process CWRF: Becoming Data Informed: What Does It look like? Analysis Tools Sense-‐Making
- 27. Where is your organiza>on? CRAWL WALK RUN FLY
- 28. How To Improve Measurement PracOce • Measurement discipline • Iden>fy small pilots and iterate • Learn and improve
- 29. Goal Audience Cost Benchmark KPI Tool Insight The 7 Simple Steps of Measurement
- 30. Define Success, Pick The Right Data Point
- 31. Outcomes Metric Increase donaOons % reduc>on in cost per dollar raised Increase donor base % increase in new donors Increase number of volunteers % increase in volunteers Increase awareness % increase in awareness, % increase in visibility/prominence, Posi>ve correla>on between increase in donors vs. visibility Improve relaOonships with exisOng donors/volunteers % improvement in rela>onship scores, % increase in dona>on from exis>ng donors Improve engagement with stakeholders % increase in engagement (comments on YouTube, shares on Facebook, comments on blog, etc. Change in behavior % decrease in bad behavior, % increase in good behavior Change in aatude about your organizaOon % increase in trust score or rela>onship score Increase in skills and knowledge of staff Learning Increase in revenue per employee, % employees understanding their roles and organiza>onal mission
- 32. Hooking Up Your Measurement Dashboard
- 33. Goal: Grow the Movement MomsRising is building a strong mulOcultural movement of people who care about family economic security and well-‐being. Need To Know KPI Are we adding new members? Increased New Members Are we losing members? Decreased Lapsed Members Are we diversifying membership? Number of Collabora>ons with mul>cultural orgs Measuring Your Content: Flying
- 34. Website Metrics Growing the Movement: Web, Email, Social Media Metrics
- 36. What do you not need to collect? Easy Hard Useful Not Useful
- 37. The Tools
- 38. • Sen>ment • Themes • Messaging Content Analysis • Antudes • Preferences • Behavior Survey Research • Reach • Engagement • Ac>on Analy>cs Pick the Right Tool for the Job
- 41. Use Your Data For Decision-‐Making
- 42. Start Small
- 43. Review your Spreadsheet for 20 Minutes Look for pajerns
- 44. Step 7 – Analyze Results Joyful Funerals Metrics Mondays Specific Time for ReflecOon and Improvement
- 45. Is the Ome you are spending on social media worth it?
- 46. Be honest – Social Media is not “free” Be transparent Given your investment, are your expected results reasonable? Compare alternate ways to achieve goals How much did it cost?
- 47. Was Your Time Worth It? Traffic Referral: Unique Views Look at Results Against Amount of Staff Time 0 20,000 40,000 60,000 80,000 100,000 120,000 140,000 160,000 180,000 0 100,000 200,000 300,000 400,000 500,000 600,000 700,000 800,000 January February March April Uniques Twijer Referring Traffic Facebook Referring Traffic
- 48. 1. Measure in context – don’t ever collect data unless you can connect it to your goals 2. Have measurement discipline 3. Pick the right measurement tool for the job 4. Build measurement capacity within your organizaOon 5. Uses measurement pilots to create a habit of collecOng and apply data and to learn 6. Do the is it worth it math! Improving Your Measurement PracOce!
- 49. Thank you! www.bethkanter.org www.facebook.com/beth.kanter.blog @kanter on Twijer QuesOons!