Changing Arctic Ocean Pathways of Freshwater Less Than 40 Characters
•
1 gefällt mir•373 views


Empfohlen
Empfohlen
Weitere ähnliche Inhalte
Was ist angesagt?
Was ist angesagt? (9)
Ähnlich wie Changing Arctic Ocean Pathways of Freshwater Less Than 40 Characters
Ähnlich wie Changing Arctic Ocean Pathways of Freshwater Less Than 40 Characters (20)
Mehr von Sérgio Sacani
Mehr von Sérgio Sacani (20)
Changing Arctic Ocean Pathways of Freshwater Less Than 40 Characters
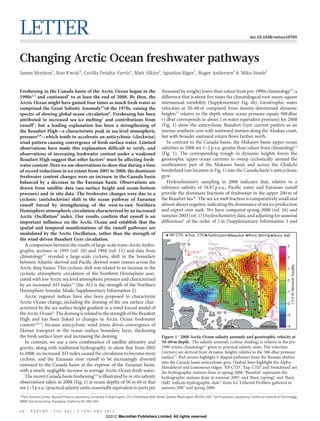
- 1. LETTER doi:10.1038/nature10705 Changing Arctic Ocean freshwater pathways James Morison1, Ron Kwok2, Cecilia Peralta-Ferriz1, Matt Alkire1, Ignatius Rigor1, Roger Andersen1 & Mike Steele1 Freshening in the Canada basin of the Arctic Ocean began in the thousand by weight) lower than values from pre-1990s climatology12, a 1990s1,2 and continued3 to at least the end of 2008. By then, the difference that is about five times the climatological root-mean-square Arctic Ocean might have gained four times as much fresh water as interannual variability (Supplementary Fig. 4b). Geostrophic water comprised the Great Salinity Anomaly4,5of the 1970s, raising the velocities at 50–60 m computed from density-determined dynamic spectre of slowing global ocean circulation6. Freshening has been heights15 relative to the depth where ocean pressure equals 500 dbar attributed to increased sea ice melting1 and contributions from (1 dbar corresponds to about 1 m water equivalent pressure) for 2008 runoff7, but a leading explanation has been a strengthening of (Fig. 1) show the anticyclonic Beaufort Gyre current pattern as an the Beaufort High—a characteristic peak in sea level atmospheric intense southern core with westward motion along the Alaskan coast, pressure2,8—which tends to accelerate an anticyclonic (clockwise) but with broader eastward return flows farther north. wind pattern causing convergence of fresh surface water. Limited In contrast to the Canada basin, the Makarov basin upper-ocean observations have made this explanation difficult to verify, and salinities in 2008 are 1–2 p.s.u. greater than values from climatology12 observations of increasing freshwater content under a weakened (Fig. 1). The corresponding trough in dynamic heights forces the Beaufort High suggest that other factors2 must be affecting fresh- geostrophic upper-ocean currents to sweep cyclonically around the water content. Here we use observations to show that during a time southeastern part of the Makarov basin and across the Chukchi of record reductions in ice extent from 2005 to 2008, the dominant borderland (see location in Fig. 1) into the Canada basin’s anticyclonic freshwater content changes were an increase in the Canada basin gyre. balanced by a decrease in the Eurasian basin. Observations are Hydrochemistry sampling in 2008 indicates that, relative to a drawn from satellite data (sea surface height and ocean-bottom reference salinity of 34.87 p.s.u., Pacific water and Eurasian runoff pressure) and in situ data. The freshwater changes were due to a provide the dominant fractions of freshwater in the upper 200 m of cyclonic (anticlockwise) shift in the ocean pathway of Eurasian the Beaufort Sea16. The sea ice melt fraction is comparatively small and runoff forced by strengthening of the west-to-east Northern almost always negative, indicating the dominance of sea ice production Hemisphere atmospheric circulation characterized by an increased and export over melt. We have compared spring 2008 (ref. 16) and Arctic Oscillation9 index. Our results confirm that runoff is an summer 2003 (ref. 17) hydrochemistry data, and adjusting for seasonal important influence on the Arctic Ocean and establish that the differences2 of the order of 1 m (Supplementary Information 3 and spatial and temporal manifestations of the runoff pathways are modulated by the Arctic Oscillation, rather than the strength of NP CTD Exp. CTD Switchyard Beaufort Buoy (spring) Buoy (fall) the wind-driven Beaufort Gyre circulation. Lomonosov ov ov A comparison between the results of large-scale trans-Arctic hydro- 70° N Alpha- ph ridge 3 Eura Mendeleyev ende eyev ndel e Ma o Makaro M arov graphic sections in 1993 (ref. 10) and 1994 (ref. 11) and data from 5 cm s–1 rid e ridge bas n basin a as sian s s s s s sia climatology12 revealed a large-scale cyclonic shift in the boundary Alaska Chukchi 2 between Atlantic-derived and Pacific-derived water masses across the borderlan borderland erlan er an b asin Salinity anomaly (p.s.u.) Arctic deep basins. This cyclonic shift was related to an increase in the 1 cyclonic atmospheric circulation of the Northern Hemisphere asso- Be ufort Beaufort ea t ciated with low Arctic sea level atmospheric pressure and characterized Sea Sea ea 0 by an increased AO index13 (the AO is the strength of the Northern Hemisphere Annular Mode; Supplementary Information 2). Ca ad Canada Canada da –1 Arctic regional indices have also been proposed to characterize basin bas bas n a Arctic Ocean change, including the doming of the sea surface char- –2 acterized by the sea surface height gradient in a wind-forced model of Canada the Arctic Ocean6. The doming is related to the strength of the Beaufort 80° N –3 High and has been linked to changes in Arctic Ocean freshwater content2,8,14, because anticyclonic wind stress drives convergence of 90° W Greenland –4 Ekman transport in the ocean surface boundary layer, thickening the fresh surface layer and increasing the doming. Figure 1 | 2008 Arctic Ocean salinity anomaly and geostrophic velocity at In contrast, we use a new combination of satellite altimetry and 50–60 m depth. The salinity anomaly (colour shading) is relative to the pre- gravity, along with traditional hydrography, to show that from 2005 1990 winter climatology12 given in practical salinity units. The velocities to 2008, an increased AO index caused the circulation to become more (vectors) are derived from dynamic heights relative to the 500-dbar pressure cyclonic and the Eurasian river runoff to be increasingly diverted surface15. Red arrows highlight S-shaped pathways from the Russian shelves into the Canada basin anticyclonic gyre. Dashed lines highlight the Alpha- eastward to the Canada basin at the expense of the Eurasian basin, Mendeleyer and Lomonosor ridges. ‘NP CTD’, ‘Exp. CTD’ and ‘Switchyard’ are with a nearly negligible increase in average Arctic Ocean fresh water. the hydrographic stations done in spring 2008, ‘Beaufort’ represents the The recent Canada basin freshening2,4 is illustrated by in situ salinity hydrographic stations done in summer 2007, and ‘Buoy (spring)’ and ‘Buoy observations taken in 2008 (Fig. 1) at ocean depths of 50 to 60 m that (fall)’ indicate hydrographic data15 from Ice Tethered Profilers gathered in are 1–3 p.s.u. (practical salinity units, essentially equivalent to parts per autumn 2007 and spring 2008. 1 Polar Science Center, Applied Physics Laboratory, University of Washington, 1013 Northeast 40th Street, Seattle, Washington 98105, USA. 2Jet Propulsion Laboratory, California Institute of Technology, 4800 Oak Grove Drive, Pasadena, California 91109, USA. 6 6 | N AT U R E | VO L 4 8 1 | 5 J A N U A RY 2 0 1 2 ©2012 Macmillan Publishers Limited. All rights reserved
- 2. LETTER RESEARCH Supplementary Figs 5 and 6), we find that the change in average 10 a Alaska freshwater inventories in the top 195 m of the Beaufort Sea are 0.6 m Canada Siberia of sea ice melt, 20.8 m of Pacific water and 3.6 m of Eurasian runoff, 8 with a total increase of 3.4 m. Only the increases in Eurasian runoff and the total inventories are substantially greater than the standard errors 6 (s.e.) of these averages, owing to the variability among stations (s.e. Canada Mendeleyev value is 0.93 m for sea ice melt, 0.3 m for Pacific water and 0.99 m for basin ridge 4 Eurasian runoff, with an s.e. value for the total of 1.12 m; see Makarov DOT trend (cm yr–1) basin Supplementary Information 3). From 2003 to 2008, the dominant 2 source of freshening is increased Eurasian runoff, especially in the depth range of 50 to 115 m (Supplementary Information 3 and Alpha Lomonosov 0 Supplementary Fig. 5), consistent with transport by geostrophic cur- ridge ridge rents extending down into the upper halocline that come cyclonically –2 around the Makarov basin into the Canada basin (Fig. 1). Combined with spot verification by hydrography15,16, dynamic Eurasian –4 basin ocean topography (DOT, deviation of the sea surface from the geoid) from the Ice Cloud and Land Elevation Satellite (ICESat) laser alti- –6 meter15 and ocean bottom pressure (OBP) from the Gravity Recovery 2 cm s–1 yr–1 and Climate Experiment Gravity (GRACE) satellites (Supplementary Greenland –8 Information 4) provide the spatial and temporal coverage needed to understand the 2005–2008 Arctic Ocean changes. OBP is the sum of −10 DOT and the steric pressure anomaly (SPA, due to changes in water 10 b Alaska density). Comparisons among satellite-derived DOT and OBP and in Siberia –3 Canada 8 situ observations of SPA have been done for temperate oceans18,19, but this is the first such effort for the Arctic Ocean. Models indicate that at 1,0 shorter than seasonal timescales, Arctic OBP variations are barotropic 6 –2 00 Freshwater content change (m yr–1) (Supplementary Information 4) and reflect DOT variations20,21. At Canada m Mendeleyev interannual and longer timescales the deep ocean response is baroclinic, basin ridge 4 Makarov OBP variations are smaller than DOT variations, and the SPA is com- basin –1 parable to 2DOT (Supplementary Fig. 7). Comparisons of ICESat 2 SPA (cm yr–1) DOT with hydrography15 (Supplementary Information 4) and with GRACE OBP confirm this for the Arctic Ocean; multiyear variations 1,0 0 Alpha Lomonosov 00 in DOT, with a fractional correction by OBP, yield the multiyear varia- ridge ridge m tions in SPA. –2 DOT from 2005 to 2008 increased at ,5–8 cm yr21 (uncertainty is 1 Eurasian standard deviation (s.d.) of 0.9 cm yr21; Supplementary Informa- -4 0m basin tion 4) in the Canada basin (Fig. 2a), resulting in anticyclonic spin- 1,00 2 up of the surface velocity. However, DOT decreased by 324 cm yr21 in -6 a trough aligned with the Eurasian continental shelf-break (seaward edge of the shallow continental shelf), resulting in increasing DOT- Greenland –8 3 gradient-driven eastward surface velocities and transport of Eurasian river water along the Russian shelf. Variations in the pattern include –10 cyclonic cells that allow for the runoff-rich coastal water to be carried Figure 2 | Rates of change between 2005 and 2008 of DOT, SPA and across the shelf and into the eastern Makarov basin and Chukchi freshwater content. a, DOT rate of change from ICESat altimetry (s.d. borderland regions. Furthermore, the increase in DOT towards the 0.9 cm yr21, Supplementary Information 4). Arrows show rate of change in Russian coast could be driving a seaward secondary flow in the bottom near-surface velocity driven by DOT. The DOT rate of change equal to GRACE boundary layer over the shelf that injects runoff-enriched water into OBP rate of change minus SPA rate of change from hydrography are shown as the upper halocline of the central basin, where we find increases in the colour-coded triangles (s.d. of difference is 1.2 cm yr21, Supplementary Fig. 10). Eurasian runoff. b, SPA rate of change (61.2 cm yr21) equal to the OBP rate of change ICESat DOT rates of change agree with those inferred from the dif- (Supplementary Fig. 9) minus the DOT rate of change (Fig. 2a) for water depths ference between GRACE OBP and the SPA from repeat hydrographic over 50 m (Supplementary Information 5). The scale labelled in red indicates stations (Fig. 2a, correlation 0.84, for number of samples N 5 19; 99% the change in freshwater content, 235.6 3 SPA (60.42 m yr21, Supplementary Information 6). confidence limits: 0.5 , correlation coefficient , 0.95); the s.d. of DOT relative to OBP minus DOT, 1.2 cm yr21, is also applicable to SPA rate of freshwater content is approximately 235.6 3 SPA (Fig. 2b). change from the difference between GRACE OBP and ICES at DOT rates Freshwater content changes are dominated by strong increases in of change (Supplementary Fig. 10). Taking the difference of the DOT and the Canada basin balanced by decreases in the Eurasian basin and OBP rates of change (Supplementary Information 4, OBP 4-year, along the Russian shelf-break, reflecting change in Eurasian runoff 42-sample, rate-of-change uncertainty5 60.37 cm yr21; ref. 22) yields pathways. estimates of SPA changes over the whole Arctic Ocean (Fig. 2b)—to The area-averaged 2005–2008 freshwater rate of change (Fig. 2b) of our knowledge the first such estimates. The increasing SPA (3–5 cm yr21) 0.04 m yr21 is almost insignificant (s.e. 0.034 m yr—1, Supplemen- in the Eurasian basin and along the Russian shelf-break balances the tary Information 6). If we consider the deep basin only (water decreasing (24 to 26 cm yr21) SPA in the Canada basin associated with depths exceeding 500 m), the average is greater at 0.18 m yr21 (s.e. declining salinity. 0.039 m yr21, Supplementary Information 6), because the 500-m SPA is negatively related to freshwater content in cold polar depth contour runs near the middle of the freshwater minimum along oceans23. The correlation of SPA and freshwater content calculated the Russian shelf-break (Fig. 2b). This is essentially equal to the rate directly for the Beaufort Sea (Supplementary Fig. 12) suggests that of change estimated for the deep basin over the previous decade3. The 5 J A N U A RY 2 0 1 2 | VO L 4 8 1 | N AT U R E | 6 7 ©2012 Macmillan Publishers Limited. All rights reserved
- 3. RESEARCH LETTER rate of change of deep-basin freshwater volume and its difference from The SLP pattern is similar to the mean SLP pattern (Supplementary the larger area average are comparable to recent rates of change in ice Fig. 2a) but strengthened and expanded westward. Eurasian runoff volume24 and variations in liquid freshwater exports25 (Supplementary leaves the Arctic directly across the Eurasian basin. In the high-AO- Information 7), illustrating the importance of observations with suf- index pattern (Fig. 4b), cyclonic motion occurs on the Russian side of ficiently broad spatial coverage (Supplementary Information 9). the Arctic Ocean, and the anticyclonic cell shifts to the southeast in the Maps of 2006–2008 sea level pressure (SLP), DOT and SPA anomalies Canada basin. Eurasian runoff is diverted eastward and off the East (Fig. 3) are consistent with variations in the AO. Just as highs in SLP Siberian shelf into the Canada basin circulation, where it can increase force convergence of near-surface Ekman transport, doming of DOT freshwater content through Ekman transport at the surface and by and deepening of isohaline surfaces, SLP lows cause divergence, geostrophic currents at depth. The dipole character of the cyclonic development of a trough in DOT and shoaling of isohalines. Whereas mode and its connection to the AO cannot be captured by the doming the Beaufort High dominates the mean SLP pattern, the AO manifests index6 because the doming criterion considers only a single DOT itself over the Arctic Ocean as a trough of low pressure extending from feature. the Greenland–Norwegian seas into the Eurasian and Makarov basins The 2005–2008 high-AO-index shift exemplifies a change in Arctic (Supplementary Fig. 2). When the winter AO index increased in 2007, Ocean characteristics that began in 1989 and largely characterized the the SLP anomaly decreased over the Eurasian and Makarov basins, next 20 years (Supplementary Information 2). Then, as in 2005–2008, reflecting the AO pattern (Fig. 3a). The trough in SLP anomaly forces the AO index increased relative to its pre-1989 average, and the trans- a trough in DOT aligned with the Russian shelf-break (Fig. 3b and polar drift of sea ice and surface water shifted cyclonically10 (Sup- Fig. 2a). The trough pattern includes upwelling of isohaline surfaces plementary Fig. 13a–f). Salinity increased in the Makarov and under the centre of the trough, as indicated by increased SPA (Fig. 3c, Eurasian basins10,26,27 and decreased in the Beaufort Sea1,2 (Supplemen- Fig. 2b). It also includes increased DOT and downwelling of isohalines tary Fig. 4a) owing to an increase in the fraction of runoff7, specifically across the Russian shelf. Raised DOT towards the coast moves fresher caused by a diversion of Eurasian runoff to the east26,27. An important runoff-rich water eastward. The average upper-ocean circulation difference is that, although the 2005–2008 Canada basin circula- patterns for 2004–2005 (Supplementary Fig. 13e) and 2007–2009 (Sup- tion was increasingly anticyclonic, it became less anticyclonic and plementary Fig. 13f) confirm in absolute terms the increased cyclonic doming decreased in the early 1990s2 (Supplementary Figs 13a–f). circulation on the Russian side of the Arctic Ocean (Figs 2a and 3b). Clearly, increased doming was not the cause of the 1990s Beaufort Our observations suggest idealized modes of Arctic Ocean circula- Sea freshening. tion (Fig. 4). In the low-AO-index mode (Fig. 4a), an expanded high in The climate implications of cyclonic AO-induced shifts in fresh- SLP drives an anticyclonic surface circulation over most of the basin. water pathways include increasing deep thermohaline convection in 2006, AO = –0.2 2007, AO = 1.3 2008, AO = 0.8 10 a ia 0.4 Ru.6 s s −1 0.4 180° Lena R −1 0.6 0 −2 8 −0.4 .5 −0 −1 0 0 0 0.8 −2 1 0.5 0.8 6 −0.2 1 0.6 −3 .5 −1 −1 −1 1.2 Yenisey R Ob R −2 .5 4 0.2 −3 −2 Makarov 0.6 1 −1 Lomonosov R 0.8 0.4 −4 Al 2 1.4 basin ph SLP (hPa) a −1 sk a- −0.5 0.8 1 1.2 −2 −1 0 M .5 Ala 1.2 0 0 en −3 −2 de 1.4 −1.5 Canada − −2 −2 le Eurasian −4 −4 ye 1.4 basin 0.2 v basin 70° N rid 80° N −4 0.6 ge −1 0.4 1.2 1.2 −6 −1 0.8 1.4 −0.5 1 −2 −2 −2.5 1.6 −4 1.4 −8 −3 −4 − Canada 90° W Greenland 0° –10 40 b 30 20 10 DOT (cm) 0 –10 −20 −30 −40 −50 40 c SPA (cm of water equivalent) 30 20 10 0 −10 −20 −30 −40 −50 Figure 3 | 2006–2008 anomalies relative to 2004–2005 averages of SLP, contribution. b, DOT (February–March) (in cm). c, SPA, equal to the DOT and SPA. a, Winter sea level atmospheric pressure from the International February–March-average OBP minus DOT. The SLP is the winter (previous Arctic Buoy Program (http://iabp.apl.washington.edu/data_slp.html). Black November–April) average. The text AO value is the winter (November–April) contours are the mean SLP anomaly relative to 2004–2005 plus the AO average anomaly relative to the 1950–1989 average winter AO. 6 8 | N AT U R E | VO L 4 8 1 | 5 J A N U A RY 2 0 1 2 ©2012 Macmillan Publishers Limited. All rights reserved
- 4. LETTER RESEARCH a b 180° 90° E 180° 90° E Lena R. Lena R. Yenisey R. Yenisey R. Low AO Russia anticyclonic mode Russia Ob R. Ob R. A′ A′ High AO cyclonic mode Lomonosov R Lomonosov R Al Al ph ph Alaska Alaska a- a- Makarov M Makarov M en Idealized ocean en basin basin de de le le circulation y y ev ev A Canada A Canada R R basin Pacific Eurasian basin Eurasian Derived basin Atlantic basin Atlantic 80° N 70° N 80° N Derived 70° N Derived Pacific Convergence of Derived Ekman transport Canada 90° W Grnlnd 0° Canada 90° W Greenland 0° A High SLP A′ A High SLP Low SLP A′ Atmosphere High DOT Eurasian runoff High DOT Low DOT Density Upper geostrophic transport Density ocean High SPA Low SPA Low SPA Runoff transport Lower Continental Continental by secondary circulation ocean shelf shelf Figure 4 | Schematic views of the idealized Arctic Ocean circulation prevailing surface geostrophic ocean circulation. The Ob, Yenisey and Lena patterns under low and high AO anomalies. At the top are plan views and at rivers are the dominant sources of runoff to the Arctic Ocean. The red, green the bottom are section views for the anticyclonic pattern for low AO index and purple arrows show the Eurasian runoff freshwater paths as indicated. (a) and the cyclonic pattern for high AO index (b). The blue arrows indicate the the Greenland Sea at the expense of the Labrador Sea, and enhancing Received 9 February; accepted 9 November 2011. sea ice melt by weakening the cold halocline layer of the Eurasian 1. McPhee, M. G., Stanton, T. P., Morison, J. H. & Martinson, D. G. Freshening of the basin27. Climate models suggest an increasing AO with greenhouse upper ocean in the Arctic: is perennial sea ice disappearing? Geophys. Res. Lett. 25, warming28, but the atmospheric models used typically produce low- 1729–1732 (1998). pressure anomalies centred over the central Arctic Ocean28–30 or show 2. Proshutinsky, A. et al. Beaufort Gyre freshwater reservoir: state and variability from a negative AO bias30 (Supplementary Information 1). Climate models observations. J. Geophys. Res. 114, C00A10, http://dx.doi.org/10.1029/ 2008JC005104 (2009). need to capture the asymmetric effect of the AO on SLP in the Arctic to 3. Rabe, B. et al. An assessment of Arctic Ocean freshwater content changes from the predict the role of the Arctic Ocean in our changing climate. 1990s to the 2006–2008 period. Deep Sea Res. I 58, 173–185 (2011). 4. McPhee, M. G., Proshutinsky, A., Morison, J., Steele, M. & Alkire, M. Rapid change in METHODS SUMMARY freshwater content of the Arctic Ocean. Geophys. Res. Lett. 36, L10602, http:// The 2005–2008 repeat hydrographic stations (Figs 2 and 3) are from the North Pole dx.doi.org/10.1029/2009GL037525 (2009). 5. Dickson, R. R., Meincke, J., Malmberg, S. A. & Lee, A. J. The ‘Great Salinity Anomaly’ Environmental Observatory (NPEO, http://psc.apl.washington.edu/northpole/) in the northern North Atlantic 1968–1982. Prog. Oceanogr. 20, 103–151 (1988). and Lincoln Sea Switchyard (http://psc.apl.washington.edu/switchyard/index.html) 6. Proshutinsky, A. Y. & Johnson, M. A. Two circulation regimes of the wind-driven airborne surveys, plus the Beaufort Gyre Exploration Project (http://www.whoi. Arctic Ocean. J. Geophys. Res. 102, 12493–12514 (1997). edu/beaufortgyre/) ship-borne surveys. Data from near the Laptev Sea shelf-break 7. Macdonald, R. W., Carmack, E. C., McLaughlin, F. A., Falkner, K. K. & Swift, J. H. are from the Nansen and Amundsen Basin Observational System (http://nabos.iarc. Connections among ice, runoff and atmospheric forcing in the Beaufort Gyre. uaf.edu/) and Fram Strait data comes from the Norwegian Polar Institute (http:// Geophys. Res. Lett. 26, 2223–2226 (1999). www.npolar.no/en/). 8. Proshutinsky, A., Bourke, R. H. & McLaughlin, F. A. The role of the Beaufort Gyre in Arctic climate variability: seasonal to decadal climate scales. Geophys. Res. Lett. 29, The spring 2008 NPEO programme (Fig. 1) included conductivity–temperature– 2100, http://dx.doi.org/10.1029/2002GL015847 (2002). depth and hydrochemistry (Supplementary Information-3) stations in the 9. Thompson, D. W. J. & Wallace, J. M. The Arctic Oscillation signature in the North Pole and Beaufort Sea regions4,16 augmented by Ice Tethered Profile buoy wintertime geopotential height and temperature fields. Geophys. Res. Lett. 25, conductivity–temperature–depth data (http://www.whoi.edu/science/PO/ 1297–1300 (1998). arcticgroup/projects/ipworkshop.html). For Fig. 1, salinity anomalies and dynamic 10. Morison, J., Steele, M. & Andersen, R. Hydrography of the upper Arctic Ocean heights relative to 500 dbar at each station are linearly interpolated, and the measured from the nuclear submarine USS Pargo. Deep Sea Res. I 45, 15–38 gradients in dynamic height determine geostrophic currents15. (1998). 11. Carmack, E. C. et al. Changes in temperature and tracer distributions within the We use GRACE monthly fields of OBP from the University of Texas Center for Arctic Ocean: results from the 1994 Arctic Ocean Section. Deep Sea Res. II 44, Space Research release 4 (dpc201012), from August 2002 to December 2009 1487–1502 (1997). (http://grace.jpl.nasa.gov/data) processed from spherical harmonic gravity co- 12. Environmental Working Group (EWG). Joint U.S.-Russian Atlas of the Arctic Ocean, efficients by the Center for Space Research following ref. 31. The values represent Oceanography Atlas for the Winter Period (National Ocean Data Center (NODC), anomalies relative to the mean from January 2003 to December 2007. We use data 1997). filtered with a 300-km half-amplitude radius Gaussian smoother. The GRACE 13. Morison, J., Aagaard, K. & Steele, M. Recent environmental changes in the Arctic. Arctic 53, 359–371 (2000). Arctic OBP has been validated with in situ pressure at the North Pole22. 14. Lique, C. et al. Evolution of the Arctic Ocean Salinity, 2007–08: contrast between We derive DOT (here filtered with a 100-km radius Gaussian smoother) as the the Canadian and the Eurasian Basins. J. Clim. 24, 1705–1717 (2011). difference between ICESat laser altimeter measurements of sea surface height in 15. Kwok, R. & Morison, J. Dynamic topography of the ice-covered Arctic Ocean from open water leads relative to the WGS84 ellipsoid and the EGM2008 geoid15. These ICESat. Geophys. Res. Lett. 38, L02501, http://dx.doi.org/10.1029/ data are available for download at http://rkwok.jpl.nasa.gov/icesat/data_topogra- 2010GL046063 (2011). phy.html. The DOT measured with ICESat in February–March 2008 are well 16. Alkire, M. B. et al. Sensor-based profiles of the NO parameter in the central Arctic correlated (correlation coefficient, rcorr 5 0.92, N 5 176, 99% confidence limits: and southern Canada Basin: new insights regarding the cold halocline. Deep Sea Res. I 57, 1432–1443 (2010). 0.884 , rcorr , 0.945) with dynamic height relative to 500 dbar calculated from 17. Yamamoto-Kawai, M., McLaughlin, F. A., Carmack, E. C., Nishino, S. & Shimada, K. 2008 hydrographic data (Supplementary Fig. 8). The resulting geostrophic surface Freshwater budget of the Canada Basin, Arctic Ocean, from salinity, d18O, and velocities show the same features derived from the dynamic heights relative to nutrients. J. Geophys. Res. 113, C01007, http://dx.doi.org/10.1029/ 500 dbar (Fig. 1)15. 2006JC003858 (2008). 5 J A N U A RY 2 0 1 2 | VO L 4 8 1 | N AT U R E | 6 9 ©2012 Macmillan Publishers Limited. All rights reserved
- 5. RESEARCH LETTER 18. Chambers, D. P. Observing seasonal steric sea level variations with GRACE and 30. Walsh, J. E., Chapman, W. L., Romanovsky, V., Christensen, J. H. & Stendel, M. Global satellite altimetry. J. Geophys. Res. 111, C03010, http://dx.doi.org/10.1029/ Climate Model performance over Alaska and Greenland. J. Clim. 21, 6156–6174 2005JC002914 (2006). (2008). 19. Willis, J. K., Chambers, D. P. & Nerem, R. S. Assessing the globally averaged sea level 31. Chambers, D. P. Evaluation of new GRACE time-variable gravity data over the budget on seasonal to interannual timescales. J. Geophys. Res. 113, C06015, ocean. Geophys. Res. Lett. 33, L17603 (2006). http://dx.doi.org/10.1029/2007JC004517 (2008). 20. Vinogradova, N., Ponte, R. M. & Stammer, D. Relation between sea level and bottom Supplementary Information is linked to the online version of the paper at pressure and the vertical dependence of oceanic variability. Geophys. Res. Lett. www.nature.com/nature. 113, L03608, http://dx.doi.org/10.1029/2006GL028588 (2007). Acknowledgements This work was supported chiefly by NSF grants OPP 0352754, 21. Bingham, R. J. & Hughes, C. W. The relationship between sea-level and bottom ARC-0634226, ARC-0856330 and NASA grant NNX08AH62G. R.K. was supported at pressure variability in an eddy permitting ocean model. Geophys. Res. Lett. 35, the Jet Propulsion Laboratory, California Institute of Technology, under contract with L03602, http://dx.doi.org/10.1029/2007GL032662 (2008). NASA. GRACE ocean data were processed by D. P. Chambers, supported by the NASA 22. Morison, J., Wahr, J., Kwok, R. & Peralta-Ferriz, C. Recent trends in Arctic Ocean MEASURES Program. We thank the NASA ICESat and GRACE programmes, K. Falkner, mass distribution revealed by GRACE. Geophys. Res. Lett. 34, L07602, http:// R. Collier, M. McPhee, W. Ermold, L. de Steur, A. Proshutinsky and the Beaufort Gyre dx.doi.org/10.1029/2006GL029016 (2007). Exploration Project, J. Toole and R. Krishfield and the Ice Tethered Profiler project at 23. Steele, M. & Ermold, W. Steric sea level change in the Northern Seas. J. Clim. 20, WHOI, and W. Smethie of the Switchyard project for the observations that made this 403–417 (2007). work possible. 24. Kwok, R. et al. Thinning and volume loss of the Arctic Ocean sea ice cover: 2003– 2008. J. Geophys. Res. 114, C07005, http://dx.doi.org/10.1029/2009JC005312 Author Contributions The main idea was developed by J.M. and R.K. J.M. wrote most of (2009). the text and with R.A. and C.P.-F. drew most of the figures. R.K. developed the DOT 25. Serreze, M. C. et al. The large-scale freshwater cycle of the Arctic. J. Geophys. Res. records. The SLP and OBP anomaly plots were originally developed by C.P.-F. The 2008 111, C11010, http://dx.doi.org/10.1029/2005JC003424 (2006). hydrography observations were made by J.M., M.A., R.A. and M.S. The AO spatial pattern 26. Ekwurzel, B., Schlosser, P., Mortlock, R. A., Fairbanks, R. G. & Swift, J. H. River runoff, data, figures and insight were provided by I.R. The hydrographic data processing was sea ice meltwater, and Pacific water distribution and mean residence times in the done by R.A. and the chemistry analysis was done by M.A. Switchyard data and Arctic Ocean. J. Geophys. Res. 106, 9075–9092 (2001). freshwater insight was provided by M.S. All authors discussed the results and 27. Steele, M. & Boyd, T. Retreat of the cold halocline layer in the Arctic Ocean. commented on the manuscript. J. Geophys. Res. 103, 10419–10435 (1998). 28. Shindell, D. T., Miller, R. L., Schmidt, G. A. & Pandolfo, L. Simulation of recent Author Information Reprints and permissions information is available at northern winter climate trends by greenhouse-gas forcing. Nature 399, 452–455 www.nature.com/reprints. The authors declare no competing financial interests. (1999). Readers are welcome to comment on the online version of this article at 29. Koldunov, N. V., Stammer, D. & Marotzke, J. Present-day Arctic sea ice variability in www.nature.com/nature. Correspondence and requests for materials should be the coupled ECHAM5/MPI-OM model. J. Clim. 23, 2520–2543 (2010). addressed to J.M. (morison@apl.washington.edu). 7 0 | N AT U R E | VO L 4 8 1 | 5 J A N U A RY 2 0 1 2 ©2012 Macmillan Publishers Limited. All rights reserved