SlideShare ist ein Scribd-Unternehmen logo
1 von 157
Downloaden Sie, um offline zu lesen
CONSU MER CHOICE
Variety in the Retail Setting


An EMBS master’s thesis, by R.T.I. van Hees.
Submitted May 24, 2012, at the University of León, Spain,
to professors I. Trevisan, S. Ganassali, R. Wagner and C. Rodriguez-Santos.
i


       Source cover figure: HSBC (2012). Expat 2011 rating of local stores and
markets. Retrieved April 15, 2012, from http://expatexplorer.hsbc.com/#/countries.


This master’s thesis was written as part of the European Master in Business Studies
(EMBS) program in partial fulfillment of the requirements for the following
academic degrees:
   − Università Degli Studi de Trento: “Laurea Magistrale - CLASSE LM77
       Lauree Magistrali in Scienze Economico-Aziendali”
   − Université de Savoie: “Master en Droit Economie Gestion”
   − Universität Kassel: “Master of Arts”
   − Universidad de León: “Master Universitario Europeo en Dirección de
       Empresas”.


All rights reserved. No part of this publication may be reproduced, stored in a
database or retrieval system, or distributed in any form or by any means, electronic,
mechanical, photocopying, recording or otherwise, without prior written permission
of the author.


Correspondence concerning this paper can be sent by e-mail to Iris van Hees at
rti.van.hees@gmail.com.
ii


                                      Abstract
       Presenting choice wisely is increasingly important in the retail sector because
choice is expanding. Many choices are of little importance and are made in a matter
of seconds when the customer is confronted with the assortment. Therefore, in store
presentation can have great influence on the amount of mental energy people expend
in deciding, whether or not they decide and what product is chosen. In the western
world choice is perceived as desirable and there are various pressures for more
choice. Preference for choice is however not only related strongly to culture, but also
to personality, involvement and context among others. The amount of variety
offered profoundly affects peoples purchasing behavior by fostering indecision
especially when customers are unsure about their preferences. Assortment size also
affects decision confidence and post-purchase satisfaction. Presenting choice can be
most effectively done when products are organized according to the consumer’s
decision tree, thereby forming the customer’s choice set and limiting the amount of
choices consciously made.
       This paper presents two empirical studies in addition to the extensive
literature review. The first study explores similarities and differences in Dutch and
American attitudes toward choice in retailers through an application of the tripartite
attitude theory. It shows that Dutch more often than Americans find that there is too
much choice and feel less benefitted by having choice. Furthermore, it provides
support for the assumption that reactions to choice are based on largely the same
perceptions and believes. The second research furthers the cross-cultural comparison
by analyzing assortment evaluations, indecision and choice satisfaction in more
detail. For the American sample many results from previous research were
duplicated. The Dutch sample, however, gives reason to believe Dutch reactions to
choice are fundamentally different and more negative. Further investigations of
Dutch perceptions of and reactions to choice showed that Dutch experience many of
the benefits and drawbacks of choice found by American research. Furthermore, it
provides insight into presentation effects in retailers, stressing the importance of
appropriate assortments and assortment organization.


       Keywords: choice, retail, assortment planning, variety growth, consumer
psychology, purchasing decisions, excessive choice, retail marketing, shelf
management
iii


                                                    List of Tables


Table 1: Types of new products. ................................................................... 17
Table 2: Choice exposure styles.................................................................... 30
Table 3: Distribution for ‘liking’ of the amount of choice in stores. .............. 66
Table 4: The believed benefits of having choice in stores.............................. 68
Table 5: Amount of respondents that did, did not and did not but
       indicated reason to complain. ............................................................ 70
Table 6: Benefits associated to choice........................................................... 89
Table 7: Extent to which negative feelings were experienced........................ 91
Table 8: Cross-tabulation of liking and given reason .................................... IV
Table 9:Cross-tabulation of whether there was perceived benefit and
       reason given. ...................................................................................... V
Table 10: Cross-tabulation of whether the respondent complained and
       given reason or mediator. .................................................................. VI
Table 11: Relationship between attitude components. .................................. VII
Table 12: Relationship between attitude components for Dutch
       respondents. ................................................................................... VIII
Table 13: Relationship between attitude components for American
       respondents. ...................................................................................... IX
Table 14: Recalled product type by nationality. ........................................ XVII
Table 15: Recalled product type by gender. .............................................. XVII
Table 16: Age of the memory by product type. ......................................... XVII
Table 17: Age of the memory and decision difficulty for Dutch. .............. XVIII
Table 18: Importance to choose right by nationality................................. XVIII
Table 19: Importance to choose right by product type. ............................. XVIII
Table 20: Product knowledge and nationality ............................................ XIX
Table 21: Product Knowledge and Importance. ......................................... XIX
Table 22: Assortment Evaluation and Nationality ........................................XX
Table 23: Assortment evaluation and satisfaction with choice......................XX
Table 24: Assortment evaluation and satisfaction with choice by
       nationality. .......................................................................................XX
Table 25: Assortment evaluation and knowledge ....................................... XXI
Table 26: Assortment evaluation and product knowledge by nationality. ... XXI
Table 27: Assortment evaluation and decision importance. ....................... XXII
Table 28: Assortment evaluation and decision importance by nationality. . XXII
Table 29: Decision ease and remembered assortment size........................ XXIII
Table 30: Decision ease and Choice set size for Americans. ................... XXIV
Table 31: Decision importance and decision ease. .................................. XXIV
Table 32: Product knowledge and decision ease. ...................................... XXV
Table 33: Decision ease by nationality. ..................................................... XXV
Table 34: Satisfaction with the made choice and decision ease by
       nationality. .................................................................................. XXVI
iv


Table 35: Satisfaction with the made choice and considering purchase
       deferral by nationality. ................................................................ XXVI
Table 36: Satisfaction with the made choice and considering postponing
       the decision by nationality.......................................................... XXVII
Table 37: Satisfaction with choice and product knowledge. ................... XXVII
Table 38: Satisfaction with choice and choice importance by nationality.XXVIII
Table 39: Ability to express identity by acceptance little variety basic
       goods. ......................................................................................... XXIX
Table 40: Choice identity and self-expression. ........................................ XXIX
Table 41: Benefits associated to choice by gender. ................................... XXX
Table 42: Assortment evaluation and appropriateness categorization. ..... XXXI
Table 43: Assortment evaluation and exceeding variety expectations...... XXXI
Table 44: Assortment evaluation and product availability. ..................... XXXII
Table 45: Assortment evaluation and special offers. .............................. XXXII
Table 46: Assortment evaluation and increased expectations. ............... XXXIII
Table 47: Difficulties deciding and self-efficacy. .................................. XXXIII
Table 48: Drawbacks to deciding factor loadings by gender.................. XXXIV
Table 49: Decision difficulty and process satisfaction. .......................... XXXIV
Table 50: Satisfaction made choice and positive surprise. ..................... XXXIV
Table 51: Positive surprise and increased expectations. ......................... XXXV
v


                                            List of Figures


Figure 1: Value added as percentage of GDP in 2010 and share of total
       businesses enterprises in 2008 in the retail and wholesale sector
       for selected EU countries. ................................................................... 6
Figure 2: Concentration ratio's in the European retail sector in
       2004/2005. .......................................................................................... 7
Figure 3: Countries of operations of five major international retailers. .......... 11
Figure 4: Number of countries with physical and online store presence
       for selected fashion retailers in 2010. ................................................ 13
Figure 5: Online retail sales as share of total national sales in 2011. ............. 13
Figure 6: Online purchases and the percentage of households that have
       Internet access in Europe and Turkey. ............................................... 14
Figure 7: Per capita sales area (in m2) in 2010. ............................................. 21
Figure 8: Number of products offered by the average grocer per category
       in 2004.............................................................................................. 24
Figure 9: Assortment depth; number of items sold by Aldi by category
       by country. ........................................................................................ 25
Figure 10: Relationship between perceived variety and likelihood of
       purchase............................................................................................ 41
Figure 11: Variety and decisions; relationships identified in the literature
       review. .............................................................................................. 54
Figure 12: Pareto chart of reasons for liking/disliking the amount of
       choice in stores. ................................................................................ 67
Figure 13: Pareto chart of believed benefits of choice. .................................. 69
Figure 14: Number of stores per 1,000 inhabitants in 2007 for selected
       countries .............................................................................................II
Figure 15: Share of grocery sales by format in Europe, 2000 vs 2004. .......... III
vi


                                List of Abbreviations


EU – European Union
GDP – Gross Domestic Product
GfK – Growth for Knowledge
ICT – Information and Communication Technology
p - Probability
POPAI – Point-Of-Purchase Advertising Institute
PPP – Purchasing Power Parity
SD – Standard Deviation
SE – Standard Error
SKU – Stock Keeping Unit
UHT – Ultra High Temperature
UK – the United Kingdom
US/USA – United States/United States of America
vii


                                       Table of Content

Abstract                                                          ii

List of Tables                                                   iii

List of Figures                                                   v

List of Abbreviations                                            vi

Table of Content                                                 vii

Preface                                                           x

Introduction                                                      1
     1.   Research Question                                       1
     2.   Preliminary Definitions                                 2
     3.   Research Methodology                                    3

1.        Industry Introduction                                   5
     1.   Sales, GDP and Industry Structure                       5
     2.   National Industry Developments                          8
     3.   Globalization                                          10
     4.   Online Ret@il                                          12

2.        Sources of Variety and the Prevalence of Choice        17
     1.   Categorizing new products                              17
     2.   Product and Brand Variety                              18
     3.   Global Assortment Sizes                                20
     4.   Store Formats and Assortments                          22
     5.   Assortment Depth                                       24

3.        Consumer Demand for Variety                            26
     1.   Sides to Variety                                       26
     2.   Exposing Oneself to Choice                             29
     3.   Maximizers and Satisficers                             31

4.        Making Purchasing Decisions                            32
     1.   The Purchase Decision                                  32
     2.   Involvement, Information Search and Decision Novelty   33
viii


     3.   In-store Decisions                                          34
     4.   In-Store Decisions and Heuristics                           36

5.        Purchasing from Variety                                     38
     1.   Product Choice and Variety                                  38
     2.   Chance of Purchase and Variety                              39
     3.   Chance of Purchase, Trade-offs and Preference Uncertainty   41
     4.   Memory and Time                                             43
     5.   Knowledge and Articulated Preferences                       45
     6.   Customization and Personalization                           47

6.        Variety and Post-Purchase Satisfaction                      50
     1.   Post-Purchase Satisfaction                                  50
     2.   Opportunity Costs and Escalation of Expectations            51
     3.   Regret and Responsibility                                   52

7.        Choice Moderation by Retailers                              55
     1.   The Retailers and Variety                                   55
     2.   Presentation Effects                                        57
     3.   Other Moderating Policies                                   59

8.        Study 1: Attitude Towards Choice                            62
     1.   Study Design                                                62
     2.   Analysis Procedure                                          62
     3.   Sampling Procedure and Sample                               65
     4.   Results                                                     65
     5.   Discussion of Results and Methodology                       73

9.        Study 2: Choice and Satisfaction                            75
     1.   Study Design                                                75
     2.   The Instrument                                              76
     3.   Sampling Procedure and Sample                               78
     4.   Analysis Procedure Cross-Cultural Study                     78
     5.   Recalled Choices                                            79
     6.   Results Cross-Cultural Comparison                           82
     7.   Discussion on Cross-Cultural Findings                       86
     8.   Analysis Procedure Study of Dutch Respondents               87
ix


  9.   Specific Results for Dutch Respondents                    88
  10. Discussion of Dutch Results                                93
  11. Discussion of the Methodology                              95

Conclusion, Recommendations, Discussion and Future Outlook       97

References                                                      100

Appendix A: Legend figure 6                                        I

Appendix B: Additional Industry Data                              II

Appendix C: Study 1; Extra Information                           IV

Appendix D: Study 2; Questionnaire American Respondents           X

Appendix E: Study 2; Questionnaire Dutch Respondents            XII

Appendix F: Study 2; Extra Information Cross-Cultural ComparisonXVII

Appendix G: Study 2; Extra Information Analysis Dutch RespondentsXXIX

Personal Affirmation in Lieu of Oath                              1
x


                                          Preface
       The classes on marketing and product innovation during the EMBS-program
made me wonder what free competition and the expansion of product alternatives
mean for the everyday consumer. To some extent consumers and their experiences
seem to have been marginalized by an academic and corporate discourse focused on
profit and sales as the main criteria for market success. The underlying and
widespread assumption is that optimized profits in competitive markets imply needs
being served in the best feasible manner. Thus, the consumers’ reaction to this
competitive approach and expansion of choice is reduced to the product they choose
to spend their money on and the amount of money that is spent. However, though
this reasoning makes sense within economic theory, in practice consumer reactions
are much more complex.
       Some of the problematic of the ongoing boom of choice were brought to my
attention by the virtue of TED.com, a nonprofit initiative that I have to thank for
providing much inspiration over the years. From amongst their many contributors
I’d like to make a special note of two speakers, namely Barry Schwartz and Sheena
Iyengar from whom I borrowed some ideas with which I started this research. Most
striking was that though we need choice to be free, not all choice increases freedom,
and the availability of many choices may in fact decrease happiness and overall
well-being.
       Fortunately, some retailers pick up on their clients’ confusion, and other
negative reactions to choice such as indecision, and attempt to reduce this by
organizing and limiting their assortments. A theoretical framework is still missing
and much of the existing knowledge has been developed inside big retail chains and
is therefore not available to their smaller competitors. This master thesis is my
contribution to both the development of a framework and increasing awareness of
the costs of choice, including time, confusion and decreased satisfaction, as well as
increasing knowledge on when and how having much choice is beneficial.
Moreover, this thesis investigates to what extent these negative effects are culturally
bound. For this surveys were spread among both Americans and Dutch revealing
some interesting similarities but more strikingly revealing profound differences. This
text should not only be helpful to retailers, but also for marketers, students and the
general public alike.
xi


       I would like to thank Melanie van der Lee for her explanation of the
workings of grocery store shelf management, a task she has carried out
professionally for many years for one of the Netherlands largest grocery chains. I
would like to thank everyone who took the time to help me with the pre-testing as
well as the respondents of my questionnaires and the two panel bureaus. Finally, I
would like to thank my parents and friends who took the time to discuss my ideas
with me and my tutors Michael Gierczak and José Luis Vazquez.


       León, Spain, May 24th, 2012,
       Iris van Hees
Introduction 1


                                        Introduction

1.   Research Question
       Whichever the form of the increase in variety, the amount of product
alternatives is profoundly interlinked with the free market responding to consumers,
as well as the globalization of demand and supply. Primarily, one may attribute this
increase in variety as a logical, expected and desired effect of the market economy
which promotes innovation and caters to the buyer’s needs. Therefore, it follows that
with this increase in choice people are able to find products that better fit their wants
and needs, will overall be getting more satisfied, and the market will, with time,
reach an optimum. However, there are some indications that this increase in choice
is taking its toll, especially when it comes to the satisfaction with the purchased
goods and services and the general consumer well-being. Therefore, consumer
reactions to the increase of choice are important to investigate, especially now that
the Internet vastly expands the amount of alternative products available to
consumers, and marketers are more and more introducing products for only limited
periods of time.
       The main question of this paper is: ‘To what extent is the amount of choice
offered by Western retailers to non-professional customers desirable?’ This
question is sub-divided as follows:
       -How pervasive is choice in retailing to non-professional consumers?
       -How does the amount of choice affect customers?
       -What are industry best-practices when it comes to presenting choice?
       -To what extent are the responses to choice similar in the USA and the
Netherlands?
       The first sub question, ‘How pervasive is choice in retailing to non-
professional consumers?’ is answered in chapters one and two. Here the history of
retail over the past 200 years is discussed as well as the progression of the amount of
choices offered by retailers. The second sub question, ‘How does the amount of
choice affect customers?’ is discussed theoretically in chapter three to six. The
discussion covers why consumers may or may not want choice, how retail
purchasing decisions are made and how choices and their outcomes are affected by
the amount and sort of alternatives available. Then chapter seven gives an overview
Introduction 2


of known industry best-practices in an attempt to answer the third sub question,
‘What are industry best-practices when it comes to presenting choice?’
       Following this theoretical framework, own research is presented as an
answer to the fourth sub-question: ‘To what extent are the responses to choice
similar in the USA and the Netherlands?’ First a look is taken at the general attitude
towards choice, followed by an investigation of assortment satisfaction, satisfaction
with made purchasing decisions and the occurrence of indecision. The final research
focus is an investigation into Dutch perceptions of and reactions to choice, focusing
on associated benefits and drawbacks as well as in-store assortment presentation.
The paper concludes with recommendations for retailers and marketers as well as
suggestions for future research and a general future outlook.


2.   Preliminary Definitions
       In the context of this thesis retailer refers to a company that is: “primarily
involved in the activity of purchasing products from other organizations with the
intent to resell those goods to private households, generally without transformation,
and rendering services incidental to the sale of merchandise” (Zentes, Morschett,
Schramm-Klein, 2011, p.1). Retailing covers all consumer products such as food,
apparel, consumer goods, financial services, leisure, etc. There are many different
retail formats, which can be split in store and non-store (IMAP, 2010). Here the
focus is on store formats and to lesser extent online stores. Non-store retailers such
as catalogues, door-to-door, telephone and direct response television are excluded.
The recommendations of this paper are equally applicable to companies that sell
their own products directly to consumers, for example through factory outlets, as
long as their target group and store formats are similar.
       A non-professional customer is whoever has the possibility to choose from
the product assortment of the store, for personal consumption, regardless of whether
or not a purchase is made.
       Choosing or making a decision in the context of this thesis, will be defined
as a response to a situation in which alternative courses of action are under
consideration and
             “the decision maker can form expectations concerning future events
     and outcomes following from each course of action, expectations that can be
Introduction 3


     described in terms of degrees of belief or probabilities. (…). The
     consequences associated with the possible outcomes can be assessed on an
     evaluative continuum determined by current goals and personal values.”
     (Hastie & Dawes, 2009, p.24).
       Finally, product alternatives are those products that by the customer are
seen as substitutes and therefore fall in the same product category. More alternatives
implying more choice and fewer alternatives providing less choice. There are
various ways to measure assortment variety within a product category. To measure
assortment depth, one can look at the number of Stock Keeping Units (SKUs) it
contains. Alternatively, to measure variety one can look at the attribute variety (see
van Herpen & Pieters, 2002, for a detailed mathematical description) also referred to
as assortment entropy (Fasolo, Hertwig, Huber & Ludwig, 2009). Attribute variety
calculations primarily rely on the amount of aspects on which products can vary and
the amount of different attributes they can take. For example, when three shirts are
offered there is more variety when they do not only differ in color but also in size.
These shirts additionally present more variety if instead of there being two colors
there are three. Here the perception of customers is crucial to determine which
product aspects do and do not create variety, for example if the stich size in these
shirts differ by .1mm very few customers, not to say none, will notice. As products
become less and less objectively different from each other some consumers may
cease to count them as possible choices. Based on this reasoning, groups of two
products can be placed on a continuum of the amount of choice they present.
Products that differ little on few attributes present little choice and products that
differ widely on many attributes present much choice. Research suggests that
attribute based variety calculations correspond better to perceived variety than SKU
based measures, however these calculations are more costly and rely more heavily
on the researcher’s judgment.


3.   Research Methodology
       This thesis is based on three distinct approaches to research. The first half is
based on literature research. This is followed by chapter seven which in part is based
on literature research, in part on an in depth interview and for the remainder on the
Introduction 4


stories of various professionals in the retail field. The last part of this thesis is based
on the qualitative and quantitative analysis of two surveys.
        The literature research is primarily based on publications in research journals
and by specialized marketing research companies. If multiple researches were found
that covered the topic preference was given to the most recent publication. When
looking at global data special emphasis was placed on both Europe, and specifically
the Netherlands, and the USA. Next to these sources also some books from the
university library, newspaper articles and conference talks were used. For some of
the data presented primarily in the earlier chapters the Eurostat and UNData
databases were used.
        Next to the literature research chapter seven on the presentation of choice by
retailers is additionally based on an in depth interview with a manager in charge off
category presentation of a large Dutch grocery retailer who has worked together
closely with the research department there. The interview took place December 28,
2011. The retailer wants to remain unnamed. For this chapter also the experiences of
some other retail professionals were used, taken mainly from thematic forums.
        The final part of this thesis resents the results of two surveys which were
developed using the presented literature and tackle various questions. The combined
sample size is over 570, including both Dutch and Americans, recruited both through
the author’s personal network as well as online panels. All quantitative analyses
were carried out using either Microsoft Excel 2010 or SPSS 17.0. For more detailed
information regarding the methodology, please see the studies’ respective
methodology sections.
        The recommendations and conclusions chapter that concludes this thesis is
based on all research presented, and as said before aims to provide practitioners with
a more profound understanding of the problematic as well as concrete tools to
counteract possible downsides of choice.
Industry Introduction 5


                          1. Industry Introduction
          Before discussing how consumers are affected by the increasing amount of
choice in Western countries, it is important to have established that consumers are
faced with increasing amounts of product alternatives, and before that we need to
have an image of the retail industry and its development. Therefore, this chapter
provides an introduction to the global retail industry, with a special focus on the
USA and Europe.
          As covered in the general introduction, the retail industry is comprised of
those individuals and companies that sell finished products to the consumers, and the
sector can be subdivided in food, soft (clothing) and hard goods (IMAP, 2010).
Although in some cases the manufacturer is also the retailer, typically product
distribution is carried out by specialized companies. Products are either sold directly
from the manufacturer to the retailer, or through wholesalers. Often specialized
services such as storage, transportation and ICT are outsourced. The industry is labor
intensive and has a moderate to use of capital (Michigan State University, 2012).
Retail competition is mainly price based, but also location, assortment, store lay-out
and reputation matter.


1.   Sales, GDP and Industry Structure
          In 2009 global retail sales were 13.9 trillion dollars, compared to 7 trillion in
2000 (IMAP, 2010; Deloitte, 2002). However, total retail sales are closely related to
Gross Domestic Product (GDP), because personal incomes minus saving rate and
plus lending, are spent in retail, insurance, services, rent, water, electricity, gas and
investments. In Europe retail spending was between 27 to 40% of private spending
in 2009, in Russia as much as 60%, and in the US approximately 50 to 55% (GfK,
GeoMarketing, 2010; the Office of Consumer Affairs, 2011). The amount of this
which was spent on food differs between countries, and to some extent reflects
welfare. According to Lasserre (2007) in Western European countries spending on
food was between 30 and 40% of total retail spending in 2003, in the US this share
was lower (27%) and in Asian countries this was higher (46% in Japan and 59% in
China).
Industry Introduction 6


                 Due to the close relationship between retail sales and GDP the added value
       of the industry as a percentage of GDP is a better measure of its size. The value
       added by the retail industry (including wholesale, restaurants and hotels is on
       average 15.7% of GDP (own calculations based on 2010 data of 207 countries
       retrieved from UNData). The added value of wholesale, retail, restaurants and hotels
       over GDP has shown a constant drop since the 1970’s, being 16.2% in 1970, 16.1%
       in 1980, 15.8% in 1990, and 15.7% in 2000 (based on data from 183, 183, 214 and
       209 countries respectively). In 2010, the lowest contributions of retail to GDP was in
       oil producing countries, such as Kuwait, Saudi Arabia and Qatar with 4 to 5%, and
       the highest in islands and city states such as Monaco and islands such as Barbados
       with 35 to 39%.

       Figure 1: Value added as percentage of GDP in 2010 and share of total businesses
       enterprises in 2008 in the retail and wholesale sector for selected EU countries.

           20%                                                                             45%
           18%                                                                             40%


                                                                                                 % of total enterprises
           16%                                                                             35%
           14%                                                                             30%
           12%
                                                                                           25%
% of GDP


           10%
                                                                                           20%
            8%
            6%                                                                             15%
            4%                                                                             10%
            2%                                                                             5%
            0%                                                                             0%
                  Czech Republic

                          Estonia


                        Romania
                         Slovenia
                         Slovakia
                         Belgium


                         Portugal


                 United Kingdom
                        Germany

                            Spain
                             Italy


                     Luxembourg
                         Hungary


                          Finland
                          Sweden

                         Norway
                         Bulgaria


                           Latvia
                        Lithuania


                          Austria
                          Cyprus


                  the Netherlands


                      retail enterprises   wholesale enterprises   total value added

       Source: Calculated based on Eurostat and United Nations data (UNData).
                 On average 14.5% of European GDP is added value from the wholesale and
       retail industry. This is 1.2% lower than the world average. The relative GDP
       importance of the wholesale and retail sectors in various European countries, as
       visualized in figure 1, is spread between 8.8% in Norway and 18.6% in Portugal.
       Also the amount of enterprises active in the retail or wholesale industry relative to
       the total amount of enterprises differed widely between the countries. In some, such
Industry Introduction 7


as Slovakia, Germany and Finland there were relatively few, while in Bulgaria and
Romania there were relatively many. On average 22.4% of European enterprises are
retailers or wholesalers.

       Comparing the GDP contribution to the amount of companies in the sector
shows that especially in Bulgaria and Romania retail firms on average contribute
relatively little, a finding supported by Wrigley and Lowe (2010) who analyzed
concentration of the European retail markets (see figure 2). Data from Nielsen
(2010a) shows 5-firm concentration ratios of 97% in Australia, 95% in New
Zeeland, 76% in Hong Kong, 57% in Taiwan, 32% in Korea and 9% in China.
Globally the top 250 retailers had a market share of slightly more than 27% in 2009
(Deloitte, 2009), showing that few decision makers have an influence over the daily
shopping experience and consumption habits of a large part of the global population,
though their reach differs greatly from country to country.

Figure 2: Concentration ratio's in the European retail sector in 2004/2005.


Source: Wrigly and Lowe (2010).

       In the retail industry there increasingly is a divide between very small and
very large companies, a trend that will be discussed in more detail later this chapter.
While, as said before, the largest companies have large market shares the majority of
registered retailers is very small. Data from Haskel, Jarmin, Motohashi and Sadun
(2007) shows that the majority of enterprises in the retail sector had only one
establishment in 2002 (95% of firms in Japan and the US and 94% of firms in the
UK). The size of companies with more than one establishment varies more widely
Industry Introduction 8


cross countries. In Japan firms with more than one establishment on average have 7,
in the UK 8 and in the US 13. This indicates that the US retailers are much more
consolidated than their Japanese and English counterparts. This difference in chain
size and concentration can largely be explained through recent sector developments
that have also driven the globalization of the sector, and will be elaborated upon
shortly.


2. National Industry Developments
         Over the last two centuries the manner in which people purchase their food,
beverages and other supplies in the Western world has changed drastically (see
Wrigley & Lowe, 2002 for an extensive discussion of the changing retail structures).
Previously almost always separate retailers, such as vegetable stores, butchers,
bakers, milkmen and grocers, merged into new store formats such as department
stores, super- and hypermarkets under the influence of growing urban middle
classes, rising ownership of cars, fridges and freezers and mass production
(Mooijman, 2004; Wraigley & Lowe, 2002; Seth & Randall, 2001; Tat Keh & Park,
1997).
         For this format change the invention of the ‘self-service’ supermarket in the
1937 was crucial (Wrigley & Lowe, 2002). Self-service is slowly spreading from
Western markets such as the US, where approximately 85% of sales are self-service,
to Asia (53%) and countries such as India (6%; Nielsen, 2010a). Furthermore, other
aspects of modern retailing have emerged after 1900, such as pre-packaged foods,
window displays, advertising, and clear, fixed pricing (Alexander & Akehurst,
1998). Also the automation of payments, both through the introduction of barcodes
as well as checks and electronic payment methods, and the automation of stock
keeping and supply chain management have allowed for an increase in labor
productivity and the creation of economies of scale.
         This increase in store size is also known as the retail life cycle. The retail life
cycle relates store type to maturity of the economy, and to maturity of the retail
sector in particular (Zentes, Morschett & Schramm-Klein, 2011). As time progresses
the store formats become larger and larger offering more and more alternatives, both
in depth and breadth, two assortment aspects that are explained in the next chapter.
The point where stores become smaller again seems to not have been reached yet.
Industry Introduction 9


       The increase in store size was paralleled by a dramatic decrease in the
amount of grocers per citizen from the start of the 1900 to now, which is logical as
larger stores need a larger customer base to be sustainable. Data from Haskel,
Jarmin, Motohashi and Sadun (2007) shows that in 1997 there were approximately
11 stores per 1000 inhabitants in Japan, 5 stores per 1000 inhabitants in the UK and
4 stores per 1000 inhabitants in the US. Comparing this to their data of 2002, and
data from Euromonitor (2009) of 2007 shows a negative trend (see Appendix A for
statistics for 2007 for a wide selection of countries). This trend is undoubtedly
influenced by the rise of modern store formats such as that of Walmart who’s stores
are only viable with a minimum customer base of 150,000 (Lasserre, 2007).
       Data from the Netherlands shows that this is not just a recent trend. Where at
the start of the nineteenth century there was one grocer for each 200 people in 2001
there was on average 1 grocer per 850 people, and by 2005 1 for each 1,000 (Betje
Boerhave, 2011). Although many of the smallest villages have found local stores
disappearing, and distances to stores increasing this decrease in stores per
inhabitants did not lead to fewer stores being available to most people. Because
towns and cities grew and the range that consumers could easily travel increased as
well. People were often faced with both more and larger stores, especially in cities
serving as regional retail centers (Mooijman, 2004). Thus, as the stores became
bigger, most consumers found that the amount of stores at which they could buy a
product increased.
       The growth in store size was combined with the rise of chain stores.
Modernized larger retailers gained a competitive advantage over less modernized
smaller firms, and mainly in the 1980’s and 1990’s independent grocers started
disappearing while chains gained market share (Wrigly and Lowe, 2010). In the
Netherlands which in 1990 still had over 60,000 independent grocers in 2010 only
around 20,000 were left (Deloitte, 2011). And as 35.3% of independent grocers with
a turn-over below 75,000 euros per week indicated in July that year to expect to go
out of business within the next five years this trend is likely to continue. At the same
time large chains report no such fears and the largest three holdings (each owning
multiple retail firms) now have an 85.7% market share. Also the three main
discounters do well, with a combined market share of 19%.
       Concentration led to a power shift from manufacturers to distributor chains
(Wrigly and Lowe, 2010). In the same 1980’s to 1990’s period the ICT revolution
Industry Introduction 10


allowed for more buyer-driven supply chains and retailers introduced lean methods
of supply chain management. These developments allowed retailers, such as Tesco,
to reduce stock days from 45 in 1978 to around 15 from the 1990’s onward.


3. Globalization
       Retail globalization has a long history; the first ‘modern’ retailers to
internationalize were luxury, specialty and department stores, which between 1880
and 1945 opened stores in cosmopolitan cities (Alexander, 1997). Furthermore,
between 1960 and 1974 many leading Western European retailers started to look to
other countries for growth and invested both in neighboring countries as well as the
USA. In this period Carrefour expanded to Spain, and Ahold to the USA. Then, after
a period of downturn and economic shocks, not only did the Western European
retailers restart international investments between 1983 and 1989, but also the
Japanese started investing in both markets.
       Real retail globalization started in the 1990’s, with those retailers that had
concentrated, automated and introduced lean systems (consisting mainly of Western
European and American firms) exporting their expertise to countries in which
retailers had not yet done so (Wrigly & Lowe, 2010; Alexander, 1997). They thereby
mainly focused on countries in their own region as a consequence of the
development of regional trade blocks such as the NAFTA, the European Single
Market and the opening up of Eastern European and Asian countries. For example,
the number of retail establishments in Eastern Europe owned by Western European
firms increased from 28 in 1991, to 1,800 in 2002 (Igan & Suzuki, 2011).
       Figure 3, shows how some leading retailers have expanded internationally
over the last decades. As their success relies mainly on their competitive advantages
outlined before, this globalization has put a firm stamp on the retail industry, by
concentrating retailers and modernizing the business models to include ICT and new
forms of supply chain management. Moreover, internationalization has enlarged and
homogenized store formats, presentation, management and product selections. This
effect is especially strong in those countries that do not have ‘modernized’ retail
sector. Of course, this process of change takes time, and thus the largest
Westernization and preference for larger store formats can be observed in countries
Industry Introduction 11


such as Poland, the Czech Republic, Hungary and Slovakia, and to a lesser extent in
countries such as Bulgaria, Romania, Ukraine and Russia (Igan & Suzuki, 2011).


Figure 3: Countries of operations of five major international retailers.


Source: IGD (2009).
       The top 250 largest global retailers are still actively internationalizing,
though as shown in figure 3 Ahold has reduced the amount of countries drastically.
The international share of sales of the largest retailers has steadily increased from
near zero in the early 1990’s, to 22.2% in 2009 (Deloitte, 2011). However, the
industry remains less globalized than for example consumer products, hospitality,
telecommunications and entertainment (Deloitte, 2009).
       Overall, American retailers, though leading in sales revenue, are less
globalized then their European counterparts. In 1999 four of the USA’s ten largest
retailers only operated in the domestic market, and the other six had foreign sales
ranging between 0.5 and 18.4% (Ashfaq, n.d.). The average was 11.1% of foreign
sales for those of six top 10 US retailers that were internationally active. A number
that, when taking the top 10 US retailers regardless of their foreign activity, drops to
7.6% of foreign sales over total sales. In 2011 only two of the top 10 American
retailers did not have foreign sales (Schulz, 2011). The average part of foreign sales
was 16.7% for the whole top 10, and 19.6% when only taking into account the 8
internationally active ones. This increase was for a large part due to the increase in
international activities of Walmart, the largest retailer in the world, which increased
foreign sales from 13.9% to 27.1% by 2011.
Industry Introduction 12


       The top European retailers in 1999 had a larger share of international sales,
for example the French Carrefour had 37.7% foreign sales, ITM Enterprises SA.
36%, the German MetroAG 40% and the Dutch company Ahold 76.4% (Ashfaq,
n.d.). Also in 2009 European retailers where more globalized than their American
counterparts with more than one-third of sales revenue came from foreign operations
(Deloitte, 2011). This difference likely originates from the fact that European
companies have smaller home markets and can easily internationalize due to the
European Single Market.


4. Online Ret@il
       The latest big development in the retail industry has been the rise of online
selling. During the dot-com bubble in the late 1990’s many solely-online retailers
appeared (Wrigley & Lowe, 2010). However, these online retailers did not initially
cause the market disruption that was expected by many. Instead, e-commerce
became dominated by the online channels of traditional retailers, referred to now as
the ‘bricks and clicks’ model (see figure 4 for some examples from the fashion retail
sector). Also many online stores made alliances with mortar and brick stores as they
found that having a physical store boosts their online sales.
       Though not growing as fast as originally expected, online retailing has
obtained a large market share. By 2009 global online sales were 348.6 billion US
Dollars, 2.5% of global retail sales (IMAP, 2010). Of these 22.6% were electronics,
other often sold items include books, fashion, airline tickets and software. The
online market is however not limited to these. For example in the UK online grocery
shopping is rather developed with 19% of adults having used the service in 2009.
       The largest e-commerce market is the US with 37.2% of online sales. In the
US approximately 7% of sales revenue was earned through online channels. Second
largest are UK e-commerce sales, constituting ⅓d of total e-commerce sales in
Europe (Alisson, 2011). As can be seen in figure 5 the UK is also the country with
the highest relative share of online sales, followed by Germany and most of
Northern Europe.
Industry Introduction 13


Figure 4: Number of countries with physical and online store presence for selected
fashion retailers in 2010.


 Number of countries with online delivery


                                                                 Number of countries with physical store

                                            Source: Cushman and Wakefield (2011).

Figure 5: Online retail sales as share of total national sales in 2011.

 14%
                                                                                                                     12,0%
 12%

 10%                                                                                                  8,7%   9,0%
                                                                                        8,2%   8,0%
             8%                                                           6,9%   7,3%

             6%                                                    5,1%

             4%                                    3,1%   3,5%

             2%                             1,3%

             0%


                                            Source: Redrawn from the Center for Retail Research (n.d.)
                                            Not only has e-commerce grown rapidly over the last two decades, it also has
a large, 16.1%, predicted growth rate for 2012 (IMAP, 2010). Forrester (2012)
predicts sales growth rates of 11 to 12% in mature e-commerce countries such as
Industry Introduction 14


          Japan, South Korea and Australia, a 25% growth in China and 57% in India between
          2011 and 2016.
                                                                    In 2008 an overwhelming majority of Internet users in South Korea (99%),
          UK (97%), Germany (97%), Japan (97%) and the US (94%) had experience with
          online retail (Achille, 2008). Within Europe, especially countries in the west and
          north, such as the Netherlands, the UK, and Sweden are predicted to have large
          shares, approximately 80%, of their population, including those without Internet
          access, shop online by 2015 (Alison, 2011). In southern European countries, such as
          Italy, Spain and Greece, this percentage will be substantially lower, around 50%.
          Logically, there is a strong relationship between Internet access and experience with
          online retail, which is demonstrated in figure 6.

          Figure 6: Online purchases and the percentage of households that have Internet
          access in Europe and Turkey.
% of households making an online
                                   Purchase in the past 12 months


                                                                                          % of households with Internet access

          Note:                                                     see   Appendix    A    for   a   legend   to    the   country   abbreviations.
          Source: Cushman and Wakefield (2011).

                                                                    When comparing Europe as a whole to Internet shopping in other continents,
          Nielsen (2010b) found that Internet shopping is more or less equally popular in all
          countries. Approximately 84% of connected users have some experience with online
Industry Introduction 15


retailers. The exception to this is the Middle East, Africa and the Pakistan where
relatively many (50%) Internet users have not yet bought items online.
       For consumers, retailers and manufacturers alike the rise of online retail has
made decisions more complex. For retailers and manufacturers multi-channeling has
become increasingly important strategically, as a balance needs to be found between
the offer in physical stores and that in online channels (IBM, 2002). In 2008 61%
researched products online but purchased it in a store, and 56% researched products
in the store and bought it online (Gaffney, 2009).
       With the rise of online retailing it has become impossible for consumers to
inform themselves about all options available to them (IMAP, 2010). The
assortments of online stores are often more category specific and thus relatively deep
and lesser known brands are more dominant. When a consumer decides to use the
Internet as shopping channel almost instantly many more stores come available to
him or her. In 2010 close to one-third of European online shoppers made purchases
online outside of their home country. Similarly, in the US, over 25% purchased
items from retailers based outside of the US thorough online channels. This share
was one-third Among US consumers aged 18–24. However, language barriers
persist and delivery is sometimes geographically limited.
       Consumers that do not purchase online are often influenced by information
on the Internet as they read customer reviews and look up customer ratings. In the
first quarter of 2010 in Europe 19% of those with Internet access use these sources
of information at least once a month and 46% of Internet users feel these ratings help
them reach decisions (Western Europe Technographics Survey Q1 2010 as cited by
IMAP, 2010). Reviews were consulted most frequently for consumer electronics,
cars and software (Nielsen, 2010b). During the early stages of the Internet
consumers started generating content on rating and review sites and feedback portals
have been created. These were later followed by discussion forums, consumer blogs,
Micro-community sites, audio and video blogs and what have become known as
‘social media’ such as Facebook and Twitter. The latest development in this area is
the increased availability of these sources of information within the traditional
retailers as mobile phone Internet connections continue improving and special apps
are designed.
       In conclusion, the retail industry is of great economic importance in almost
all countries, and comprises many companies in each country. Though the majority
Industry Introduction 16


of companies in the industry are small there are also many large players that have
gained dominance over their supply chains. Over the past two centuries the industry
has seen many changes, such as the rise of self-service, the introduction of ICT
systems, the concentration and globalization of its companies and the rise of online
retailing. The globalization of retailers has had as main drivers the retailers need for
growth opportunities and the export of best practices, and the latter has had a great
influence on countries with less developed internal retail markets, such as Eastern
Europe.
       From the consumer’s perspective there has been an increase in store size, and
the effects of urbanization and more widespread personal means of transportation
have been that more stores have become available to most. This is especially true
with the rise of e-retailing, which provides everyone with an Internet connection
access to more retailers than are present in their village or region. Keeping this first
image of the retail industry and its development in mind the following chapter will
discuss what changes have increased product variety and how much choice
consumers are faced with. The latter will be done through an examination of store
sizes, formats and assortments sizes.
Sources of Variety and the Prevalence of Choice 17


         2. Sources of Variety and the Prevalence of Choice

1. Categorizing new products
       The previous chapter has described the changes in the retail industry,
however also the products that are sold have fundamentally changed over the last
century. All increase in variety has originated from the introduction of ‘new’
products. According to Tat Keh and Park (1997) new products can be categorized as
shown in table 1. Based on this framework, for the purpose of this paper three
sources of product variety are discussed in more depth, namely supplier variety,
product variety and branding.

 Table 1: Types of new products.


Source: Tat Keh & Park (1997).
       Firstly, product origin variety has expanded for products due to
improvements in transportation and increasing international trade. To illustrate this
Sources of Variety and the Prevalence of Choice 18


consider that in 1989 the US imported many goods, such as agricultural products,
from an average of 12 different supplying countries (Mostashari, 2010). In 2007
these same products were imported from an average of 16 different countries. This is
a measure for product variety as instead of offering only French red wine, also
Brazilian, Spanish and South-African red wine are now available. Similar increase in
variety was demonstrated by Broda and Weinstein (2004), who found that while in
1972 products were imported into the US from an average of 31.4 different
suppliers, by 1997 this had increased to 42.7 suppliers. A trend they also found for
European countries as well as Hong Kong, Mexico, the former Soviet Union,
Singapore, Taiwan and Brazil. Data on Europe shows that the same trend continued
during the 1995 to 2007 period as well (Jubiläumsfonds der Österreichischen
Nationalbank, 2009, as cited in Foster, Poeschl, & Stehrer, 2008).
       A striking feature of this trend is that the goods that importers source from
the fewest countries (petroleum and other fuel oils, coal, and wheat) are all generic
goods (Broda Weinstein, 2004). Similarly goods that are sourced from many
countries (e.g., medicines, specialized industrial machinery, and motor vehicle parts)
are likely to be quite differentiated when it comes to producing countries. This is
possibly due to their lesser relationship to natural resources and increasing
importance of human capital and intellectual property rights.
       This trend of increasing supplier variety, paradoxically, was probably
possible only thanks to suppliers increasing their production levels through
consolidation and economies of scale (Philpott, 2007; Howard, 2006). Thus, while to
the consumer more supplier variety became available, increasingly large and few
globalized producers were supplying. The same goes for the retailers. Due to
urbanization and increased consumer mobility, consumers are able to go to more
different stores. However, the same chains are present in many towns, and more
recently have an increasingly global presence, reducing the total variety of retailers
(Wrigley & Lowe, 2002). Most recently, Internet retailing has made many more
stores and products available to consumers all around the world.


2. Product and Brand Variety
       Secondly, over the past years variety in (available) products has expanded.
Broadly, these products can be split into three general groups: those that are
Sources of Variety and the Prevalence of Choice 19


modified, those that are newly available and those that are newly invented. Milk is a
product of which the diversity has increased over the past 100 years through product
modification, as it developed from a product that was sold from door-to-door to a
grocery store item. Not only can one now buy (cow) ‘milk’, but one chooses
between whole, semi skimmed, skimmed, a specific % of fat, organic, flavored,
pasteurized, sterilized, ultra high temperature (UHT), evaporated, condensed,
filtered, dried, homogenized and, if lucky, the original untreated (or ‘raw’) milk.
Furthermore, the product has also been modified by changing the containers. One
can buy milk in differently sized and shaped containers, containers that can be made
of a variety of materials, such as carton, plastic and glass, to be opened in a variety
of manners. Product innovation may well go beyond functional satiation and move
products from being necessity to luxury goods (Baudisch, 2006).
       Other sources of increasing product variety are new inventions, creating not
only variety in existing product categories, but at times add product categories as
well. All consumer electronics, including light bulbs and telephones have been
developed over the last 200 years (Acton, 1994; Boyer, 2001). Also many
consumables are relatively new such as energy drinks as well as many cleaning and
personal hygienic products (Rouse, 2010; Holmes, 2001; Romanowski, 1998). New
introductions are often produced for little more than a year, creating an ever
changing stream of new products (Swartz, 2004).
       Finally, there are newly available products. For example previously localized
products have spread across the globe. Food and other perishable products are a
good example as they could spread only after the revolution in freight. Since then
the markets have been flooded with foreign foods such as bananas and rice.
Furthermore, this combined with evolving production methods has made it possible
for various seasonal fruits and vegetables, such as grapes, strawberries, sweet
peppers and tomatoes to be in ready supply all throughout the year. Especially
globalized retailers benefit from this as they can use their local procurement
networks to purchase local specialties cheaply.
       Branding has been another source of variety. Brands can introduce
differences that were not perceived before. Often this is achieved by associating the
brand with characteristics that objectively have little or no relationship to the
product. How brands introduce the perception of variety is most easily shown when
looking at how products from one manufacturer are rebranded and sold as
Sources of Variety and the Prevalence of Choice 20


alternatives, such as for example the Albert Heijn and Etos1 private brand shampoo.
Brands can also exaggerate the existing differences, as happens for example with
flour, sugar or milk. At other times brands can mask variety, as products from
various producers or products that are adapted to local tastes are sold under the same
name. A good example of this is coca cola which does not quite taste the same
everywhere.


3. Global Assortment Sizes
          The various mechanisms in which new products become available together
resulted in 5,694 new grocery store items and 10,558 new varieties in 1988 (Borin,
Farris & Freeland, 1994). In 1998 20,000 grocery store items were released of which
11,000 food products (Nestle, 2002; Garg, Jones & Sheedy, 1999). Of these
introductions 1,200 (6%) were new products or line as well as brand extensions, the
rest products had existed before but had yet not been locally available.
          With the introduction of 20,000 new products a year stores have almost
limitless possibilities for assortment growth (as most stores have assortments of less
than 4,000 items). And to accommodate these new products retailers have grown
assortments over the past decades. To get an impression of how much choice has
expanded for the average consumer we consider the assortment size of a grocer.
According to Garg, Jones and Sheedy (1999) and Nestle (2002) while the average
US grocery store carried an average of 9,000 items in 1974, in 1980 this had risen to
15,000 and by 1997 the average store sold as many as 30,000 items. According to
firstresearch.com (2005) the average US grocery store carried 40,000 different
items, in 2008 the average number of items had risen to almost 47,000 (Minesota
Grocers Association, 2011). Thus assortment sizes more than trebled over the course
of the past three decades.
          Not in all countries have such large levels of assortment been reached
(Nielsen, 2010c). In fact, grocery stores in the US on average have the largest
assortments. In China, Brazil, Mexico and Argentina the average store carries only a
little over one third of the items in their US counterparts (approximately 11,000),
and European countries such as France and the UK are in the middle (with stores on
average carrying 15,000 and 20,000 SKUs respectively).

1
    Both brands are owned by Ahold
Sources of Variety and the Prevalence of Choice 21


       This does not mean that all stores have such large assortments. When looking
at retailers in the USA Bishop (2010) found that half of them had between 2,000 and
3,500 items in their assortment in 2009. 20% had less than 2,000 items and only
23% of the stores had more than 4,001 items. Unfortunately, the amount of countries
for which data on the average amount of SKUs in stores is available is very limited.
Therefore, to quantify the amount of choice offered to people in various countries
some researchers have used sales area as a proxy for the size of the assortments, as
the more products one sells the more space is needed (Hunneman, 2011; Arnold,
Ruth & Tigert, 1981). Sales area per capita is however no more than a proxy as
presentation method and the size of items displayed impacts the sales area per capita
greatly.

Figure 7: Per capita sales area (in m2) in 2010.

 1,8
 1,6
 1,4
 1,2
   1
 0,8
 0,6
 0,4
 0,2
   0


Source: adapted from Jahn & Müller (2011).

       The US has the world’s largest sales area per capita, with an average of 3.86
m2 of retail space per inhabitant in 2008 (Hill, 2009). India, on the other hand, with
0.19 m2 per capita, may well have the lowest sales area per capita, while
simultaneously many Indians work in retail (Khanna, 2008). Data for Europe can be
found in figure 7, where ‘Northern EU’ includes Norway, Sweden, Finland and
Denmark, and ‘Eastern EU’ Slovenia, Czech Republic, Croatia, Estonia, Poland,
Slovakia, Hungary, Lithuania and Latvia. Austria and the Netherlands have
relatively many square meters per capita, while Russia, Turkey, Bulgaria and
Romania have relatively few.
Sources of Variety and the Prevalence of Choice 22


       Comparing this data on the retail area per capita in 2010 as reported by Jahn
and Müller (2011) to the purchasing power per capita in thousands for 2010 as
reported by the International Monetary Fund (2011), we find that the two are
moderately correlated (r(32) = .55, p < .001). People that can spend more also tend
to have more store space, and thus most likely more choice. Furthermore, both retail
sales area and purchasing power have increased over the last two decades, reflecting
the growth in the amount of available product alternatives.
       Eurostat provides more insight in the sales area by providing data on the total
sales area per store size category for 2007. This data shows that within Europe small
stores are especially frequent in Portugal, Austria, France, Spain and Greece, with
70-90% of all sales area in stores less than 120 m2 and 90-95% under 399 m2 (own
calculations). In Denmark, Finland, Norway, Germany and the Netherlands stores
with a size up to 399 m2 own between 70-90% of all sales area and also larger
formats are frequent. The UK has most large format sales area, with under 55% of
sales area in stores smaller than 399 m2, and 16% in stores of more than 10,000 m2.
In Eastern Europe, Bulgaria, Czech Republic, Latvia, Lithuania, Hungary, Romania,
Slovakia and Estonia, there is a dual preference with 45% of total sales area
belonging to stores less than 120 m2 and 46% in stores between 1,000 and 2,500 m2.
This situation is much different from for example that of India, where 96% of its 12
million small retailers are smaller than 47 m2 (Khanna, 2008).


4. Store Formats and Assortments
       Assortment size can be split in breadth, the amount of categories, and depth,
the amount of different items per category (Zentes, Mirschett &Schramm-Klein,
2011). Stores with deep assortments are called specialty stores, while stores with
broad assortments are diversified. Stores such as book stores, audio visual stores, pet
stores, vegetable stores, butchers, bike stores, home improvement stores and clothing
stores are specialty stores, while hypermarkets and department stores fall in the
diversified category. This split between specialty and diversified stores should be
treated as a continuum. Globally category mitigation is an increasing trend, with
retailers’ positioning themselves as specialist in a few categories, while also having
a couple of other shallow categories to their assortment. Furthermore, for example
department stores have both deep and broad assortments, while a small news stand
Sources of Variety and the Prevalence of Choice 23


or a convenience store has relatively little breadth and little depth. In 2009 in Europe
79% of retail companies using store formats were specialized (own calculations
based on Eurostat data). This percentage was higher for continental Western Europe
(between 84 and 94%) and much lower for Eastern Europe, where on average only
55% was specialized.
       Assortment breadth and size together determine store format (detailed
explanations of each store format can be found in Zentes, Mirschett & Schramm-
Klein, 2011). When looking at the US and Western Europe, department stores have
by large the broadest assortments, namely around 100,000 often subdivided in five
or more broad product categories. The second largest assortments are found in
hypermarkets which carry between 50 and 80,000 items (Levy & Weitz, 2009). Off-
price and ‘do it yourself’ stores on average carry 50,000 items, and home
improvement stores and category specialists carry between 20 to 40,000 items.
Discount stores carry 30,000 items, and drug stores 10 to 20,000. Conventional
supermarkets have around 10,000-15,000 items, and specialty stores which offer the
most service have on average 5,000 items. Hard discounters are the smallest with on
average 1,000 SKUs. Off-price and drug stores have the least space per item, while
home improvement stores have the most.
       For grocery sales Lassere (2007) found that while in the USA hypermarkets
are more than four times as popular as supermarkets and convenience stores and
almost twice as popular as discounters. This situation is much different in other
countries. Research by Igan and Suzuki (2011) shows that in most European
countries three grocery store formats dominate, namely hypermarkets, supermarkets
and discounters (see Appendix B, figure 15). These formats widely differ on their
assortment sizes and in 2004 the most popular were supermarkets with an average
market share of 40%, and least popular discounters with a market share below 10%
in many markets. Hypermarkets were popular in countries such as France, Germany
and the Czech Republic. Discounters were mainly popular in Germany and the
countries around it, such as Austria, Hungary, Belgium and Denmark. Also
convenience stores are popular in Germany.
Sources of Variety and the Prevalence of Choice 24


5. Assortment Depth
       However, all this tells us relatively little about how many product
alternatives a customer is faced with when making a purchase. To answer this
question we turn to assortment depth. Fasolo, Hertwig, Huber and Ludwig (2009)
examined differences in assortment sizes between one large and one small
supermarket in Germany. For the twelve identified common categories they found
that the large grocer always offered more choice than the smaller one. Where the
large store on average offered 54 varieties the small one offered only 7. On average
there were 8.6 times more options available in the large store. The difference was
smallest for toast, where the large grocer offered nine varieties and the small one six,
and largest for butter, where the small one had one variety and the large one 20. The
most extensive assortments were found for yogurt (210 and 26 varieties
respectively) and jam (138 and 13 varieties respectively). They found that large
assortments had more attribute levels (not more attributes) and were able to maintain
product difference by offering larger attribute ranges.
       A cross -cultural analysis of assortment depth was made by Einarsson
(2007), who analyzed the amount of products offered by grocers in various
countries. Higher amounts of choice were found in France and Finland than in for
example Norway (see figure 8). These data however are highly unrepresentative, as
all countries have many different store formats, which in turn differ on the
assortments offered. Also the amount of variety within each category is influenced
by the local popularity of the category. Furthermore, what one may count as variety,
another observer may not, such as Rubens apples, six pre-packaged Rubens apples
and 1 kilogram pre-packaged Rubens apples.

Figure 8: Number of products offered by the average grocer per category in 2004.

 300

 200

 100

   0
            Diary           Meat          Beverages       Cold cuts        Average

               Denmark     Finland    Iceland   Norway     Sweden     France


Based on: Einarsson (2007).
Sources of Variety and the Prevalence of Choice 25


       There is some cross-cultural data available when it comes to the hard-
discounter Aldi (Nielsen, 2007). Assortment depth in these stores is highest in
Austria and in the south of Germany, while being lower in Denmark, France and the
Netherlands (see figure 9).

Figure 9: Assortment depth; number of items sold by Aldi by category by country.

 10     8,3                            8,7
  8                                             6,7               6,7       6,6
                  5,2         5,3                        5,3
  6
  4
  2
  0


Source: redrawn from Nielsen (2007).
       It can be concluded that over the past decades the assortments offered to
consumers have expanded as many new products have and continue to enter the
markets. Approximations based on grocery stores show that the amount of products
on offer has increased with more than 50% over the last decade, and the rise of the
almost unlimited online assortments only add to this. Choice is especially abundant
in the US and Western Europe. The country with the largest stores in Europe is the
UK and also in Eastern Europe large formats have been increasingly popular. Within
Europe the largest preference for small stores can be found in Southern Europe.
Nowadays consumers are confronted with thousands of articles in most store formats
and in large grocers even tens of thousands. The amount of choice is however hard
to quantify, and the importance of category definitions when assessing choice can be
seen clearly when comparing the amount of products per category of the Aldi data
discussed before with those of Einarsson (2007).
       For now this concludes the discussion of retailers as we lay our focus on the
customers, and specifically how and where they make purchasing decisions.
Furthermore, the effects of variety during and after the purchase are explored with
the objective to form a culturally sensitive model of the interactions between variety
and purchase satisfaction.
Consumer Demand for Variety 26


                  3. Consumer Demand for Variety

1. Sides to Variety
       In chapter two it has been detailed how choice has extended over the last 200
years. Furthermore, some data was provided on store size preference. This chapter
will explain why diversity is often wanted by consumers and thus provides reasons
for why stores have different assortment sizes from country to country.
       When choices are repeated two opposite tendencies manifest themselves as
consumers ask themselves whether to stick with the favorite or to vary (Fishbach,
Ratner & Zhang, 2011). Variety seeking is especially dominant in products
consumed for hedonic reasons. Choosing variation is often internally motivated by
(expected) satiation, the need for new stimuli and to avoid having a boring image in
favor of an interesting and unique one. Furthermore, when consumers are new to a
product category they may try to get more familiar and knowledgeable through trial.
On the opposite side, however, consumers also seek stability and consistency and are
motivated to demonstrate loyalty. This is especially strong when during the initial
choice the consumer believes he has made some form of commitment. The extent to
which consumers pursue variety seeking or commitment strategies is dependent on
amongst others their expected satiation and cues in the purchasing environment.
       A reason for variety is that even though people may have stable preferences,
or even be brand dependent, different people prefer a different brand. Godin (2003)
relates the existence of specific product preferences to product class diversity. He
asserts that product categories that have ‘otakus’, a Japanese term referring to people
obsessed with a specific product comparable to connoisseurs, become more diverse.
This is because otakus do not only try out as many different varieties as possible, but
also tell their friends about it effectively increasing product class involvement.
Furthermore, they encourage people to express strong brand and product
preferences, and increase the importance of choice.
       Whether or not people try to establish uniqueness or stability choosing is
related to identity. Chernev (2004) reports that an individual’s preference for product
choice is positively related to the extent to which this choice is perceived to affect
identity. Moreover, preference for choice is higher when self-image is centered on
the notions of autonomy and independence. The relationship between demand for
Consumer Demand for Variety 27


choice and identity increases in importance when decisions are communicated to
others (Ratner and Kahn, 2002).
       In Western cultures having choice, of which the freedom to control
individual purchasing is a core pillar, is highly valued (Schwartz, 2004). Research in
healthcare shows that 95.6% of the 823 respondents found having choices extremely
important and 30.3% thought that making choices was extremely important (Leotti,
Iyengar & Ochsner, 2010). In agreement with this, another research shows that both
animals and humans display a preference for choice over non-choice even when
outcomes in both situations are the same, and making the second choice will require
extra effort. Also choosing between more alternatives is reported to be more
enjoyable and attractive than choosing between a more limited set (Iyengar &
Lepper, 2000). Furthermore, neuroscience has shown that results that are obtained
through choice are more gratifying than rewards that did not involve choice.
       Research has demonstrated a direct link between freedom, or better said its
opposite namely confinement, and variety seeking. Levav and Zhu (2009)
demonstrated that customers in aisles with less width seek more diversity than
customers in broader aisles. Furthermore, they are more likely to choose lesser
known brands. This difference in variety seeking was associated to the extent to
which they felt physically confined. In fact, the aisle width does not need to be
changed to create this felt confinement. Primers, such as questions about the aisle
width, are sufficient to increase variety seeking. It is important to notice that aisle
width had no effect on peoples expressed mood.
       Preference for choice in part reflects the general belief that more choice leads
people to do better. This belief primarily relies on the logic that as the amount of
alternatives increases, it is likely that some of the added alternatives are closer to the
optimal solution than the alternatives in the original set were (Chernev, 2004). There
is some research suggesting that there are limits to the amount of choice people find
attractive. Arunachalam, Henneberry, Lusk and Norwood (2009) found that when
American students were asked whether they’d like to choose from a set of 24 types
of soda or a set of six containing a random selection of the larger set, 42% of the 45
students indicated to prefer choosing from the smaller set. In addition whether or not
people like and do better on tasks involving choice depends on culture and does not
directly transfer to cultures in which group decision making, and decision making by
authorities are preferred (Iyengar, 2010). For example, Japanese children perform
Consumer Demand for Variety 28


better when their mothers have chosen for them, while American children perform
better when choosing themselves.
       An additional cultural source for different perceptions of choice is exposure
to communism (Iyengar, 2010). For example elderly Eastern Europeans often
associated choice with fear, as they had gotten used to not having any choice and
had to adapt relatively quickly to the amount of choice offered in modern market
economies. Although the development of most European countries, including
Western Russia, was very similar for many centuries this changed when communism
gained popularity. Communism, with its radically different production scheme relied
much less on consumer demand to pull the market. And though there was marketing
under these systems as well, they were much more product type rather than brand
focused.
       As all skills are learned through culture, people that come from cultures that
promoted the availability of few or no brand alternatives may now experience more
difficulties discerning differences between various products and may therefore have
more problems determining their preference as well as experience more trouble
deciding on what to purchase. For example Iyengar (2010) found that many
Russians did not perceive any difference between different types of soda when they
were offered Coca Cola, Coca Cola Diet, Sprite, Dr. Pepper, Pepsi, Pepsi Diet and
Mountain Dew. Rather they perceived this choice as ‘soda’ or ‘no soda’. When
offered the choice between these seven sodas, orange juice and water this was
perceived as three alternatives, namely juice, water or soda. Americans on the other
hand perceive each type of soda as a separate alternative. This is just one example of
how the perception of variety varies and shows how “the value of choice depends on
our ability to perceive differences between the options” (ibid. 11:47-11:55). A study
from Boyd and Bahn (2009) shows that ability to perceive variety indeed is related
to assortment preference. Those who perceive little variety prefer assortments that
offer less choice and those that perceive much variety prefer assortments offering
more choice. When choosing right becomes more important this difference in
preference becomes more pronounced.
       Fisher (1984) suggests that consumer preferences may diverge as societies
become more affluent. As not having anything becomes less and less of a concern,
people shift their attention to address satiation, thereby generating preference for
choice. This is supported by our earlier finding of the positive relationship between
Consumer Demand for Variety 29


the amount of choice in retail stores and purchasing power. Moreover, people that
are faced with more choice have more chance to develop articulated preferences.
And as more concrete preferences leads to increased preference for choice (in an
experiment by Chernev, 2004, that will be discussed in more detail later) in demand
driven economies a self-reinforcing cycle could drive choice to expand.
       Consumer demand for variety varies per country, consumer group, person,
and product category. A study by Rozin, Fischler, Shields and Masson (2006) of the
opinions of over 6,000 respondents shows that preference even within the western
world differs substantially. In France, Germany and Switzerland approximately 30%
of the population prefers choosing from 50 flavors of ice cream over choosing from
10. In Italy and the UK this percentage is higher (39 and 44 respectively). In the US
the preference for the larger assortment is highest (56%). A similar pattern was
found for restaurant menu size expectations, with around 20% of French, German
and Swiss respondents expecting many, compared to 29% of Italians, 40% of
English and 36% of Americans. A weak correlation was found between the two. For
all countries older respondents were less likely to prefer having much choice.


2. Exposing Oneself to Choice
       Of course, consumers do not expose themselves to the same amount of
choice for each decision. I fact most consumers actively choose either to expose
themselves to choice or to avoid it. Kahn and Isen (1993) found that people look for
more variety when they are in a good mood. Consumers that consistently expose
themselves to as much choice as possible for the majority of choices they make are
referred to as maximizers. The differences between maximizers and satisficers will
be discussed shortly. First, however, a more comprehensive overview of choice
exposure strategies is given.
       Haynes, Pipkin, Black & Cloud (1994) define six types of exposure style
profiles based on a research on maternity apparel store patronage of 100 pregnant
women (see table 2). First of all, there are shoppers, people with this profile know
many stores selling the item, considered visiting many of these and visit many as
well. These shoppers are highly involved, and show high interest in and enjoyment
of the shopping process. Their attitude towards planning shopping trips is very
positive. They are motivated little by the functionality (the search for information,
Consumer Demand for Variety 30


negotiation, purchase etc.) and more by the symbolic (the effects on self-image and
expectations related to social roles) and experiential (experiences resulting from the
experience) aspects of shopping. In line with this they are relatively little product
and price oriented. Demographically, this group includes the relatively old, wealthy
and well-educated.

Table 2: Choice exposure styles.


Source: Haynes, Pipkin, Black & Cloud (1994).

       Secondly, there are narrowers. These people also know a lot of stores, but
considered substantially less and visited even fewer. They are unlikely to want to
plan shopping trips and are hardly motivated by the symbolic value of shopping.
Narrowers pay more attention to brand than the average consumer and focus less on
value for price. This group has no particular demographic profile, except that they
tend to be relatively more career oriented.
       Thirdly, apathetics have low awareness of which stores are available,
consider few stores and visit few stores. They are young and the most career
focused, however have little income and little education. They put little emphasis on
the experiential side of shopping, are highly product oriented, care relatively little
about price, and want the store to have relatively much product knowledge.
       Fourth, loyals are highly involved with shopping which they value for its
functionality; shopping allows them to get good value for money. While they know
the fewest stores, they visit a moderate amount, showing interest in those stores
Consumer Demand for Variety 31


which allow them to get the most out of their limited income. The fifth group, late
bloomers, are similar to loyals but know, consider and go to more stores. They are
likewise motivated by functionality, however instead of product involvement they
are concerned with reducing price and time taken.
       The final group is the avoiders. Customers in this group dislike shopping the
most, have little involvement in the shopping process and get little satisfaction from
the process nor its outcomes. Although they know a moderate amount of stores they
consider and also visit the least. Their income levels are high, and they view
shopping as necessary and uninteresting.


3. Maximizers and Satisficers
       The decision whether to stop searching once a product with desired
characteristics is found or to evaluate all available alternatives in an effort to make
the best possible decision effectively determines exposure to choice. Swartz (2004)
defines maximizers as people that “seek and accept only the best” (p.77), the
alternative to which is satisficing; settling for the alternative that meets the criteria
without worrying that another option may be better. Though maximizing-satisfying
can be constructed as a general personality trait, it is unlikely for a person’s
maximizing tendency to be fixed across product categories. Furthermore, there is an
interrelation with the extent to which people know what they prefer, a characteristic
which is further discussed in chapter 5.
       For maximizers every purchase has to be the best purchase that could be
made, and therefore maximizers attempt to evaluate as many alternatives as are
available to them and consequently take longer to decide. In addition Schwartz,
Ward, Monterosso, Lyubomirsky, White and Lehman (2002) found that maximizing
was correlated with the amount of social comparisons made and the frequency of
counterfactual thinking during the purchase process.
       In conclusion, want for choice and reactions to choice are culturally,
personality and circumstance dependent. The following chapters will investigate
choice more in depth, with a particular emphasis on choosing from variety.
Making Purchasing Decisions 32


                   4. Making Purchasing Decisions

1. The Purchase Decision
       In the following chapters the focus will be on the customer’s purchasing
decisions and the effects of variety on their satisfaction with and after the purchase.
The following chapter will take a look at both theory as well as findings on
purchasing decisions. Firstly, the rational decision process will be discussed,
followed by differences between rebuys and new purchases. The frequency that
people make in store decisions, as well as what kind of decisions these are and how
they are made is covered in the last two sections.
       All purchasing decisions start with people recognizing that they want or need
a product; followed by a search for information as well as an evaluation of the
alternatives based on set criteria (see Christ, 2008 for a more elaborate discussion of
each stage). This can be followed by the purchase of a product, which then is
evaluated during use. The decision making process outlined above is a rational one,
in which the consumer mentally evaluates the alternatives, maximizing the expected
utility (Hastie & Dawes, 2009). However, consumers are also influenced by other
factors, including moods, emotions, the consumer’s habits, imitation of a role model
and perceived cultural mandates.
       For example, when working memory is occupied with as little as
remembering seven digits 63% of participants chose chocolate cake, while
participants that only had two digits in their working memory chose chocolate cake
only in 43% of cases (Shiv & Fedorikhin, 1999). This shows that when working
memory is occupied, people more easily make choices in favor of physically
pleasing alternatives, because the rational mind is too occupied to control impulses.
       For reaching a decision especially the information search and evaluation of
alternatives stages are important. During these stages consumers make a (mental)
ranked list of the relevant products available to them and their characteristics. The
size of the evoked set (the mental list of alternatives) is not unlimited, as working
memory cannot contain an infinite number of items, nor evaluate the items that it
does contain on many aspects simultaneously, this is also known as bounded
rationality (Hoyer, 1984). In a classic study by Miller (1956) he asserts that we can
remember only a limited amount of information, more or less the size of seven digits
or ‘chunks’ (the smallest meaningful memory units, including letters, acronyms,
Making Purchasing Decisions 33


numbers, colors, etc.) if we focus on one characteristic. If we focus on more
characteristics the total amount of what we remember goes up, while the amount of
items remembered per category goes down, and also the accuracy of our memory
goes down. There are some techniques people use to increase the sets they can
handle, such as making relative judgments, increase the amount of dimensions, or
split the decision. People can also write the options down, as well as commit
knowledge to their long term memory.


2. Involvement, Information Search and Decision Novelty
       Consumers do not go through the full decision process for each purchase as
extensively. A combination of two purchase characteristics seems to largely
determine the extent to which people engage in the search for information and
evaluate the various alternatives (Christ, 2008). These two characteristics are
involvement and decision novelty. These two characteristics combined lead to four
different types of purchasing decisions. Decisions that have been made repeatedly
before and are considered uninvolving and are referred to as routine purchases or
straight rebuys. Purchases that are relatively uninvolving but novel are called minor
new purchases, and purchases that are relatively involving and have not been made
before are called major new purchases. Finally, there are relatively involving
repeated purchases.
       When making routine purchases customers rely on a previous purchasing
decision for their current product choice, minimizing cognitive effort (Hoyer, 1984).
They have found the product which satisfies them, may feel a certain loyalty to this
product, but most importantly give little thought to alternative products. Routine
purchases allow customers to completely ignore approximately 75% of the items on
the shelves (Swartz, 2004). Customers planning a routine purchase may still be
persuaded to evaluate other alternatives when there is a sales promotion. Also when
an item is out of stock, customers have to make either a minor new purchase, visit
another store or come back later. Under these conditions it may be found that what
was thought to be an uninvolving product is involving after all. Routine purchases
are discussed in more detail in the following section.
       A second type of purchasing decision is customers making a minor new
purchase. As the product is neither expensive nor highly involving they make use of
Making Purchasing Decisions 34


limited problem solving. Consumers making these types of decisions are unlikely to
search information before entering the store and are likely to buy whichever product
alternative is offered as long as it meets their requirements and the price does not
exceed their expectations. A common decision strategy, the use of heuristics, is
discussed later in this chapter.
       Finally, there are major purchases, which in the case of non-professional
consumers are unlikely to be re-buys as major purchases within one product
category are rather infrequent. Furthermore, if there is a need to make a large
purchase more than once this is often due to product failure, in which case
alternatives will be considered. When customers are faced with major purchases, due
to high involvement and/or high prices, they are likely to take much time for each
decision making step evaluating many of the offered options in detail, visiting
multiple stores and search online for information (Beatty & Smith, 1987).


3. In-store Decisions
       Approximately two out of three purchases involve in-store decision making
(Inman, Winer & Ferraro, 2009). The MacFadden Communications Group LLC
(1996) reports more details for the mass merchandising retail sector based on a
sample of 1,399 American consumers. Namely, 41.5% of home furnishing purchases
were found to be decided in store. Domestics, such as towels, blankets and table
linens were often bought spontaneously with 48% of purchases being unplanned.
Also electronics were often (40%) decided upon in the store. In store decision
making in this context was defined as those consumers that either have no or only a
general idea as to what they are seeking, but have not yet decided on the product
they want.
       The Point-Of-Purchase Advertising Institute (POPAI, 1995, as cited in
Shimp, 2008) reports that items with particularly high in-store decision rates in
supermarkets were first aid (93%), toys, crafts and sporting goods (93%),
housewares (90%), stationary (90%) and candy (89%). For mass merchandise
purchases high in-store decision rates were found in the following categories apparel
accessories (92%), foils and other food wraps (91%), hardware electric and
plumbing (90%), infant and toddler wear (90%) and garbage bags (88%). Examples
of product categories with exceptionally low in-store decision rates for supermarkets
Consumer Choice; Variety in the Retail Setting.

Weitere ähnliche Inhalte

Ähnlich wie Consumer Choice; Variety in the Retail Setting.

Master's Thesis Ivan Sabato -- LinkedIn
Master's Thesis Ivan Sabato -- LinkedInMaster's Thesis Ivan Sabato -- LinkedIn
Master's Thesis Ivan Sabato -- LinkedInIvan Sabato
 
The Compatibility of Irish Political Parties with their Political Groups in t...
The Compatibility of Irish Political Parties with their Political Groups in t...The Compatibility of Irish Political Parties with their Political Groups in t...
The Compatibility of Irish Political Parties with their Political Groups in t...Cillian Griffey
 
Major Project - 1415246 Intercultural conflicts
Major Project - 1415246 Intercultural conflictsMajor Project - 1415246 Intercultural conflicts
Major Project - 1415246 Intercultural conflictsAlexandre Lopez
 
Toward a New Social Contract – Taking on Distributional Tensions in Europe an...
Toward a New Social Contract – Taking on Distributional Tensions in Europe an...Toward a New Social Contract – Taking on Distributional Tensions in Europe an...
Toward a New Social Contract – Taking on Distributional Tensions in Europe an...Stockholm Institute of Transition Economics
 
Comparative tests of Fama-French Three and Five-Factor models using Principal...
Comparative tests of Fama-French Three and Five-Factor models using Principal...Comparative tests of Fama-French Three and Five-Factor models using Principal...
Comparative tests of Fama-French Three and Five-Factor models using Principal...Eric Lai
 
Identifying Key Social Media Strategies for FMCG Brands to Influence Consumer...
Identifying Key Social Media Strategies for FMCG Brands to Influence Consumer...Identifying Key Social Media Strategies for FMCG Brands to Influence Consumer...
Identifying Key Social Media Strategies for FMCG Brands to Influence Consumer...Prachi Salvi
 
2153 12557-health drink-report
2153 12557-health drink-report2153 12557-health drink-report
2153 12557-health drink-reportSonu Singh
 
Wb violence in_the_city
Wb violence in_the_cityWb violence in_the_city
Wb violence in_the_cityURRworkshop
 
Campaigning for the MDGs: Making Votes and Voices Count in Elections
Campaigning for the MDGs: Making Votes and Voices Count in ElectionsCampaigning for the MDGs: Making Votes and Voices Count in Elections
Campaigning for the MDGs: Making Votes and Voices Count in Electionsendpoverty2015
 
Haiti" World Bank Public Expenditure Management and Financial Accountability ...
Haiti" World Bank Public Expenditure Management and Financial Accountability ...Haiti" World Bank Public Expenditure Management and Financial Accountability ...
Haiti" World Bank Public Expenditure Management and Financial Accountability ...Stanleylucas
 
Research paper - Brand engagement through participatory media
Research paper - Brand engagement through participatory mediaResearch paper - Brand engagement through participatory media
Research paper - Brand engagement through participatory mediaHelen Mitchell
 
Todd Boedeker Thesis
Todd Boedeker ThesisTodd Boedeker Thesis
Todd Boedeker ThesisTodd Boedeker
 
VicgovtabledreportMental_Health_Report_FCDC2012
VicgovtabledreportMental_Health_Report_FCDC2012VicgovtabledreportMental_Health_Report_FCDC2012
VicgovtabledreportMental_Health_Report_FCDC2012Ingrid Ozols
 

Ähnlich wie Consumer Choice; Variety in the Retail Setting. (20)

Master's Thesis Ivan Sabato -- LinkedIn
Master's Thesis Ivan Sabato -- LinkedInMaster's Thesis Ivan Sabato -- LinkedIn
Master's Thesis Ivan Sabato -- LinkedIn
 
The Compatibility of Irish Political Parties with their Political Groups in t...
The Compatibility of Irish Political Parties with their Political Groups in t...The Compatibility of Irish Political Parties with their Political Groups in t...
The Compatibility of Irish Political Parties with their Political Groups in t...
 
Major Project - 1415246 Intercultural conflicts
Major Project - 1415246 Intercultural conflictsMajor Project - 1415246 Intercultural conflicts
Major Project - 1415246 Intercultural conflicts
 
Master Degree Capstone
Master Degree CapstoneMaster Degree Capstone
Master Degree Capstone
 
Toward a New Social Contract – Taking on Distributional Tensions in Europe an...
Toward a New Social Contract – Taking on Distributional Tensions in Europe an...Toward a New Social Contract – Taking on Distributional Tensions in Europe an...
Toward a New Social Contract – Taking on Distributional Tensions in Europe an...
 
Dmkg assignment final
Dmkg assignment finalDmkg assignment final
Dmkg assignment final
 
Us engleski jezik i
Us   engleski jezik iUs   engleski jezik i
Us engleski jezik i
 
Developing Institutional Capacities of Public Administration for the Achievem...
Developing Institutional Capacities of Public Administration for the Achievem...Developing Institutional Capacities of Public Administration for the Achievem...
Developing Institutional Capacities of Public Administration for the Achievem...
 
Comparative tests of Fama-French Three and Five-Factor models using Principal...
Comparative tests of Fama-French Three and Five-Factor models using Principal...Comparative tests of Fama-French Three and Five-Factor models using Principal...
Comparative tests of Fama-French Three and Five-Factor models using Principal...
 
Identifying Key Social Media Strategies for FMCG Brands to Influence Consumer...
Identifying Key Social Media Strategies for FMCG Brands to Influence Consumer...Identifying Key Social Media Strategies for FMCG Brands to Influence Consumer...
Identifying Key Social Media Strategies for FMCG Brands to Influence Consumer...
 
2153 12557-health drink-report
2153 12557-health drink-report2153 12557-health drink-report
2153 12557-health drink-report
 
TDC-Does-Growth-Equal-Gain
TDC-Does-Growth-Equal-GainTDC-Does-Growth-Equal-Gain
TDC-Does-Growth-Equal-Gain
 
Wb violence in_the_city
Wb violence in_the_cityWb violence in_the_city
Wb violence in_the_city
 
Rand rr4212 (1)
Rand rr4212 (1)Rand rr4212 (1)
Rand rr4212 (1)
 
Campaigning for the MDGs: Making Votes and Voices Count in Elections
Campaigning for the MDGs: Making Votes and Voices Count in ElectionsCampaigning for the MDGs: Making Votes and Voices Count in Elections
Campaigning for the MDGs: Making Votes and Voices Count in Elections
 
UNCTAD - Creative Economy - A feasible development option
UNCTAD - Creative Economy - A feasible development optionUNCTAD - Creative Economy - A feasible development option
UNCTAD - Creative Economy - A feasible development option
 
Haiti" World Bank Public Expenditure Management and Financial Accountability ...
Haiti" World Bank Public Expenditure Management and Financial Accountability ...Haiti" World Bank Public Expenditure Management and Financial Accountability ...
Haiti" World Bank Public Expenditure Management and Financial Accountability ...
 
Research paper - Brand engagement through participatory media
Research paper - Brand engagement through participatory mediaResearch paper - Brand engagement through participatory media
Research paper - Brand engagement through participatory media
 
Todd Boedeker Thesis
Todd Boedeker ThesisTodd Boedeker Thesis
Todd Boedeker Thesis
 
VicgovtabledreportMental_Health_Report_FCDC2012
VicgovtabledreportMental_Health_Report_FCDC2012VicgovtabledreportMental_Health_Report_FCDC2012
VicgovtabledreportMental_Health_Report_FCDC2012
 

Kürzlich hochgeladen

8447779800, Low rate Call girls in Tughlakabad Delhi NCR
8447779800, Low rate Call girls in Tughlakabad Delhi NCR8447779800, Low rate Call girls in Tughlakabad Delhi NCR
8447779800, Low rate Call girls in Tughlakabad Delhi NCRashishs7044
 
Call Girls In Radisson Blu Hotel New Delhi Paschim Vihar ❤️8860477959 Escorts...
Call Girls In Radisson Blu Hotel New Delhi Paschim Vihar ❤️8860477959 Escorts...Call Girls In Radisson Blu Hotel New Delhi Paschim Vihar ❤️8860477959 Escorts...
Call Girls In Radisson Blu Hotel New Delhi Paschim Vihar ❤️8860477959 Escorts...lizamodels9
 
Call Us 📲8800102216📞 Call Girls In DLF City Gurgaon
Call Us 📲8800102216📞 Call Girls In DLF City GurgaonCall Us 📲8800102216📞 Call Girls In DLF City Gurgaon
Call Us 📲8800102216📞 Call Girls In DLF City Gurgaoncallgirls2057
 
2024 Numerator Consumer Study of Cannabis Usage
2024 Numerator Consumer Study of Cannabis Usage2024 Numerator Consumer Study of Cannabis Usage
2024 Numerator Consumer Study of Cannabis UsageNeil Kimberley
 
Pitch Deck Teardown: Geodesic.Life's $500k Pre-seed deck
Pitch Deck Teardown: Geodesic.Life's $500k Pre-seed deckPitch Deck Teardown: Geodesic.Life's $500k Pre-seed deck
Pitch Deck Teardown: Geodesic.Life's $500k Pre-seed deckHajeJanKamps
 
Call Girls In Sikandarpur Gurgaon ❤️8860477959_Russian 100% Genuine Escorts I...
Call Girls In Sikandarpur Gurgaon ❤️8860477959_Russian 100% Genuine Escorts I...Call Girls In Sikandarpur Gurgaon ❤️8860477959_Russian 100% Genuine Escorts I...
Call Girls In Sikandarpur Gurgaon ❤️8860477959_Russian 100% Genuine Escorts I...lizamodels9
 
NewBase 19 April 2024 Energy News issue - 1717 by Khaled Al Awadi.pdf
NewBase  19 April  2024  Energy News issue - 1717 by Khaled Al Awadi.pdfNewBase  19 April  2024  Energy News issue - 1717 by Khaled Al Awadi.pdf
NewBase 19 April 2024 Energy News issue - 1717 by Khaled Al Awadi.pdfKhaled Al Awadi
 
Call US-88OO1O2216 Call Girls In Mahipalpur Female Escort Service
Call US-88OO1O2216 Call Girls In Mahipalpur Female Escort ServiceCall US-88OO1O2216 Call Girls In Mahipalpur Female Escort Service
Call US-88OO1O2216 Call Girls In Mahipalpur Female Escort Servicecallgirls2057
 
Buy gmail accounts.pdf Buy Old Gmail Accounts
Buy gmail accounts.pdf Buy Old Gmail AccountsBuy gmail accounts.pdf Buy Old Gmail Accounts
Buy gmail accounts.pdf Buy Old Gmail AccountsBuy Verified Accounts
 
The CMO Survey - Highlights and Insights Report - Spring 2024
The CMO Survey - Highlights and Insights Report - Spring 2024The CMO Survey - Highlights and Insights Report - Spring 2024
The CMO Survey - Highlights and Insights Report - Spring 2024christinemoorman
 
Global Scenario On Sustainable and Resilient Coconut Industry by Dr. Jelfina...
Global Scenario On Sustainable  and Resilient Coconut Industry by Dr. Jelfina...Global Scenario On Sustainable  and Resilient Coconut Industry by Dr. Jelfina...
Global Scenario On Sustainable and Resilient Coconut Industry by Dr. Jelfina...ictsugar
 
8447779800, Low rate Call girls in Kotla Mubarakpur Delhi NCR
8447779800, Low rate Call girls in Kotla Mubarakpur Delhi NCR8447779800, Low rate Call girls in Kotla Mubarakpur Delhi NCR
8447779800, Low rate Call girls in Kotla Mubarakpur Delhi NCRashishs7044
 
/:Call Girls In Indirapuram Ghaziabad ➥9990211544 Independent Best Escorts In...
/:Call Girls In Indirapuram Ghaziabad ➥9990211544 Independent Best Escorts In.../:Call Girls In Indirapuram Ghaziabad ➥9990211544 Independent Best Escorts In...
/:Call Girls In Indirapuram Ghaziabad ➥9990211544 Independent Best Escorts In...lizamodels9
 
FULL ENJOY Call girls in Paharganj Delhi | 8377087607
FULL ENJOY Call girls in Paharganj Delhi | 8377087607FULL ENJOY Call girls in Paharganj Delhi | 8377087607
FULL ENJOY Call girls in Paharganj Delhi | 8377087607dollysharma2066
 
Innovation Conference 5th March 2024.pdf
Innovation Conference 5th March 2024.pdfInnovation Conference 5th March 2024.pdf
Innovation Conference 5th March 2024.pdfrichard876048
 
Digital Transformation in the PLM domain - distrib.pdf
Digital Transformation in the PLM domain - distrib.pdfDigital Transformation in the PLM domain - distrib.pdf
Digital Transformation in the PLM domain - distrib.pdfJos Voskuil
 
Cybersecurity Awareness Training Presentation v2024.03
Cybersecurity Awareness Training Presentation v2024.03Cybersecurity Awareness Training Presentation v2024.03
Cybersecurity Awareness Training Presentation v2024.03DallasHaselhorst
 
Marketplace and Quality Assurance Presentation - Vincent Chirchir
Marketplace and Quality Assurance Presentation - Vincent ChirchirMarketplace and Quality Assurance Presentation - Vincent Chirchir
Marketplace and Quality Assurance Presentation - Vincent Chirchirictsugar
 
Case study on tata clothing brand zudio in detail
Case study on tata clothing brand zudio in detailCase study on tata clothing brand zudio in detail
Case study on tata clothing brand zudio in detailAriel592675
 

Kürzlich hochgeladen (20)

8447779800, Low rate Call girls in Tughlakabad Delhi NCR
8447779800, Low rate Call girls in Tughlakabad Delhi NCR8447779800, Low rate Call girls in Tughlakabad Delhi NCR
8447779800, Low rate Call girls in Tughlakabad Delhi NCR
 
Call Girls In Radisson Blu Hotel New Delhi Paschim Vihar ❤️8860477959 Escorts...
Call Girls In Radisson Blu Hotel New Delhi Paschim Vihar ❤️8860477959 Escorts...Call Girls In Radisson Blu Hotel New Delhi Paschim Vihar ❤️8860477959 Escorts...
Call Girls In Radisson Blu Hotel New Delhi Paschim Vihar ❤️8860477959 Escorts...
 
Call Us 📲8800102216📞 Call Girls In DLF City Gurgaon
Call Us 📲8800102216📞 Call Girls In DLF City GurgaonCall Us 📲8800102216📞 Call Girls In DLF City Gurgaon
Call Us 📲8800102216📞 Call Girls In DLF City Gurgaon
 
2024 Numerator Consumer Study of Cannabis Usage
2024 Numerator Consumer Study of Cannabis Usage2024 Numerator Consumer Study of Cannabis Usage
2024 Numerator Consumer Study of Cannabis Usage
 
Pitch Deck Teardown: Geodesic.Life's $500k Pre-seed deck
Pitch Deck Teardown: Geodesic.Life's $500k Pre-seed deckPitch Deck Teardown: Geodesic.Life's $500k Pre-seed deck
Pitch Deck Teardown: Geodesic.Life's $500k Pre-seed deck
 
Call Girls In Sikandarpur Gurgaon ❤️8860477959_Russian 100% Genuine Escorts I...
Call Girls In Sikandarpur Gurgaon ❤️8860477959_Russian 100% Genuine Escorts I...Call Girls In Sikandarpur Gurgaon ❤️8860477959_Russian 100% Genuine Escorts I...
Call Girls In Sikandarpur Gurgaon ❤️8860477959_Russian 100% Genuine Escorts I...
 
NewBase 19 April 2024 Energy News issue - 1717 by Khaled Al Awadi.pdf
NewBase  19 April  2024  Energy News issue - 1717 by Khaled Al Awadi.pdfNewBase  19 April  2024  Energy News issue - 1717 by Khaled Al Awadi.pdf
NewBase 19 April 2024 Energy News issue - 1717 by Khaled Al Awadi.pdf
 
Corporate Profile 47Billion Information Technology
Corporate Profile 47Billion Information TechnologyCorporate Profile 47Billion Information Technology
Corporate Profile 47Billion Information Technology
 
Call US-88OO1O2216 Call Girls In Mahipalpur Female Escort Service
Call US-88OO1O2216 Call Girls In Mahipalpur Female Escort ServiceCall US-88OO1O2216 Call Girls In Mahipalpur Female Escort Service
Call US-88OO1O2216 Call Girls In Mahipalpur Female Escort Service
 
Buy gmail accounts.pdf Buy Old Gmail Accounts
Buy gmail accounts.pdf Buy Old Gmail AccountsBuy gmail accounts.pdf Buy Old Gmail Accounts
Buy gmail accounts.pdf Buy Old Gmail Accounts
 
The CMO Survey - Highlights and Insights Report - Spring 2024
The CMO Survey - Highlights and Insights Report - Spring 2024The CMO Survey - Highlights and Insights Report - Spring 2024
The CMO Survey - Highlights and Insights Report - Spring 2024
 
Global Scenario On Sustainable and Resilient Coconut Industry by Dr. Jelfina...
Global Scenario On Sustainable  and Resilient Coconut Industry by Dr. Jelfina...Global Scenario On Sustainable  and Resilient Coconut Industry by Dr. Jelfina...
Global Scenario On Sustainable and Resilient Coconut Industry by Dr. Jelfina...
 
8447779800, Low rate Call girls in Kotla Mubarakpur Delhi NCR
8447779800, Low rate Call girls in Kotla Mubarakpur Delhi NCR8447779800, Low rate Call girls in Kotla Mubarakpur Delhi NCR
8447779800, Low rate Call girls in Kotla Mubarakpur Delhi NCR
 
/:Call Girls In Indirapuram Ghaziabad ➥9990211544 Independent Best Escorts In...
/:Call Girls In Indirapuram Ghaziabad ➥9990211544 Independent Best Escorts In.../:Call Girls In Indirapuram Ghaziabad ➥9990211544 Independent Best Escorts In...
/:Call Girls In Indirapuram Ghaziabad ➥9990211544 Independent Best Escorts In...
 
FULL ENJOY Call girls in Paharganj Delhi | 8377087607
FULL ENJOY Call girls in Paharganj Delhi | 8377087607FULL ENJOY Call girls in Paharganj Delhi | 8377087607
FULL ENJOY Call girls in Paharganj Delhi | 8377087607
 
Innovation Conference 5th March 2024.pdf
Innovation Conference 5th March 2024.pdfInnovation Conference 5th March 2024.pdf
Innovation Conference 5th March 2024.pdf
 
Digital Transformation in the PLM domain - distrib.pdf
Digital Transformation in the PLM domain - distrib.pdfDigital Transformation in the PLM domain - distrib.pdf
Digital Transformation in the PLM domain - distrib.pdf
 
Cybersecurity Awareness Training Presentation v2024.03
Cybersecurity Awareness Training Presentation v2024.03Cybersecurity Awareness Training Presentation v2024.03
Cybersecurity Awareness Training Presentation v2024.03
 
Marketplace and Quality Assurance Presentation - Vincent Chirchir
Marketplace and Quality Assurance Presentation - Vincent ChirchirMarketplace and Quality Assurance Presentation - Vincent Chirchir
Marketplace and Quality Assurance Presentation - Vincent Chirchir
 
Case study on tata clothing brand zudio in detail
Case study on tata clothing brand zudio in detailCase study on tata clothing brand zudio in detail
Case study on tata clothing brand zudio in detail
 

Consumer Choice; Variety in the Retail Setting.

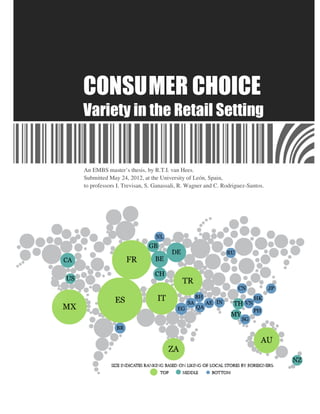
  • 1. CONSU MER CHOICE Variety in the Retail Setting An EMBS master’s thesis, by R.T.I. van Hees. Submitted May 24, 2012, at the University of León, Spain, to professors I. Trevisan, S. Ganassali, R. Wagner and C. Rodriguez-Santos.
  • 2. i Source cover figure: HSBC (2012). Expat 2011 rating of local stores and markets. Retrieved April 15, 2012, from http://expatexplorer.hsbc.com/#/countries. This master’s thesis was written as part of the European Master in Business Studies (EMBS) program in partial fulfillment of the requirements for the following academic degrees: − Università Degli Studi de Trento: “Laurea Magistrale - CLASSE LM77 Lauree Magistrali in Scienze Economico-Aziendali” − Université de Savoie: “Master en Droit Economie Gestion” − Universität Kassel: “Master of Arts” − Universidad de León: “Master Universitario Europeo en Dirección de Empresas”. All rights reserved. No part of this publication may be reproduced, stored in a database or retrieval system, or distributed in any form or by any means, electronic, mechanical, photocopying, recording or otherwise, without prior written permission of the author. Correspondence concerning this paper can be sent by e-mail to Iris van Hees at rti.van.hees@gmail.com.
  • 3. ii Abstract Presenting choice wisely is increasingly important in the retail sector because choice is expanding. Many choices are of little importance and are made in a matter of seconds when the customer is confronted with the assortment. Therefore, in store presentation can have great influence on the amount of mental energy people expend in deciding, whether or not they decide and what product is chosen. In the western world choice is perceived as desirable and there are various pressures for more choice. Preference for choice is however not only related strongly to culture, but also to personality, involvement and context among others. The amount of variety offered profoundly affects peoples purchasing behavior by fostering indecision especially when customers are unsure about their preferences. Assortment size also affects decision confidence and post-purchase satisfaction. Presenting choice can be most effectively done when products are organized according to the consumer’s decision tree, thereby forming the customer’s choice set and limiting the amount of choices consciously made. This paper presents two empirical studies in addition to the extensive literature review. The first study explores similarities and differences in Dutch and American attitudes toward choice in retailers through an application of the tripartite attitude theory. It shows that Dutch more often than Americans find that there is too much choice and feel less benefitted by having choice. Furthermore, it provides support for the assumption that reactions to choice are based on largely the same perceptions and believes. The second research furthers the cross-cultural comparison by analyzing assortment evaluations, indecision and choice satisfaction in more detail. For the American sample many results from previous research were duplicated. The Dutch sample, however, gives reason to believe Dutch reactions to choice are fundamentally different and more negative. Further investigations of Dutch perceptions of and reactions to choice showed that Dutch experience many of the benefits and drawbacks of choice found by American research. Furthermore, it provides insight into presentation effects in retailers, stressing the importance of appropriate assortments and assortment organization. Keywords: choice, retail, assortment planning, variety growth, consumer psychology, purchasing decisions, excessive choice, retail marketing, shelf management
  • 4. iii List of Tables Table 1: Types of new products. ................................................................... 17 Table 2: Choice exposure styles.................................................................... 30 Table 3: Distribution for ‘liking’ of the amount of choice in stores. .............. 66 Table 4: The believed benefits of having choice in stores.............................. 68 Table 5: Amount of respondents that did, did not and did not but indicated reason to complain. ............................................................ 70 Table 6: Benefits associated to choice........................................................... 89 Table 7: Extent to which negative feelings were experienced........................ 91 Table 8: Cross-tabulation of liking and given reason .................................... IV Table 9:Cross-tabulation of whether there was perceived benefit and reason given. ...................................................................................... V Table 10: Cross-tabulation of whether the respondent complained and given reason or mediator. .................................................................. VI Table 11: Relationship between attitude components. .................................. VII Table 12: Relationship between attitude components for Dutch respondents. ................................................................................... VIII Table 13: Relationship between attitude components for American respondents. ...................................................................................... IX Table 14: Recalled product type by nationality. ........................................ XVII Table 15: Recalled product type by gender. .............................................. XVII Table 16: Age of the memory by product type. ......................................... XVII Table 17: Age of the memory and decision difficulty for Dutch. .............. XVIII Table 18: Importance to choose right by nationality................................. XVIII Table 19: Importance to choose right by product type. ............................. XVIII Table 20: Product knowledge and nationality ............................................ XIX Table 21: Product Knowledge and Importance. ......................................... XIX Table 22: Assortment Evaluation and Nationality ........................................XX Table 23: Assortment evaluation and satisfaction with choice......................XX Table 24: Assortment evaluation and satisfaction with choice by nationality. .......................................................................................XX Table 25: Assortment evaluation and knowledge ....................................... XXI Table 26: Assortment evaluation and product knowledge by nationality. ... XXI Table 27: Assortment evaluation and decision importance. ....................... XXII Table 28: Assortment evaluation and decision importance by nationality. . XXII Table 29: Decision ease and remembered assortment size........................ XXIII Table 30: Decision ease and Choice set size for Americans. ................... XXIV Table 31: Decision importance and decision ease. .................................. XXIV Table 32: Product knowledge and decision ease. ...................................... XXV Table 33: Decision ease by nationality. ..................................................... XXV Table 34: Satisfaction with the made choice and decision ease by nationality. .................................................................................. XXVI
  • 5. iv Table 35: Satisfaction with the made choice and considering purchase deferral by nationality. ................................................................ XXVI Table 36: Satisfaction with the made choice and considering postponing the decision by nationality.......................................................... XXVII Table 37: Satisfaction with choice and product knowledge. ................... XXVII Table 38: Satisfaction with choice and choice importance by nationality.XXVIII Table 39: Ability to express identity by acceptance little variety basic goods. ......................................................................................... XXIX Table 40: Choice identity and self-expression. ........................................ XXIX Table 41: Benefits associated to choice by gender. ................................... XXX Table 42: Assortment evaluation and appropriateness categorization. ..... XXXI Table 43: Assortment evaluation and exceeding variety expectations...... XXXI Table 44: Assortment evaluation and product availability. ..................... XXXII Table 45: Assortment evaluation and special offers. .............................. XXXII Table 46: Assortment evaluation and increased expectations. ............... XXXIII Table 47: Difficulties deciding and self-efficacy. .................................. XXXIII Table 48: Drawbacks to deciding factor loadings by gender.................. XXXIV Table 49: Decision difficulty and process satisfaction. .......................... XXXIV Table 50: Satisfaction made choice and positive surprise. ..................... XXXIV Table 51: Positive surprise and increased expectations. ......................... XXXV
  • 6. v List of Figures Figure 1: Value added as percentage of GDP in 2010 and share of total businesses enterprises in 2008 in the retail and wholesale sector for selected EU countries. ................................................................... 6 Figure 2: Concentration ratio's in the European retail sector in 2004/2005. .......................................................................................... 7 Figure 3: Countries of operations of five major international retailers. .......... 11 Figure 4: Number of countries with physical and online store presence for selected fashion retailers in 2010. ................................................ 13 Figure 5: Online retail sales as share of total national sales in 2011. ............. 13 Figure 6: Online purchases and the percentage of households that have Internet access in Europe and Turkey. ............................................... 14 Figure 7: Per capita sales area (in m2) in 2010. ............................................. 21 Figure 8: Number of products offered by the average grocer per category in 2004.............................................................................................. 24 Figure 9: Assortment depth; number of items sold by Aldi by category by country. ........................................................................................ 25 Figure 10: Relationship between perceived variety and likelihood of purchase............................................................................................ 41 Figure 11: Variety and decisions; relationships identified in the literature review. .............................................................................................. 54 Figure 12: Pareto chart of reasons for liking/disliking the amount of choice in stores. ................................................................................ 67 Figure 13: Pareto chart of believed benefits of choice. .................................. 69 Figure 14: Number of stores per 1,000 inhabitants in 2007 for selected countries .............................................................................................II Figure 15: Share of grocery sales by format in Europe, 2000 vs 2004. .......... III
  • 7. vi List of Abbreviations EU – European Union GDP – Gross Domestic Product GfK – Growth for Knowledge ICT – Information and Communication Technology p - Probability POPAI – Point-Of-Purchase Advertising Institute PPP – Purchasing Power Parity SD – Standard Deviation SE – Standard Error SKU – Stock Keeping Unit UHT – Ultra High Temperature UK – the United Kingdom US/USA – United States/United States of America
  • 8. vii Table of Content Abstract ii List of Tables iii List of Figures v List of Abbreviations vi Table of Content vii Preface x Introduction 1 1. Research Question 1 2. Preliminary Definitions 2 3. Research Methodology 3 1. Industry Introduction 5 1. Sales, GDP and Industry Structure 5 2. National Industry Developments 8 3. Globalization 10 4. Online Ret@il 12 2. Sources of Variety and the Prevalence of Choice 17 1. Categorizing new products 17 2. Product and Brand Variety 18 3. Global Assortment Sizes 20 4. Store Formats and Assortments 22 5. Assortment Depth 24 3. Consumer Demand for Variety 26 1. Sides to Variety 26 2. Exposing Oneself to Choice 29 3. Maximizers and Satisficers 31 4. Making Purchasing Decisions 32 1. The Purchase Decision 32 2. Involvement, Information Search and Decision Novelty 33
  • 9. viii 3. In-store Decisions 34 4. In-Store Decisions and Heuristics 36 5. Purchasing from Variety 38 1. Product Choice and Variety 38 2. Chance of Purchase and Variety 39 3. Chance of Purchase, Trade-offs and Preference Uncertainty 41 4. Memory and Time 43 5. Knowledge and Articulated Preferences 45 6. Customization and Personalization 47 6. Variety and Post-Purchase Satisfaction 50 1. Post-Purchase Satisfaction 50 2. Opportunity Costs and Escalation of Expectations 51 3. Regret and Responsibility 52 7. Choice Moderation by Retailers 55 1. The Retailers and Variety 55 2. Presentation Effects 57 3. Other Moderating Policies 59 8. Study 1: Attitude Towards Choice 62 1. Study Design 62 2. Analysis Procedure 62 3. Sampling Procedure and Sample 65 4. Results 65 5. Discussion of Results and Methodology 73 9. Study 2: Choice and Satisfaction 75 1. Study Design 75 2. The Instrument 76 3. Sampling Procedure and Sample 78 4. Analysis Procedure Cross-Cultural Study 78 5. Recalled Choices 79 6. Results Cross-Cultural Comparison 82 7. Discussion on Cross-Cultural Findings 86 8. Analysis Procedure Study of Dutch Respondents 87
  • 10. ix 9. Specific Results for Dutch Respondents 88 10. Discussion of Dutch Results 93 11. Discussion of the Methodology 95 Conclusion, Recommendations, Discussion and Future Outlook 97 References 100 Appendix A: Legend figure 6 I Appendix B: Additional Industry Data II Appendix C: Study 1; Extra Information IV Appendix D: Study 2; Questionnaire American Respondents X Appendix E: Study 2; Questionnaire Dutch Respondents XII Appendix F: Study 2; Extra Information Cross-Cultural ComparisonXVII Appendix G: Study 2; Extra Information Analysis Dutch RespondentsXXIX Personal Affirmation in Lieu of Oath 1
  • 11. x Preface The classes on marketing and product innovation during the EMBS-program made me wonder what free competition and the expansion of product alternatives mean for the everyday consumer. To some extent consumers and their experiences seem to have been marginalized by an academic and corporate discourse focused on profit and sales as the main criteria for market success. The underlying and widespread assumption is that optimized profits in competitive markets imply needs being served in the best feasible manner. Thus, the consumers’ reaction to this competitive approach and expansion of choice is reduced to the product they choose to spend their money on and the amount of money that is spent. However, though this reasoning makes sense within economic theory, in practice consumer reactions are much more complex. Some of the problematic of the ongoing boom of choice were brought to my attention by the virtue of TED.com, a nonprofit initiative that I have to thank for providing much inspiration over the years. From amongst their many contributors I’d like to make a special note of two speakers, namely Barry Schwartz and Sheena Iyengar from whom I borrowed some ideas with which I started this research. Most striking was that though we need choice to be free, not all choice increases freedom, and the availability of many choices may in fact decrease happiness and overall well-being. Fortunately, some retailers pick up on their clients’ confusion, and other negative reactions to choice such as indecision, and attempt to reduce this by organizing and limiting their assortments. A theoretical framework is still missing and much of the existing knowledge has been developed inside big retail chains and is therefore not available to their smaller competitors. This master thesis is my contribution to both the development of a framework and increasing awareness of the costs of choice, including time, confusion and decreased satisfaction, as well as increasing knowledge on when and how having much choice is beneficial. Moreover, this thesis investigates to what extent these negative effects are culturally bound. For this surveys were spread among both Americans and Dutch revealing some interesting similarities but more strikingly revealing profound differences. This text should not only be helpful to retailers, but also for marketers, students and the general public alike.
  • 12. xi I would like to thank Melanie van der Lee for her explanation of the workings of grocery store shelf management, a task she has carried out professionally for many years for one of the Netherlands largest grocery chains. I would like to thank everyone who took the time to help me with the pre-testing as well as the respondents of my questionnaires and the two panel bureaus. Finally, I would like to thank my parents and friends who took the time to discuss my ideas with me and my tutors Michael Gierczak and José Luis Vazquez. León, Spain, May 24th, 2012, Iris van Hees
  • 13. Introduction 1 Introduction 1. Research Question Whichever the form of the increase in variety, the amount of product alternatives is profoundly interlinked with the free market responding to consumers, as well as the globalization of demand and supply. Primarily, one may attribute this increase in variety as a logical, expected and desired effect of the market economy which promotes innovation and caters to the buyer’s needs. Therefore, it follows that with this increase in choice people are able to find products that better fit their wants and needs, will overall be getting more satisfied, and the market will, with time, reach an optimum. However, there are some indications that this increase in choice is taking its toll, especially when it comes to the satisfaction with the purchased goods and services and the general consumer well-being. Therefore, consumer reactions to the increase of choice are important to investigate, especially now that the Internet vastly expands the amount of alternative products available to consumers, and marketers are more and more introducing products for only limited periods of time. The main question of this paper is: ‘To what extent is the amount of choice offered by Western retailers to non-professional customers desirable?’ This question is sub-divided as follows: -How pervasive is choice in retailing to non-professional consumers? -How does the amount of choice affect customers? -What are industry best-practices when it comes to presenting choice? -To what extent are the responses to choice similar in the USA and the Netherlands? The first sub question, ‘How pervasive is choice in retailing to non- professional consumers?’ is answered in chapters one and two. Here the history of retail over the past 200 years is discussed as well as the progression of the amount of choices offered by retailers. The second sub question, ‘How does the amount of choice affect customers?’ is discussed theoretically in chapter three to six. The discussion covers why consumers may or may not want choice, how retail purchasing decisions are made and how choices and their outcomes are affected by the amount and sort of alternatives available. Then chapter seven gives an overview
  • 14. Introduction 2 of known industry best-practices in an attempt to answer the third sub question, ‘What are industry best-practices when it comes to presenting choice?’ Following this theoretical framework, own research is presented as an answer to the fourth sub-question: ‘To what extent are the responses to choice similar in the USA and the Netherlands?’ First a look is taken at the general attitude towards choice, followed by an investigation of assortment satisfaction, satisfaction with made purchasing decisions and the occurrence of indecision. The final research focus is an investigation into Dutch perceptions of and reactions to choice, focusing on associated benefits and drawbacks as well as in-store assortment presentation. The paper concludes with recommendations for retailers and marketers as well as suggestions for future research and a general future outlook. 2. Preliminary Definitions In the context of this thesis retailer refers to a company that is: “primarily involved in the activity of purchasing products from other organizations with the intent to resell those goods to private households, generally without transformation, and rendering services incidental to the sale of merchandise” (Zentes, Morschett, Schramm-Klein, 2011, p.1). Retailing covers all consumer products such as food, apparel, consumer goods, financial services, leisure, etc. There are many different retail formats, which can be split in store and non-store (IMAP, 2010). Here the focus is on store formats and to lesser extent online stores. Non-store retailers such as catalogues, door-to-door, telephone and direct response television are excluded. The recommendations of this paper are equally applicable to companies that sell their own products directly to consumers, for example through factory outlets, as long as their target group and store formats are similar. A non-professional customer is whoever has the possibility to choose from the product assortment of the store, for personal consumption, regardless of whether or not a purchase is made. Choosing or making a decision in the context of this thesis, will be defined as a response to a situation in which alternative courses of action are under consideration and “the decision maker can form expectations concerning future events and outcomes following from each course of action, expectations that can be
  • 15. Introduction 3 described in terms of degrees of belief or probabilities. (…). The consequences associated with the possible outcomes can be assessed on an evaluative continuum determined by current goals and personal values.” (Hastie & Dawes, 2009, p.24). Finally, product alternatives are those products that by the customer are seen as substitutes and therefore fall in the same product category. More alternatives implying more choice and fewer alternatives providing less choice. There are various ways to measure assortment variety within a product category. To measure assortment depth, one can look at the number of Stock Keeping Units (SKUs) it contains. Alternatively, to measure variety one can look at the attribute variety (see van Herpen & Pieters, 2002, for a detailed mathematical description) also referred to as assortment entropy (Fasolo, Hertwig, Huber & Ludwig, 2009). Attribute variety calculations primarily rely on the amount of aspects on which products can vary and the amount of different attributes they can take. For example, when three shirts are offered there is more variety when they do not only differ in color but also in size. These shirts additionally present more variety if instead of there being two colors there are three. Here the perception of customers is crucial to determine which product aspects do and do not create variety, for example if the stich size in these shirts differ by .1mm very few customers, not to say none, will notice. As products become less and less objectively different from each other some consumers may cease to count them as possible choices. Based on this reasoning, groups of two products can be placed on a continuum of the amount of choice they present. Products that differ little on few attributes present little choice and products that differ widely on many attributes present much choice. Research suggests that attribute based variety calculations correspond better to perceived variety than SKU based measures, however these calculations are more costly and rely more heavily on the researcher’s judgment. 3. Research Methodology This thesis is based on three distinct approaches to research. The first half is based on literature research. This is followed by chapter seven which in part is based on literature research, in part on an in depth interview and for the remainder on the
  • 16. Introduction 4 stories of various professionals in the retail field. The last part of this thesis is based on the qualitative and quantitative analysis of two surveys. The literature research is primarily based on publications in research journals and by specialized marketing research companies. If multiple researches were found that covered the topic preference was given to the most recent publication. When looking at global data special emphasis was placed on both Europe, and specifically the Netherlands, and the USA. Next to these sources also some books from the university library, newspaper articles and conference talks were used. For some of the data presented primarily in the earlier chapters the Eurostat and UNData databases were used. Next to the literature research chapter seven on the presentation of choice by retailers is additionally based on an in depth interview with a manager in charge off category presentation of a large Dutch grocery retailer who has worked together closely with the research department there. The interview took place December 28, 2011. The retailer wants to remain unnamed. For this chapter also the experiences of some other retail professionals were used, taken mainly from thematic forums. The final part of this thesis resents the results of two surveys which were developed using the presented literature and tackle various questions. The combined sample size is over 570, including both Dutch and Americans, recruited both through the author’s personal network as well as online panels. All quantitative analyses were carried out using either Microsoft Excel 2010 or SPSS 17.0. For more detailed information regarding the methodology, please see the studies’ respective methodology sections. The recommendations and conclusions chapter that concludes this thesis is based on all research presented, and as said before aims to provide practitioners with a more profound understanding of the problematic as well as concrete tools to counteract possible downsides of choice.
  • 17. Industry Introduction 5 1. Industry Introduction Before discussing how consumers are affected by the increasing amount of choice in Western countries, it is important to have established that consumers are faced with increasing amounts of product alternatives, and before that we need to have an image of the retail industry and its development. Therefore, this chapter provides an introduction to the global retail industry, with a special focus on the USA and Europe. As covered in the general introduction, the retail industry is comprised of those individuals and companies that sell finished products to the consumers, and the sector can be subdivided in food, soft (clothing) and hard goods (IMAP, 2010). Although in some cases the manufacturer is also the retailer, typically product distribution is carried out by specialized companies. Products are either sold directly from the manufacturer to the retailer, or through wholesalers. Often specialized services such as storage, transportation and ICT are outsourced. The industry is labor intensive and has a moderate to use of capital (Michigan State University, 2012). Retail competition is mainly price based, but also location, assortment, store lay-out and reputation matter. 1. Sales, GDP and Industry Structure In 2009 global retail sales were 13.9 trillion dollars, compared to 7 trillion in 2000 (IMAP, 2010; Deloitte, 2002). However, total retail sales are closely related to Gross Domestic Product (GDP), because personal incomes minus saving rate and plus lending, are spent in retail, insurance, services, rent, water, electricity, gas and investments. In Europe retail spending was between 27 to 40% of private spending in 2009, in Russia as much as 60%, and in the US approximately 50 to 55% (GfK, GeoMarketing, 2010; the Office of Consumer Affairs, 2011). The amount of this which was spent on food differs between countries, and to some extent reflects welfare. According to Lasserre (2007) in Western European countries spending on food was between 30 and 40% of total retail spending in 2003, in the US this share was lower (27%) and in Asian countries this was higher (46% in Japan and 59% in China).
  • 18. Industry Introduction 6 Due to the close relationship between retail sales and GDP the added value of the industry as a percentage of GDP is a better measure of its size. The value added by the retail industry (including wholesale, restaurants and hotels is on average 15.7% of GDP (own calculations based on 2010 data of 207 countries retrieved from UNData). The added value of wholesale, retail, restaurants and hotels over GDP has shown a constant drop since the 1970’s, being 16.2% in 1970, 16.1% in 1980, 15.8% in 1990, and 15.7% in 2000 (based on data from 183, 183, 214 and 209 countries respectively). In 2010, the lowest contributions of retail to GDP was in oil producing countries, such as Kuwait, Saudi Arabia and Qatar with 4 to 5%, and the highest in islands and city states such as Monaco and islands such as Barbados with 35 to 39%. Figure 1: Value added as percentage of GDP in 2010 and share of total businesses enterprises in 2008 in the retail and wholesale sector for selected EU countries. 20% 45% 18% 40% % of total enterprises 16% 35% 14% 30% 12% 25% % of GDP 10% 20% 8% 6% 15% 4% 10% 2% 5% 0% 0% Czech Republic Estonia Romania Slovenia Slovakia Belgium Portugal United Kingdom Germany Spain Italy Luxembourg Hungary Finland Sweden Norway Bulgaria Latvia Lithuania Austria Cyprus the Netherlands retail enterprises wholesale enterprises total value added Source: Calculated based on Eurostat and United Nations data (UNData). On average 14.5% of European GDP is added value from the wholesale and retail industry. This is 1.2% lower than the world average. The relative GDP importance of the wholesale and retail sectors in various European countries, as visualized in figure 1, is spread between 8.8% in Norway and 18.6% in Portugal. Also the amount of enterprises active in the retail or wholesale industry relative to the total amount of enterprises differed widely between the countries. In some, such
  • 19. Industry Introduction 7 as Slovakia, Germany and Finland there were relatively few, while in Bulgaria and Romania there were relatively many. On average 22.4% of European enterprises are retailers or wholesalers. Comparing the GDP contribution to the amount of companies in the sector shows that especially in Bulgaria and Romania retail firms on average contribute relatively little, a finding supported by Wrigley and Lowe (2010) who analyzed concentration of the European retail markets (see figure 2). Data from Nielsen (2010a) shows 5-firm concentration ratios of 97% in Australia, 95% in New Zeeland, 76% in Hong Kong, 57% in Taiwan, 32% in Korea and 9% in China. Globally the top 250 retailers had a market share of slightly more than 27% in 2009 (Deloitte, 2009), showing that few decision makers have an influence over the daily shopping experience and consumption habits of a large part of the global population, though their reach differs greatly from country to country. Figure 2: Concentration ratio's in the European retail sector in 2004/2005. Source: Wrigly and Lowe (2010). In the retail industry there increasingly is a divide between very small and very large companies, a trend that will be discussed in more detail later this chapter. While, as said before, the largest companies have large market shares the majority of registered retailers is very small. Data from Haskel, Jarmin, Motohashi and Sadun (2007) shows that the majority of enterprises in the retail sector had only one establishment in 2002 (95% of firms in Japan and the US and 94% of firms in the UK). The size of companies with more than one establishment varies more widely
  • 20. Industry Introduction 8 cross countries. In Japan firms with more than one establishment on average have 7, in the UK 8 and in the US 13. This indicates that the US retailers are much more consolidated than their Japanese and English counterparts. This difference in chain size and concentration can largely be explained through recent sector developments that have also driven the globalization of the sector, and will be elaborated upon shortly. 2. National Industry Developments Over the last two centuries the manner in which people purchase their food, beverages and other supplies in the Western world has changed drastically (see Wrigley & Lowe, 2002 for an extensive discussion of the changing retail structures). Previously almost always separate retailers, such as vegetable stores, butchers, bakers, milkmen and grocers, merged into new store formats such as department stores, super- and hypermarkets under the influence of growing urban middle classes, rising ownership of cars, fridges and freezers and mass production (Mooijman, 2004; Wraigley & Lowe, 2002; Seth & Randall, 2001; Tat Keh & Park, 1997). For this format change the invention of the ‘self-service’ supermarket in the 1937 was crucial (Wrigley & Lowe, 2002). Self-service is slowly spreading from Western markets such as the US, where approximately 85% of sales are self-service, to Asia (53%) and countries such as India (6%; Nielsen, 2010a). Furthermore, other aspects of modern retailing have emerged after 1900, such as pre-packaged foods, window displays, advertising, and clear, fixed pricing (Alexander & Akehurst, 1998). Also the automation of payments, both through the introduction of barcodes as well as checks and electronic payment methods, and the automation of stock keeping and supply chain management have allowed for an increase in labor productivity and the creation of economies of scale. This increase in store size is also known as the retail life cycle. The retail life cycle relates store type to maturity of the economy, and to maturity of the retail sector in particular (Zentes, Morschett & Schramm-Klein, 2011). As time progresses the store formats become larger and larger offering more and more alternatives, both in depth and breadth, two assortment aspects that are explained in the next chapter. The point where stores become smaller again seems to not have been reached yet.
  • 21. Industry Introduction 9 The increase in store size was paralleled by a dramatic decrease in the amount of grocers per citizen from the start of the 1900 to now, which is logical as larger stores need a larger customer base to be sustainable. Data from Haskel, Jarmin, Motohashi and Sadun (2007) shows that in 1997 there were approximately 11 stores per 1000 inhabitants in Japan, 5 stores per 1000 inhabitants in the UK and 4 stores per 1000 inhabitants in the US. Comparing this to their data of 2002, and data from Euromonitor (2009) of 2007 shows a negative trend (see Appendix A for statistics for 2007 for a wide selection of countries). This trend is undoubtedly influenced by the rise of modern store formats such as that of Walmart who’s stores are only viable with a minimum customer base of 150,000 (Lasserre, 2007). Data from the Netherlands shows that this is not just a recent trend. Where at the start of the nineteenth century there was one grocer for each 200 people in 2001 there was on average 1 grocer per 850 people, and by 2005 1 for each 1,000 (Betje Boerhave, 2011). Although many of the smallest villages have found local stores disappearing, and distances to stores increasing this decrease in stores per inhabitants did not lead to fewer stores being available to most people. Because towns and cities grew and the range that consumers could easily travel increased as well. People were often faced with both more and larger stores, especially in cities serving as regional retail centers (Mooijman, 2004). Thus, as the stores became bigger, most consumers found that the amount of stores at which they could buy a product increased. The growth in store size was combined with the rise of chain stores. Modernized larger retailers gained a competitive advantage over less modernized smaller firms, and mainly in the 1980’s and 1990’s independent grocers started disappearing while chains gained market share (Wrigly and Lowe, 2010). In the Netherlands which in 1990 still had over 60,000 independent grocers in 2010 only around 20,000 were left (Deloitte, 2011). And as 35.3% of independent grocers with a turn-over below 75,000 euros per week indicated in July that year to expect to go out of business within the next five years this trend is likely to continue. At the same time large chains report no such fears and the largest three holdings (each owning multiple retail firms) now have an 85.7% market share. Also the three main discounters do well, with a combined market share of 19%. Concentration led to a power shift from manufacturers to distributor chains (Wrigly and Lowe, 2010). In the same 1980’s to 1990’s period the ICT revolution
  • 22. Industry Introduction 10 allowed for more buyer-driven supply chains and retailers introduced lean methods of supply chain management. These developments allowed retailers, such as Tesco, to reduce stock days from 45 in 1978 to around 15 from the 1990’s onward. 3. Globalization Retail globalization has a long history; the first ‘modern’ retailers to internationalize were luxury, specialty and department stores, which between 1880 and 1945 opened stores in cosmopolitan cities (Alexander, 1997). Furthermore, between 1960 and 1974 many leading Western European retailers started to look to other countries for growth and invested both in neighboring countries as well as the USA. In this period Carrefour expanded to Spain, and Ahold to the USA. Then, after a period of downturn and economic shocks, not only did the Western European retailers restart international investments between 1983 and 1989, but also the Japanese started investing in both markets. Real retail globalization started in the 1990’s, with those retailers that had concentrated, automated and introduced lean systems (consisting mainly of Western European and American firms) exporting their expertise to countries in which retailers had not yet done so (Wrigly & Lowe, 2010; Alexander, 1997). They thereby mainly focused on countries in their own region as a consequence of the development of regional trade blocks such as the NAFTA, the European Single Market and the opening up of Eastern European and Asian countries. For example, the number of retail establishments in Eastern Europe owned by Western European firms increased from 28 in 1991, to 1,800 in 2002 (Igan & Suzuki, 2011). Figure 3, shows how some leading retailers have expanded internationally over the last decades. As their success relies mainly on their competitive advantages outlined before, this globalization has put a firm stamp on the retail industry, by concentrating retailers and modernizing the business models to include ICT and new forms of supply chain management. Moreover, internationalization has enlarged and homogenized store formats, presentation, management and product selections. This effect is especially strong in those countries that do not have ‘modernized’ retail sector. Of course, this process of change takes time, and thus the largest Westernization and preference for larger store formats can be observed in countries
  • 23. Industry Introduction 11 such as Poland, the Czech Republic, Hungary and Slovakia, and to a lesser extent in countries such as Bulgaria, Romania, Ukraine and Russia (Igan & Suzuki, 2011). Figure 3: Countries of operations of five major international retailers. Source: IGD (2009). The top 250 largest global retailers are still actively internationalizing, though as shown in figure 3 Ahold has reduced the amount of countries drastically. The international share of sales of the largest retailers has steadily increased from near zero in the early 1990’s, to 22.2% in 2009 (Deloitte, 2011). However, the industry remains less globalized than for example consumer products, hospitality, telecommunications and entertainment (Deloitte, 2009). Overall, American retailers, though leading in sales revenue, are less globalized then their European counterparts. In 1999 four of the USA’s ten largest retailers only operated in the domestic market, and the other six had foreign sales ranging between 0.5 and 18.4% (Ashfaq, n.d.). The average was 11.1% of foreign sales for those of six top 10 US retailers that were internationally active. A number that, when taking the top 10 US retailers regardless of their foreign activity, drops to 7.6% of foreign sales over total sales. In 2011 only two of the top 10 American retailers did not have foreign sales (Schulz, 2011). The average part of foreign sales was 16.7% for the whole top 10, and 19.6% when only taking into account the 8 internationally active ones. This increase was for a large part due to the increase in international activities of Walmart, the largest retailer in the world, which increased foreign sales from 13.9% to 27.1% by 2011.
  • 24. Industry Introduction 12 The top European retailers in 1999 had a larger share of international sales, for example the French Carrefour had 37.7% foreign sales, ITM Enterprises SA. 36%, the German MetroAG 40% and the Dutch company Ahold 76.4% (Ashfaq, n.d.). Also in 2009 European retailers where more globalized than their American counterparts with more than one-third of sales revenue came from foreign operations (Deloitte, 2011). This difference likely originates from the fact that European companies have smaller home markets and can easily internationalize due to the European Single Market. 4. Online Ret@il The latest big development in the retail industry has been the rise of online selling. During the dot-com bubble in the late 1990’s many solely-online retailers appeared (Wrigley & Lowe, 2010). However, these online retailers did not initially cause the market disruption that was expected by many. Instead, e-commerce became dominated by the online channels of traditional retailers, referred to now as the ‘bricks and clicks’ model (see figure 4 for some examples from the fashion retail sector). Also many online stores made alliances with mortar and brick stores as they found that having a physical store boosts their online sales. Though not growing as fast as originally expected, online retailing has obtained a large market share. By 2009 global online sales were 348.6 billion US Dollars, 2.5% of global retail sales (IMAP, 2010). Of these 22.6% were electronics, other often sold items include books, fashion, airline tickets and software. The online market is however not limited to these. For example in the UK online grocery shopping is rather developed with 19% of adults having used the service in 2009. The largest e-commerce market is the US with 37.2% of online sales. In the US approximately 7% of sales revenue was earned through online channels. Second largest are UK e-commerce sales, constituting ⅓d of total e-commerce sales in Europe (Alisson, 2011). As can be seen in figure 5 the UK is also the country with the highest relative share of online sales, followed by Germany and most of Northern Europe.
  • 25. Industry Introduction 13 Figure 4: Number of countries with physical and online store presence for selected fashion retailers in 2010. Number of countries with online delivery Number of countries with physical store Source: Cushman and Wakefield (2011). Figure 5: Online retail sales as share of total national sales in 2011. 14% 12,0% 12% 10% 8,7% 9,0% 8,2% 8,0% 8% 6,9% 7,3% 6% 5,1% 4% 3,1% 3,5% 2% 1,3% 0% Source: Redrawn from the Center for Retail Research (n.d.) Not only has e-commerce grown rapidly over the last two decades, it also has a large, 16.1%, predicted growth rate for 2012 (IMAP, 2010). Forrester (2012) predicts sales growth rates of 11 to 12% in mature e-commerce countries such as
  • 26. Industry Introduction 14 Japan, South Korea and Australia, a 25% growth in China and 57% in India between 2011 and 2016. In 2008 an overwhelming majority of Internet users in South Korea (99%), UK (97%), Germany (97%), Japan (97%) and the US (94%) had experience with online retail (Achille, 2008). Within Europe, especially countries in the west and north, such as the Netherlands, the UK, and Sweden are predicted to have large shares, approximately 80%, of their population, including those without Internet access, shop online by 2015 (Alison, 2011). In southern European countries, such as Italy, Spain and Greece, this percentage will be substantially lower, around 50%. Logically, there is a strong relationship between Internet access and experience with online retail, which is demonstrated in figure 6. Figure 6: Online purchases and the percentage of households that have Internet access in Europe and Turkey. % of households making an online Purchase in the past 12 months % of households with Internet access Note: see Appendix A for a legend to the country abbreviations. Source: Cushman and Wakefield (2011). When comparing Europe as a whole to Internet shopping in other continents, Nielsen (2010b) found that Internet shopping is more or less equally popular in all countries. Approximately 84% of connected users have some experience with online
  • 27. Industry Introduction 15 retailers. The exception to this is the Middle East, Africa and the Pakistan where relatively many (50%) Internet users have not yet bought items online. For consumers, retailers and manufacturers alike the rise of online retail has made decisions more complex. For retailers and manufacturers multi-channeling has become increasingly important strategically, as a balance needs to be found between the offer in physical stores and that in online channels (IBM, 2002). In 2008 61% researched products online but purchased it in a store, and 56% researched products in the store and bought it online (Gaffney, 2009). With the rise of online retailing it has become impossible for consumers to inform themselves about all options available to them (IMAP, 2010). The assortments of online stores are often more category specific and thus relatively deep and lesser known brands are more dominant. When a consumer decides to use the Internet as shopping channel almost instantly many more stores come available to him or her. In 2010 close to one-third of European online shoppers made purchases online outside of their home country. Similarly, in the US, over 25% purchased items from retailers based outside of the US thorough online channels. This share was one-third Among US consumers aged 18–24. However, language barriers persist and delivery is sometimes geographically limited. Consumers that do not purchase online are often influenced by information on the Internet as they read customer reviews and look up customer ratings. In the first quarter of 2010 in Europe 19% of those with Internet access use these sources of information at least once a month and 46% of Internet users feel these ratings help them reach decisions (Western Europe Technographics Survey Q1 2010 as cited by IMAP, 2010). Reviews were consulted most frequently for consumer electronics, cars and software (Nielsen, 2010b). During the early stages of the Internet consumers started generating content on rating and review sites and feedback portals have been created. These were later followed by discussion forums, consumer blogs, Micro-community sites, audio and video blogs and what have become known as ‘social media’ such as Facebook and Twitter. The latest development in this area is the increased availability of these sources of information within the traditional retailers as mobile phone Internet connections continue improving and special apps are designed. In conclusion, the retail industry is of great economic importance in almost all countries, and comprises many companies in each country. Though the majority
  • 28. Industry Introduction 16 of companies in the industry are small there are also many large players that have gained dominance over their supply chains. Over the past two centuries the industry has seen many changes, such as the rise of self-service, the introduction of ICT systems, the concentration and globalization of its companies and the rise of online retailing. The globalization of retailers has had as main drivers the retailers need for growth opportunities and the export of best practices, and the latter has had a great influence on countries with less developed internal retail markets, such as Eastern Europe. From the consumer’s perspective there has been an increase in store size, and the effects of urbanization and more widespread personal means of transportation have been that more stores have become available to most. This is especially true with the rise of e-retailing, which provides everyone with an Internet connection access to more retailers than are present in their village or region. Keeping this first image of the retail industry and its development in mind the following chapter will discuss what changes have increased product variety and how much choice consumers are faced with. The latter will be done through an examination of store sizes, formats and assortments sizes.
  • 29. Sources of Variety and the Prevalence of Choice 17 2. Sources of Variety and the Prevalence of Choice 1. Categorizing new products The previous chapter has described the changes in the retail industry, however also the products that are sold have fundamentally changed over the last century. All increase in variety has originated from the introduction of ‘new’ products. According to Tat Keh and Park (1997) new products can be categorized as shown in table 1. Based on this framework, for the purpose of this paper three sources of product variety are discussed in more depth, namely supplier variety, product variety and branding. Table 1: Types of new products. Source: Tat Keh & Park (1997). Firstly, product origin variety has expanded for products due to improvements in transportation and increasing international trade. To illustrate this
  • 30. Sources of Variety and the Prevalence of Choice 18 consider that in 1989 the US imported many goods, such as agricultural products, from an average of 12 different supplying countries (Mostashari, 2010). In 2007 these same products were imported from an average of 16 different countries. This is a measure for product variety as instead of offering only French red wine, also Brazilian, Spanish and South-African red wine are now available. Similar increase in variety was demonstrated by Broda and Weinstein (2004), who found that while in 1972 products were imported into the US from an average of 31.4 different suppliers, by 1997 this had increased to 42.7 suppliers. A trend they also found for European countries as well as Hong Kong, Mexico, the former Soviet Union, Singapore, Taiwan and Brazil. Data on Europe shows that the same trend continued during the 1995 to 2007 period as well (Jubiläumsfonds der Österreichischen Nationalbank, 2009, as cited in Foster, Poeschl, & Stehrer, 2008). A striking feature of this trend is that the goods that importers source from the fewest countries (petroleum and other fuel oils, coal, and wheat) are all generic goods (Broda Weinstein, 2004). Similarly goods that are sourced from many countries (e.g., medicines, specialized industrial machinery, and motor vehicle parts) are likely to be quite differentiated when it comes to producing countries. This is possibly due to their lesser relationship to natural resources and increasing importance of human capital and intellectual property rights. This trend of increasing supplier variety, paradoxically, was probably possible only thanks to suppliers increasing their production levels through consolidation and economies of scale (Philpott, 2007; Howard, 2006). Thus, while to the consumer more supplier variety became available, increasingly large and few globalized producers were supplying. The same goes for the retailers. Due to urbanization and increased consumer mobility, consumers are able to go to more different stores. However, the same chains are present in many towns, and more recently have an increasingly global presence, reducing the total variety of retailers (Wrigley & Lowe, 2002). Most recently, Internet retailing has made many more stores and products available to consumers all around the world. 2. Product and Brand Variety Secondly, over the past years variety in (available) products has expanded. Broadly, these products can be split into three general groups: those that are
  • 31. Sources of Variety and the Prevalence of Choice 19 modified, those that are newly available and those that are newly invented. Milk is a product of which the diversity has increased over the past 100 years through product modification, as it developed from a product that was sold from door-to-door to a grocery store item. Not only can one now buy (cow) ‘milk’, but one chooses between whole, semi skimmed, skimmed, a specific % of fat, organic, flavored, pasteurized, sterilized, ultra high temperature (UHT), evaporated, condensed, filtered, dried, homogenized and, if lucky, the original untreated (or ‘raw’) milk. Furthermore, the product has also been modified by changing the containers. One can buy milk in differently sized and shaped containers, containers that can be made of a variety of materials, such as carton, plastic and glass, to be opened in a variety of manners. Product innovation may well go beyond functional satiation and move products from being necessity to luxury goods (Baudisch, 2006). Other sources of increasing product variety are new inventions, creating not only variety in existing product categories, but at times add product categories as well. All consumer electronics, including light bulbs and telephones have been developed over the last 200 years (Acton, 1994; Boyer, 2001). Also many consumables are relatively new such as energy drinks as well as many cleaning and personal hygienic products (Rouse, 2010; Holmes, 2001; Romanowski, 1998). New introductions are often produced for little more than a year, creating an ever changing stream of new products (Swartz, 2004). Finally, there are newly available products. For example previously localized products have spread across the globe. Food and other perishable products are a good example as they could spread only after the revolution in freight. Since then the markets have been flooded with foreign foods such as bananas and rice. Furthermore, this combined with evolving production methods has made it possible for various seasonal fruits and vegetables, such as grapes, strawberries, sweet peppers and tomatoes to be in ready supply all throughout the year. Especially globalized retailers benefit from this as they can use their local procurement networks to purchase local specialties cheaply. Branding has been another source of variety. Brands can introduce differences that were not perceived before. Often this is achieved by associating the brand with characteristics that objectively have little or no relationship to the product. How brands introduce the perception of variety is most easily shown when looking at how products from one manufacturer are rebranded and sold as
  • 32. Sources of Variety and the Prevalence of Choice 20 alternatives, such as for example the Albert Heijn and Etos1 private brand shampoo. Brands can also exaggerate the existing differences, as happens for example with flour, sugar or milk. At other times brands can mask variety, as products from various producers or products that are adapted to local tastes are sold under the same name. A good example of this is coca cola which does not quite taste the same everywhere. 3. Global Assortment Sizes The various mechanisms in which new products become available together resulted in 5,694 new grocery store items and 10,558 new varieties in 1988 (Borin, Farris & Freeland, 1994). In 1998 20,000 grocery store items were released of which 11,000 food products (Nestle, 2002; Garg, Jones & Sheedy, 1999). Of these introductions 1,200 (6%) were new products or line as well as brand extensions, the rest products had existed before but had yet not been locally available. With the introduction of 20,000 new products a year stores have almost limitless possibilities for assortment growth (as most stores have assortments of less than 4,000 items). And to accommodate these new products retailers have grown assortments over the past decades. To get an impression of how much choice has expanded for the average consumer we consider the assortment size of a grocer. According to Garg, Jones and Sheedy (1999) and Nestle (2002) while the average US grocery store carried an average of 9,000 items in 1974, in 1980 this had risen to 15,000 and by 1997 the average store sold as many as 30,000 items. According to firstresearch.com (2005) the average US grocery store carried 40,000 different items, in 2008 the average number of items had risen to almost 47,000 (Minesota Grocers Association, 2011). Thus assortment sizes more than trebled over the course of the past three decades. Not in all countries have such large levels of assortment been reached (Nielsen, 2010c). In fact, grocery stores in the US on average have the largest assortments. In China, Brazil, Mexico and Argentina the average store carries only a little over one third of the items in their US counterparts (approximately 11,000), and European countries such as France and the UK are in the middle (with stores on average carrying 15,000 and 20,000 SKUs respectively). 1 Both brands are owned by Ahold
  • 33. Sources of Variety and the Prevalence of Choice 21 This does not mean that all stores have such large assortments. When looking at retailers in the USA Bishop (2010) found that half of them had between 2,000 and 3,500 items in their assortment in 2009. 20% had less than 2,000 items and only 23% of the stores had more than 4,001 items. Unfortunately, the amount of countries for which data on the average amount of SKUs in stores is available is very limited. Therefore, to quantify the amount of choice offered to people in various countries some researchers have used sales area as a proxy for the size of the assortments, as the more products one sells the more space is needed (Hunneman, 2011; Arnold, Ruth & Tigert, 1981). Sales area per capita is however no more than a proxy as presentation method and the size of items displayed impacts the sales area per capita greatly. Figure 7: Per capita sales area (in m2) in 2010. 1,8 1,6 1,4 1,2 1 0,8 0,6 0,4 0,2 0 Source: adapted from Jahn & Müller (2011). The US has the world’s largest sales area per capita, with an average of 3.86 m2 of retail space per inhabitant in 2008 (Hill, 2009). India, on the other hand, with 0.19 m2 per capita, may well have the lowest sales area per capita, while simultaneously many Indians work in retail (Khanna, 2008). Data for Europe can be found in figure 7, where ‘Northern EU’ includes Norway, Sweden, Finland and Denmark, and ‘Eastern EU’ Slovenia, Czech Republic, Croatia, Estonia, Poland, Slovakia, Hungary, Lithuania and Latvia. Austria and the Netherlands have relatively many square meters per capita, while Russia, Turkey, Bulgaria and Romania have relatively few.
  • 34. Sources of Variety and the Prevalence of Choice 22 Comparing this data on the retail area per capita in 2010 as reported by Jahn and Müller (2011) to the purchasing power per capita in thousands for 2010 as reported by the International Monetary Fund (2011), we find that the two are moderately correlated (r(32) = .55, p < .001). People that can spend more also tend to have more store space, and thus most likely more choice. Furthermore, both retail sales area and purchasing power have increased over the last two decades, reflecting the growth in the amount of available product alternatives. Eurostat provides more insight in the sales area by providing data on the total sales area per store size category for 2007. This data shows that within Europe small stores are especially frequent in Portugal, Austria, France, Spain and Greece, with 70-90% of all sales area in stores less than 120 m2 and 90-95% under 399 m2 (own calculations). In Denmark, Finland, Norway, Germany and the Netherlands stores with a size up to 399 m2 own between 70-90% of all sales area and also larger formats are frequent. The UK has most large format sales area, with under 55% of sales area in stores smaller than 399 m2, and 16% in stores of more than 10,000 m2. In Eastern Europe, Bulgaria, Czech Republic, Latvia, Lithuania, Hungary, Romania, Slovakia and Estonia, there is a dual preference with 45% of total sales area belonging to stores less than 120 m2 and 46% in stores between 1,000 and 2,500 m2. This situation is much different from for example that of India, where 96% of its 12 million small retailers are smaller than 47 m2 (Khanna, 2008). 4. Store Formats and Assortments Assortment size can be split in breadth, the amount of categories, and depth, the amount of different items per category (Zentes, Mirschett &Schramm-Klein, 2011). Stores with deep assortments are called specialty stores, while stores with broad assortments are diversified. Stores such as book stores, audio visual stores, pet stores, vegetable stores, butchers, bike stores, home improvement stores and clothing stores are specialty stores, while hypermarkets and department stores fall in the diversified category. This split between specialty and diversified stores should be treated as a continuum. Globally category mitigation is an increasing trend, with retailers’ positioning themselves as specialist in a few categories, while also having a couple of other shallow categories to their assortment. Furthermore, for example department stores have both deep and broad assortments, while a small news stand
  • 35. Sources of Variety and the Prevalence of Choice 23 or a convenience store has relatively little breadth and little depth. In 2009 in Europe 79% of retail companies using store formats were specialized (own calculations based on Eurostat data). This percentage was higher for continental Western Europe (between 84 and 94%) and much lower for Eastern Europe, where on average only 55% was specialized. Assortment breadth and size together determine store format (detailed explanations of each store format can be found in Zentes, Mirschett & Schramm- Klein, 2011). When looking at the US and Western Europe, department stores have by large the broadest assortments, namely around 100,000 often subdivided in five or more broad product categories. The second largest assortments are found in hypermarkets which carry between 50 and 80,000 items (Levy & Weitz, 2009). Off- price and ‘do it yourself’ stores on average carry 50,000 items, and home improvement stores and category specialists carry between 20 to 40,000 items. Discount stores carry 30,000 items, and drug stores 10 to 20,000. Conventional supermarkets have around 10,000-15,000 items, and specialty stores which offer the most service have on average 5,000 items. Hard discounters are the smallest with on average 1,000 SKUs. Off-price and drug stores have the least space per item, while home improvement stores have the most. For grocery sales Lassere (2007) found that while in the USA hypermarkets are more than four times as popular as supermarkets and convenience stores and almost twice as popular as discounters. This situation is much different in other countries. Research by Igan and Suzuki (2011) shows that in most European countries three grocery store formats dominate, namely hypermarkets, supermarkets and discounters (see Appendix B, figure 15). These formats widely differ on their assortment sizes and in 2004 the most popular were supermarkets with an average market share of 40%, and least popular discounters with a market share below 10% in many markets. Hypermarkets were popular in countries such as France, Germany and the Czech Republic. Discounters were mainly popular in Germany and the countries around it, such as Austria, Hungary, Belgium and Denmark. Also convenience stores are popular in Germany.
  • 36. Sources of Variety and the Prevalence of Choice 24 5. Assortment Depth However, all this tells us relatively little about how many product alternatives a customer is faced with when making a purchase. To answer this question we turn to assortment depth. Fasolo, Hertwig, Huber and Ludwig (2009) examined differences in assortment sizes between one large and one small supermarket in Germany. For the twelve identified common categories they found that the large grocer always offered more choice than the smaller one. Where the large store on average offered 54 varieties the small one offered only 7. On average there were 8.6 times more options available in the large store. The difference was smallest for toast, where the large grocer offered nine varieties and the small one six, and largest for butter, where the small one had one variety and the large one 20. The most extensive assortments were found for yogurt (210 and 26 varieties respectively) and jam (138 and 13 varieties respectively). They found that large assortments had more attribute levels (not more attributes) and were able to maintain product difference by offering larger attribute ranges. A cross -cultural analysis of assortment depth was made by Einarsson (2007), who analyzed the amount of products offered by grocers in various countries. Higher amounts of choice were found in France and Finland than in for example Norway (see figure 8). These data however are highly unrepresentative, as all countries have many different store formats, which in turn differ on the assortments offered. Also the amount of variety within each category is influenced by the local popularity of the category. Furthermore, what one may count as variety, another observer may not, such as Rubens apples, six pre-packaged Rubens apples and 1 kilogram pre-packaged Rubens apples. Figure 8: Number of products offered by the average grocer per category in 2004. 300 200 100 0 Diary Meat Beverages Cold cuts Average Denmark Finland Iceland Norway Sweden France Based on: Einarsson (2007).
  • 37. Sources of Variety and the Prevalence of Choice 25 There is some cross-cultural data available when it comes to the hard- discounter Aldi (Nielsen, 2007). Assortment depth in these stores is highest in Austria and in the south of Germany, while being lower in Denmark, France and the Netherlands (see figure 9). Figure 9: Assortment depth; number of items sold by Aldi by category by country. 10 8,3 8,7 8 6,7 6,7 6,6 5,2 5,3 5,3 6 4 2 0 Source: redrawn from Nielsen (2007). It can be concluded that over the past decades the assortments offered to consumers have expanded as many new products have and continue to enter the markets. Approximations based on grocery stores show that the amount of products on offer has increased with more than 50% over the last decade, and the rise of the almost unlimited online assortments only add to this. Choice is especially abundant in the US and Western Europe. The country with the largest stores in Europe is the UK and also in Eastern Europe large formats have been increasingly popular. Within Europe the largest preference for small stores can be found in Southern Europe. Nowadays consumers are confronted with thousands of articles in most store formats and in large grocers even tens of thousands. The amount of choice is however hard to quantify, and the importance of category definitions when assessing choice can be seen clearly when comparing the amount of products per category of the Aldi data discussed before with those of Einarsson (2007). For now this concludes the discussion of retailers as we lay our focus on the customers, and specifically how and where they make purchasing decisions. Furthermore, the effects of variety during and after the purchase are explored with the objective to form a culturally sensitive model of the interactions between variety and purchase satisfaction.
  • 38. Consumer Demand for Variety 26 3. Consumer Demand for Variety 1. Sides to Variety In chapter two it has been detailed how choice has extended over the last 200 years. Furthermore, some data was provided on store size preference. This chapter will explain why diversity is often wanted by consumers and thus provides reasons for why stores have different assortment sizes from country to country. When choices are repeated two opposite tendencies manifest themselves as consumers ask themselves whether to stick with the favorite or to vary (Fishbach, Ratner & Zhang, 2011). Variety seeking is especially dominant in products consumed for hedonic reasons. Choosing variation is often internally motivated by (expected) satiation, the need for new stimuli and to avoid having a boring image in favor of an interesting and unique one. Furthermore, when consumers are new to a product category they may try to get more familiar and knowledgeable through trial. On the opposite side, however, consumers also seek stability and consistency and are motivated to demonstrate loyalty. This is especially strong when during the initial choice the consumer believes he has made some form of commitment. The extent to which consumers pursue variety seeking or commitment strategies is dependent on amongst others their expected satiation and cues in the purchasing environment. A reason for variety is that even though people may have stable preferences, or even be brand dependent, different people prefer a different brand. Godin (2003) relates the existence of specific product preferences to product class diversity. He asserts that product categories that have ‘otakus’, a Japanese term referring to people obsessed with a specific product comparable to connoisseurs, become more diverse. This is because otakus do not only try out as many different varieties as possible, but also tell their friends about it effectively increasing product class involvement. Furthermore, they encourage people to express strong brand and product preferences, and increase the importance of choice. Whether or not people try to establish uniqueness or stability choosing is related to identity. Chernev (2004) reports that an individual’s preference for product choice is positively related to the extent to which this choice is perceived to affect identity. Moreover, preference for choice is higher when self-image is centered on the notions of autonomy and independence. The relationship between demand for
  • 39. Consumer Demand for Variety 27 choice and identity increases in importance when decisions are communicated to others (Ratner and Kahn, 2002). In Western cultures having choice, of which the freedom to control individual purchasing is a core pillar, is highly valued (Schwartz, 2004). Research in healthcare shows that 95.6% of the 823 respondents found having choices extremely important and 30.3% thought that making choices was extremely important (Leotti, Iyengar & Ochsner, 2010). In agreement with this, another research shows that both animals and humans display a preference for choice over non-choice even when outcomes in both situations are the same, and making the second choice will require extra effort. Also choosing between more alternatives is reported to be more enjoyable and attractive than choosing between a more limited set (Iyengar & Lepper, 2000). Furthermore, neuroscience has shown that results that are obtained through choice are more gratifying than rewards that did not involve choice. Research has demonstrated a direct link between freedom, or better said its opposite namely confinement, and variety seeking. Levav and Zhu (2009) demonstrated that customers in aisles with less width seek more diversity than customers in broader aisles. Furthermore, they are more likely to choose lesser known brands. This difference in variety seeking was associated to the extent to which they felt physically confined. In fact, the aisle width does not need to be changed to create this felt confinement. Primers, such as questions about the aisle width, are sufficient to increase variety seeking. It is important to notice that aisle width had no effect on peoples expressed mood. Preference for choice in part reflects the general belief that more choice leads people to do better. This belief primarily relies on the logic that as the amount of alternatives increases, it is likely that some of the added alternatives are closer to the optimal solution than the alternatives in the original set were (Chernev, 2004). There is some research suggesting that there are limits to the amount of choice people find attractive. Arunachalam, Henneberry, Lusk and Norwood (2009) found that when American students were asked whether they’d like to choose from a set of 24 types of soda or a set of six containing a random selection of the larger set, 42% of the 45 students indicated to prefer choosing from the smaller set. In addition whether or not people like and do better on tasks involving choice depends on culture and does not directly transfer to cultures in which group decision making, and decision making by authorities are preferred (Iyengar, 2010). For example, Japanese children perform
  • 40. Consumer Demand for Variety 28 better when their mothers have chosen for them, while American children perform better when choosing themselves. An additional cultural source for different perceptions of choice is exposure to communism (Iyengar, 2010). For example elderly Eastern Europeans often associated choice with fear, as they had gotten used to not having any choice and had to adapt relatively quickly to the amount of choice offered in modern market economies. Although the development of most European countries, including Western Russia, was very similar for many centuries this changed when communism gained popularity. Communism, with its radically different production scheme relied much less on consumer demand to pull the market. And though there was marketing under these systems as well, they were much more product type rather than brand focused. As all skills are learned through culture, people that come from cultures that promoted the availability of few or no brand alternatives may now experience more difficulties discerning differences between various products and may therefore have more problems determining their preference as well as experience more trouble deciding on what to purchase. For example Iyengar (2010) found that many Russians did not perceive any difference between different types of soda when they were offered Coca Cola, Coca Cola Diet, Sprite, Dr. Pepper, Pepsi, Pepsi Diet and Mountain Dew. Rather they perceived this choice as ‘soda’ or ‘no soda’. When offered the choice between these seven sodas, orange juice and water this was perceived as three alternatives, namely juice, water or soda. Americans on the other hand perceive each type of soda as a separate alternative. This is just one example of how the perception of variety varies and shows how “the value of choice depends on our ability to perceive differences between the options” (ibid. 11:47-11:55). A study from Boyd and Bahn (2009) shows that ability to perceive variety indeed is related to assortment preference. Those who perceive little variety prefer assortments that offer less choice and those that perceive much variety prefer assortments offering more choice. When choosing right becomes more important this difference in preference becomes more pronounced. Fisher (1984) suggests that consumer preferences may diverge as societies become more affluent. As not having anything becomes less and less of a concern, people shift their attention to address satiation, thereby generating preference for choice. This is supported by our earlier finding of the positive relationship between
  • 41. Consumer Demand for Variety 29 the amount of choice in retail stores and purchasing power. Moreover, people that are faced with more choice have more chance to develop articulated preferences. And as more concrete preferences leads to increased preference for choice (in an experiment by Chernev, 2004, that will be discussed in more detail later) in demand driven economies a self-reinforcing cycle could drive choice to expand. Consumer demand for variety varies per country, consumer group, person, and product category. A study by Rozin, Fischler, Shields and Masson (2006) of the opinions of over 6,000 respondents shows that preference even within the western world differs substantially. In France, Germany and Switzerland approximately 30% of the population prefers choosing from 50 flavors of ice cream over choosing from 10. In Italy and the UK this percentage is higher (39 and 44 respectively). In the US the preference for the larger assortment is highest (56%). A similar pattern was found for restaurant menu size expectations, with around 20% of French, German and Swiss respondents expecting many, compared to 29% of Italians, 40% of English and 36% of Americans. A weak correlation was found between the two. For all countries older respondents were less likely to prefer having much choice. 2. Exposing Oneself to Choice Of course, consumers do not expose themselves to the same amount of choice for each decision. I fact most consumers actively choose either to expose themselves to choice or to avoid it. Kahn and Isen (1993) found that people look for more variety when they are in a good mood. Consumers that consistently expose themselves to as much choice as possible for the majority of choices they make are referred to as maximizers. The differences between maximizers and satisficers will be discussed shortly. First, however, a more comprehensive overview of choice exposure strategies is given. Haynes, Pipkin, Black & Cloud (1994) define six types of exposure style profiles based on a research on maternity apparel store patronage of 100 pregnant women (see table 2). First of all, there are shoppers, people with this profile know many stores selling the item, considered visiting many of these and visit many as well. These shoppers are highly involved, and show high interest in and enjoyment of the shopping process. Their attitude towards planning shopping trips is very positive. They are motivated little by the functionality (the search for information,
  • 42. Consumer Demand for Variety 30 negotiation, purchase etc.) and more by the symbolic (the effects on self-image and expectations related to social roles) and experiential (experiences resulting from the experience) aspects of shopping. In line with this they are relatively little product and price oriented. Demographically, this group includes the relatively old, wealthy and well-educated. Table 2: Choice exposure styles. Source: Haynes, Pipkin, Black & Cloud (1994). Secondly, there are narrowers. These people also know a lot of stores, but considered substantially less and visited even fewer. They are unlikely to want to plan shopping trips and are hardly motivated by the symbolic value of shopping. Narrowers pay more attention to brand than the average consumer and focus less on value for price. This group has no particular demographic profile, except that they tend to be relatively more career oriented. Thirdly, apathetics have low awareness of which stores are available, consider few stores and visit few stores. They are young and the most career focused, however have little income and little education. They put little emphasis on the experiential side of shopping, are highly product oriented, care relatively little about price, and want the store to have relatively much product knowledge. Fourth, loyals are highly involved with shopping which they value for its functionality; shopping allows them to get good value for money. While they know the fewest stores, they visit a moderate amount, showing interest in those stores
  • 43. Consumer Demand for Variety 31 which allow them to get the most out of their limited income. The fifth group, late bloomers, are similar to loyals but know, consider and go to more stores. They are likewise motivated by functionality, however instead of product involvement they are concerned with reducing price and time taken. The final group is the avoiders. Customers in this group dislike shopping the most, have little involvement in the shopping process and get little satisfaction from the process nor its outcomes. Although they know a moderate amount of stores they consider and also visit the least. Their income levels are high, and they view shopping as necessary and uninteresting. 3. Maximizers and Satisficers The decision whether to stop searching once a product with desired characteristics is found or to evaluate all available alternatives in an effort to make the best possible decision effectively determines exposure to choice. Swartz (2004) defines maximizers as people that “seek and accept only the best” (p.77), the alternative to which is satisficing; settling for the alternative that meets the criteria without worrying that another option may be better. Though maximizing-satisfying can be constructed as a general personality trait, it is unlikely for a person’s maximizing tendency to be fixed across product categories. Furthermore, there is an interrelation with the extent to which people know what they prefer, a characteristic which is further discussed in chapter 5. For maximizers every purchase has to be the best purchase that could be made, and therefore maximizers attempt to evaluate as many alternatives as are available to them and consequently take longer to decide. In addition Schwartz, Ward, Monterosso, Lyubomirsky, White and Lehman (2002) found that maximizing was correlated with the amount of social comparisons made and the frequency of counterfactual thinking during the purchase process. In conclusion, want for choice and reactions to choice are culturally, personality and circumstance dependent. The following chapters will investigate choice more in depth, with a particular emphasis on choosing from variety.
  • 44. Making Purchasing Decisions 32 4. Making Purchasing Decisions 1. The Purchase Decision In the following chapters the focus will be on the customer’s purchasing decisions and the effects of variety on their satisfaction with and after the purchase. The following chapter will take a look at both theory as well as findings on purchasing decisions. Firstly, the rational decision process will be discussed, followed by differences between rebuys and new purchases. The frequency that people make in store decisions, as well as what kind of decisions these are and how they are made is covered in the last two sections. All purchasing decisions start with people recognizing that they want or need a product; followed by a search for information as well as an evaluation of the alternatives based on set criteria (see Christ, 2008 for a more elaborate discussion of each stage). This can be followed by the purchase of a product, which then is evaluated during use. The decision making process outlined above is a rational one, in which the consumer mentally evaluates the alternatives, maximizing the expected utility (Hastie & Dawes, 2009). However, consumers are also influenced by other factors, including moods, emotions, the consumer’s habits, imitation of a role model and perceived cultural mandates. For example, when working memory is occupied with as little as remembering seven digits 63% of participants chose chocolate cake, while participants that only had two digits in their working memory chose chocolate cake only in 43% of cases (Shiv & Fedorikhin, 1999). This shows that when working memory is occupied, people more easily make choices in favor of physically pleasing alternatives, because the rational mind is too occupied to control impulses. For reaching a decision especially the information search and evaluation of alternatives stages are important. During these stages consumers make a (mental) ranked list of the relevant products available to them and their characteristics. The size of the evoked set (the mental list of alternatives) is not unlimited, as working memory cannot contain an infinite number of items, nor evaluate the items that it does contain on many aspects simultaneously, this is also known as bounded rationality (Hoyer, 1984). In a classic study by Miller (1956) he asserts that we can remember only a limited amount of information, more or less the size of seven digits or ‘chunks’ (the smallest meaningful memory units, including letters, acronyms,
  • 45. Making Purchasing Decisions 33 numbers, colors, etc.) if we focus on one characteristic. If we focus on more characteristics the total amount of what we remember goes up, while the amount of items remembered per category goes down, and also the accuracy of our memory goes down. There are some techniques people use to increase the sets they can handle, such as making relative judgments, increase the amount of dimensions, or split the decision. People can also write the options down, as well as commit knowledge to their long term memory. 2. Involvement, Information Search and Decision Novelty Consumers do not go through the full decision process for each purchase as extensively. A combination of two purchase characteristics seems to largely determine the extent to which people engage in the search for information and evaluate the various alternatives (Christ, 2008). These two characteristics are involvement and decision novelty. These two characteristics combined lead to four different types of purchasing decisions. Decisions that have been made repeatedly before and are considered uninvolving and are referred to as routine purchases or straight rebuys. Purchases that are relatively uninvolving but novel are called minor new purchases, and purchases that are relatively involving and have not been made before are called major new purchases. Finally, there are relatively involving repeated purchases. When making routine purchases customers rely on a previous purchasing decision for their current product choice, minimizing cognitive effort (Hoyer, 1984). They have found the product which satisfies them, may feel a certain loyalty to this product, but most importantly give little thought to alternative products. Routine purchases allow customers to completely ignore approximately 75% of the items on the shelves (Swartz, 2004). Customers planning a routine purchase may still be persuaded to evaluate other alternatives when there is a sales promotion. Also when an item is out of stock, customers have to make either a minor new purchase, visit another store or come back later. Under these conditions it may be found that what was thought to be an uninvolving product is involving after all. Routine purchases are discussed in more detail in the following section. A second type of purchasing decision is customers making a minor new purchase. As the product is neither expensive nor highly involving they make use of
  • 46. Making Purchasing Decisions 34 limited problem solving. Consumers making these types of decisions are unlikely to search information before entering the store and are likely to buy whichever product alternative is offered as long as it meets their requirements and the price does not exceed their expectations. A common decision strategy, the use of heuristics, is discussed later in this chapter. Finally, there are major purchases, which in the case of non-professional consumers are unlikely to be re-buys as major purchases within one product category are rather infrequent. Furthermore, if there is a need to make a large purchase more than once this is often due to product failure, in which case alternatives will be considered. When customers are faced with major purchases, due to high involvement and/or high prices, they are likely to take much time for each decision making step evaluating many of the offered options in detail, visiting multiple stores and search online for information (Beatty & Smith, 1987). 3. In-store Decisions Approximately two out of three purchases involve in-store decision making (Inman, Winer & Ferraro, 2009). The MacFadden Communications Group LLC (1996) reports more details for the mass merchandising retail sector based on a sample of 1,399 American consumers. Namely, 41.5% of home furnishing purchases were found to be decided in store. Domestics, such as towels, blankets and table linens were often bought spontaneously with 48% of purchases being unplanned. Also electronics were often (40%) decided upon in the store. In store decision making in this context was defined as those consumers that either have no or only a general idea as to what they are seeking, but have not yet decided on the product they want. The Point-Of-Purchase Advertising Institute (POPAI, 1995, as cited in Shimp, 2008) reports that items with particularly high in-store decision rates in supermarkets were first aid (93%), toys, crafts and sporting goods (93%), housewares (90%), stationary (90%) and candy (89%). For mass merchandise purchases high in-store decision rates were found in the following categories apparel accessories (92%), foils and other food wraps (91%), hardware electric and plumbing (90%), infant and toddler wear (90%) and garbage bags (88%). Examples of product categories with exceptionally low in-store decision rates for supermarkets