

Empfohlen
Weitere ähnliche Inhalte
Ähnlich wie Product Sprint Backlog 0 03
Ähnlich wie Product Sprint Backlog 0 03 (20)
Mehr von Ram Srivastava
Mehr von Ram Srivastava (20)
Kürzlich hochgeladen
Kürzlich hochgeladen (20)
Product Sprint Backlog 0 03
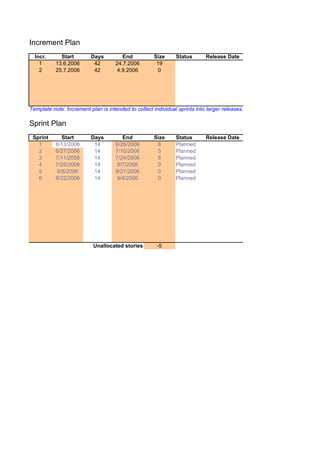
- 1. Increment Plan Incr. Start Days End Size Status Release Date 1 13.6.2006 42 24.7.2006 19 2 25.7.2006 42 4.9.2006 0 Template note: Increment plan is intended to collect individual sprints into larger releases. In smaller projects, this is not ne Sprint Plan Sprint Start Days End Size Status Release Date 1 6/13/2006 14 6/26/2006 8 Planned 2 6/27/2006 14 7/10/2006 3 Planned 3 7/11/2006 14 7/24/2006 8 Planned 4 7/25/2006 14 8/7/2006 0 Planned 5 8/8/2006 14 8/21/2006 0 Planned 6 8/22/2006 14 9/4/2006 0 Planned Unplanned Unplanned Unplanned Unplanned Unplanned Unplanned Unplanned Unplanned Unplanned Unallocated stories -5
- 2. Goal ger releases. In smaller projects, this is not needed. Goal Increment Planning 1 Specification and prototype development 1 Specification and prototype development 1 Specification and prototype development 2 Specification and prototype development, documentation 2 Usability test, documentation, prototype corrections 2
- 3. Product Backlog Story ID Story name Status Size Sprint Priority Comments 1 This is a sample story Done 3 1 2 This is another sample story Ongoing 5 1 You can add comments here to add key detail or explanation to the story. For larger definitions, use external tools and materials. 3 This is a third sample story Planned 3 2 4 This is a fourth sample story Planned 8 3 5 This is an unallocated sample story Planned 13 6 This is a removed story Removed 5
- 4. Product Backlog Burndown Chart Original planned size 137 Velocity and Remaini Count trend from last 3 sprints 12 Velocity (points per sprint) Original estimate 30 10 Last 3 sprints 25.0 Realized total average 25.0 8 Average last 8 25.0 Avg. worst 3 in last 8 25.0 Trend 25.0 6 Predictions - Completion at the end of sprint… 4 Original estimate - Min 3 Original estimate - Avg 5 Original estimate - Max 8 2 Last 3 sprints 6 Realized average 6 0 Average last 8 6 Avg. worst 3 in last 8 6 Trend 6 Development Vel Realized + St. Dev 6 12 Realized - St. Dev 6 10 Remain. Planned Realized Current Total Sprint Work Work Work Size 8 1 137 23 23 137 2 114 29 27 137 3 87 31 137 6 4 56 28 137 5 28 28 137 4 6 7 8 2 9 10 11 0 12 13 14 15 16 17 18 19 20 21 22 23 24
- 5. Velocity and Remaining Work Note: In this chart, the tops of the bars show the amount of actual (or planned) implemented functionality at the beginning of each sp The bottoms of the bars show the changes in project scope (i.e. if the amount of story points in the project increases, the bottoms move lower). The length of the bars indicate the estimated size of the project at the beginning of each sprint. The red line indicates the current planned scope. Development Velocity
- 6. show the amount of actual onality at the beginning of each sprint. e changes in project scope oms move lower). The length d size of the project at the t planned scope.
- 7. Sprint 1 Backlog 35 Work Remaining (h) 30 25 Row 10 20 Row 11 15 Row 12 10 5 0 Sprint implementation days 5 Effort Remaining on imp Trend calculated based on last 5 Days Totals 33 33 Task name Story ID Responsible Status Est. 1 Example task 1 Danny Dev Done 5 5 Example task 2 1 Tina Tester Ongoing 7 7 Example task 3 2 Danny Dev Ongoing 12 12 <Delete these example lines> 2 Planned 9 9
- 9. 35 30 25 20 15 10 5 0 Remaining on implementation day… 30 23 21 2 3 4 5 2 0 7 2 2 12 12 10 9 9 9
- 13. Sprint 1 Backlog 1 0.9 Work Remaining (h) 0.8 0.7 Row 10 0.6 Row 11 0.5 0.4 Row 12 0.3 0.2 0.1 0 Sprint implementation days 5 Effort Remaining on impleme Trend calculated based on last 5 Days Totals 0 0 Task name Story ID Responsible Status Est. 1 2
- 15. Remaining on implementation day… 3 4 5
- 19. Story ID: 1 Story: This is a sample story Task: Example task Responsible Person: Danny Dev Initial Work Work Estimate 5 Done Left Story ID: 1 Story: This is a sample story Task: Example task 2 Responsible Person: Tina Tester Initial Work Work Estimate 7 Done Left Story ID: 2 Story: This is another sample story Task: Example task 3 Responsible Person: Danny Dev Initial Estimate 12 Work Done Work Left Story ID: 2 Story: This is another sample story Task: <Delete these example lines> Responsible Person: Initial Work Work Estimate 9 Done Left