Stem And Leaf
•Als PPT, PDF herunterladen•
0 gefällt mir•472 views

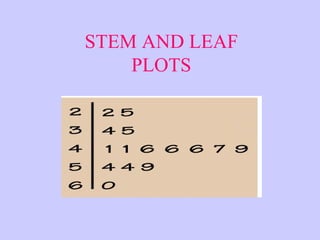
The document provides examples of stem and leaf plots used to organize and summarize different data sets. Stem and leaf plots break numbers down into "stems" which are placed left of the decimal and "leaves" which are right of the decimal. Three examples are given showing stem and leaf plots of temperatures, Babe Ruth's home runs by year, and ages of US presidents at inauguration.
![[object Object],[object Object],[object Object],[object Object]](data:image/gif;base64,R0lGODlhAQABAIAAAAAAAP///yH5BAEAAAAALAAAAAABAAEAAAIBRAA7)
Empfohlen
Weitere ähnliche Inhalte
Andere mochten auch
Andere mochten auch (20)
Kürzlich hochgeladen
Kürzlich hochgeladen (20)
Stem And Leaf
- 1. STEM AND LEAF PLOTS
- 3. High temperatures for the last week: 72, 78, 87, 90, 88, 86, 87, 89 Stem 7 8 9 Leaf 2 8 6 7 7 8 9 0 7 2 = 72 degrees
- 5. 2 3 6 7 8 9 9 0 0 1 1 1 1 2 2 4 4 4 4 5 5 5 6 6 6 7 7 7 7 8 0 1 1 1 2 4 4 5 8 9 Stem Leaf 4 5 6 Age of United states Presidents at their First Inauguration: 57 61 57 57 58 57 61 54 68 51 49 64 50 48 65 52 56 46 54 49 50 47 55 54 42 51 56 55 51 54 51 60 62 43 55 56 61 52 69 64 (Through the 40 th presidency) Key: 5 7 means 57