Call Girls Electronic City Just Call 👗 7737669865 👗 Top Class Call Girl Servi...
Sample data report dmsi
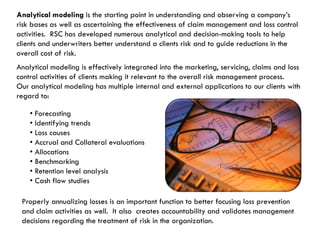
1. Analytical modeling is the starting point in understanding and observing a company’s
risk bases as well as ascertaining the effectiveness of claim management and loss control
activities. RSC has developed numerous analytical and decision-making tools to help
clients and underwriters better understand a clients risk and to guide reductions in the
overall cost of risk.
Analytical modeling is effectively integrated into the marketing, servicing, claims and loss
control activities of clients making it relevant to the overall risk management process.
Our analytical modeling has multiple internal and external applications to our clients with
regard to:
• Forecasting
• Identifying trends
• Loss causes
• Accrual and Collateral evaluations
• Allocations
• Benchmarking
• Retention level analysis
• Cash flow studies
Properly annualizing losses is an important function to better focusing loss prevention
and claim activities as well. It also creates accountability and validates management
decisions regarding the treatment of risk in the organization.
2. . ~
0
L(
O'
~
0
0
O'
c ~
0
L(
o CO
~ ~
0
(1
Q) ã5
0
CO
a: ii ~
0
ë .. L(
f'
~
..
:i ~
0
Ü 0
f'
(/
(1 Y:
~
0
L(
i: f' CO
.2 ~ ~
0
(1 fd 0
CO
ei ~
ro 0 ~
0
;; ã5 L(
o .Q L( (/
~ ~ ~~
0 :¡
o ro ° i:
.-
tJ CO L( I1
(,
..
~ I1
~ 0
-. ll
L(
Ct ~
0
.~~ 0
-.
(J tJ ~ ~
0
C tJ ti L(
C'
o ~
0
.. ~ 0
~ cu (/ C'
~
0
C. C) Q) L(
Ct (/ N
E ~ (/ ~
0
CO .. .3 0
N
en § ~ ~
0
"' L(
..
:~ ~
0
"' 0
..
i: ~
0
0
.. ~
0
L(
(h
..
I10
~ 0 0
0 0
0 0
0 0
0 0
0 0
0
0 0 q o. q o. 0 o.
(/
I1
0
0 0
0 0
0 0
0 0
0 0
0 0
0
(/
(/
f' CO L( -. C' N ..
0
..
~
o .. -. C' N f' co f' co O' C' -. C' f' 0 co O' .. co L(
O' co L( .. co .. co NON C' co co .. O' .. O' C' -. .g ¡i,
Q)T5~.. c:~
..~u,""ca+=
I/
ll co 0 N C' -. co f' O' .~ÑmoomriÑ~~~ .
N ririò~OOÑ~ 0 N C' L( f' 0 C' co .. f' O'
L( f' 0 co co co co C' -. -. co L( co co 0 co f' C' -.
;;cnO)~i3a5
.. .. .. .. .. .. .. N N N N N C' C' C' -. -. L(
'EQ)ca..::~~
Q) :5 .~ :: lh
en
)(
..
~ro~~(J..
c.~~~~Ln
-
en
en
C
ro ~
(/
~ '¡: .- :J z. en
(f:5afU(1Q)
o
.. t~
cro
~uõ.g~£
_uE-Q)~
.. Õ°tl'S~O
(JXo-°ãi
en
~
:¡ ~
i: ~ 0 'è~ 0 ~ 0
~ 0 ': ':':I~
I~
~ l
f-
~g¡Q)(Ju.c
ë~o.."O-=æ
~;:Ll co æ~ Ef:
0 '; '; ':
':
o 0 10 0 '* ?f ?f '; 0 ': 0
Q) L( 0 L( 0 L( 0 L( ~~-æ ~~~
0 o L( 10 L( o L( 0 L( L( 0 L(
CJ
~
.. N N C' C' L( co co f' f' co co O' O' Q)g~æëi:
Q)
ii
-. -. 1L(
t::§*i3e.Q ~:
I ~.- :i ti ~
"1.'
3. Sample, Inc.
Rate Comparison by Location
Location 1 Loss Rate 2/1/09
Loss Rate 5/1/09
Location 2
Location 3
Location
Location 4
Location 5
All-Year Rates
Location 6 Q1 = 1.988
Q2 = 2.005
Location 7
Location 8
0 2 4 6 8
Q1 Q2
Loss Rate
4. Sample, Inc.
Estimated Cost at Various Loss Levels @ 10% Discount Rate
Insurance Co. 1
1,700,000 Insurance Co. 2
Equilibrium is at Guaranteed Cost
approximately $390K
of losses.
1,200,000
700,000
Carrier Pick RSC Low Pick RSC High Pick
$460K $530K $740K
200,000
100,000 200,000 300,000 400,000 500,000 600,000 700,000 800,000 900,000
Loss Levels
5. Sample, Inc.
Loss Breakout - Incurred
by Site Location
% of
Site Location Total Incurred
Incurred
All Others
Location 1 $ 394,559.56 39.99%
13.23%
Location 2 $ 236,663.33 23.99%
Location 3 $ 224,857.40 22.79%
All Others $ 130,506.24 13.23%
Location 4 $ 58,043.83 5.88%
Location 5 $ 35,388.56 3.59% Location 1
Location 6 $ 26,169.82 2.65% 39.99%
Location 7 $ 10,904.03 1.11%
TOTAL $ 986,586.53 100.00%
Location 3
22.79%
Location 2
23.99%
12. Sample, Inc.
Loss Breakout - Count
by Body Part
Total % of
Body Part Spine
Count Count Knee
Spine 2 0.53% 0.53%
9.36%
Knee 35 9.36%
Wrist 21 5.61%
Wrist
All Others 316 84.49%
Shoulder(s) 17 4.55% 5.61%
Foot 22 5.88%
Neck 1 0.27%
Lower back area 52 13.90%
Ankle 25 6.68%
Abdomen 8 2.14%
Finger(s) 69 18.45%
Hand 37 9.89%
Disc 4 1.07%
Upper back area 8 2.14%
Multiple Body Parts 7 1.87%
Upper Arm 8 2.14%
Lower Leg 13 3.48% All Others
Face 10 2.67% 84.49%
Skull 16 4.28%
Eye(s) 19 5.08%
TOTAL 374 100.00%