Toronto Real Estate Board Market Watch for October 2012
•
1 gefällt mir•609 views

- Housing sales in the Greater Toronto Area decreased 7.1% in October 2012 compared to October 2011, while the average selling price increased 6.2% to $503,479. - Despite fewer sales, prices continued to rise above the rate of inflation due to low housing supply and ongoing competition between buyers, especially in the market for low-rise homes. - The annual rate of price growth has been gradually slowing in recent months as the market supply has improved.

Empfohlen
Weitere ähnliche Inhalte
Was ist angesagt?
Was ist angesagt? (11)
Andere mochten auch
Ähnlich wie Toronto Real Estate Board Market Watch for October 2012
Ähnlich wie Toronto Real Estate Board Market Watch for October 2012 (19)
Mehr von Richard Silver, Certified International REALTOR®
Mehr von Richard Silver, Certified International REALTOR® (20)
Kürzlich hochgeladen
Kürzlich hochgeladen (20)
Toronto Real Estate Board Market Watch for October 2012
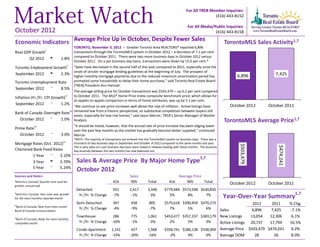
- 1. For All TREB Member Inquiries: (416) 443-8152 For All Media/Public Inquiries: October 2012 (416) 443-8158 Economic Indicators Average Price Up in October, Despite Fewer Sales TorontoMLS Sales Activity1,7 TORONTO, November 3, 2012 – Greater Toronto Area REALTORS® reported 6,896 Real GDP Growthi transactions through the TorontoMLS system in October 2012 – a decrease of 7.1 per cent compared to October 2011. There were two more business days in October 2012 versus Q2 2012 t 1.8% October 2011. On a per business day basis, transactions were down by 15.6 per cent.* Toronto Employment Growthi i “Sales have decreased in the second half of this year compared to 2011, especially since the onset of stricter mortgage lending guidelines at the beginning of July. The prospect of September 2012 t 2.3% 6,896 7,425 higher monthly mortgage payments due to the reduced maximum amortization period has Toronto Unemployment Rate prompted some households to delay their home purchase,” said Toronto Real Estate Board (TREB) President Ann Hannah. September 2012 q 8.5% The average selling price for October transactions was $503,479 – up 6.2 per cent compared Inflation (Yr./Yr. CPI Growth) ii to October 2011. The MLS® Home Price Index composite benchmark price, which allows for an apples-to-apples comparison in terms of home attributes, was up by 5.1 per cent. September 2012 q 1.2% October 2012 October 2011 “We continue to see price increases well above the rate of inflation. Active listings have iii remained low from a historic perspective, so substantial competition between buyers still Bank of Canada Overnight Rate exists, especially for low-rise homes,” said Jason Mercer, TREB’s Senior Manager of Market October 2012 q 1.0% Analysis. TorontoMLS Average Price1,7 iv “It should be noted, however, that the annual rate of price increase has been edging lower Prime Rate over the past few months as the market has gradually become better supplied,” continued October 2012 q 3.0% Mercer. *NOTE: The majority of transactions are entered into the TorontoMLS system on business days. There was a iv Mortgage Rates (Oct. 2012) mismatch of two business days in September and October of 2012 compared to the same months last year. $503,479 $474,241 This is why sales on a per business day basis were noted in releases dealing with these months. The business Chartered Bank Fixed Rates day anomaly between the two months has now balanced out. 1 Year q 3.10% 1,7 3 Year u 3.70% Sales & Average Price By Major Home Type 5 Year q 5.24% October 2012 Sources and Notes: Sales Average Price i Statistics Canada, Quarter-over-quarter 416 905 Total 416 905 Total October 2012 October 2011 growth, annualized Detached 931 2,417 3,348 $779,484 $573,598 $630,850 ii Statistics Canada, Year-over-year growth 1,7 for the most recently reported month Yr./Yr. % Change -7% -1% -3% 5% 8% 7% Year-Over-Year Summary Semi-Detached 347 458 805 $575,618 $390,459 $470,273 2012 2011 % Chg. iii Bank of Canada, Rate from most recent Yr./Yr. % Change -4% -9% -7% 7% 5% 6% Sales 6,896 7,425 -7.1% Bank of Canada announcement iv Townhouse 286 775 1,061 $453,477 $357,237 $383,179 New Listings 13,054 12,306 6.1% Bank of Canada, Rates for most recently completed month Yr./Yr. % Change -10% -1% -3% 2% 5% 3% Active Listings 20,737 17,794 16.5% Condo Apartment 1,141 427 1,568 $358,741 $286,138 $338,969 Average Price $503,479 $474,241 6.2% Yr./Yr. % Change -14% -20% -16% -2% 4% 0% Average DOM 28 26 8.0%
- 2. Toronto Real Estate Board SALES BY PRICE RANGE AND HOUSE TYPE1,7 OCTOBER 2012 Price Range Detached Semi-Detached Att/Row/Twnhouse Condo Townhouse Condo Apt Link Co-op Apt Det Condo Co-ownership Apt Total $0 to $99,999 2 1 0 3 18 0 0 0 1 25 $100,000 to $199,999 43 14 4 48 207 3 2 0 3 324 $200,000 to $299,999 253 54 76 160 505 19 3 2 4 1,076 $300,000 to $399,999 480 222 193 211 466 19 1 3 1 1,596 $400,000 to $499,999 668 267 125 66 203 29 0 0 0 1,358 $500,000 to $599,999 585 127 73 23 79 21 0 0 0 908 $600,000 to $699,999 407 49 29 11 33 2 0 0 0 531 $700,000 to $799,999 299 29 4 9 18 0 0 0 0 359 $800,000 to $899,999 176 17 10 4 17 0 0 1 0 225 $900,000 to $999,999 97 9 2 3 5 0 0 0 0 116 $1,000,000 to $1,249,999 130 9 3 0 11 0 0 0 0 153 $1,250,000 to $1,499,999 83 2 1 1 0 0 0 0 0 87 $1,500,000 to $1,749,999 50 4 1 1 4 0 0 0 0 60 $1,750,000 to $1,999,999 21 0 0 0 0 0 0 0 0 21 $2,000,000 + 54 1 0 0 2 0 0 0 0 57 Total Sales 3,348 805 521 540 1,568 93 6 6 9 6,896 Share of Total Sales 48.5% 11.7% 7.6% 7.8% 22.7% 1.3% 0.1% 0.1% 0.1% - Average Price $630,850 $470,273 $423,647 $344,135 $338,969 $403,736 $229,417 $396,983 $219,222 $503,479 SALES BY PRICE RANGE AND HOUSE TYPE1,7 YEAR-TO-DATE, 2012 Price Range Detached Semi-Detached Att/Row/Twnhouse Condo Townhouse Condo Apt Link Co-op Apt Det Condo Co-ownership Apt Total $0 to $99,999 37 3 7 21 193 0 7 0 8 276 $100,000 to $199,999 544 149 52 646 2,241 12 37 0 13 3,694 $200,000 to $299,999 2,732 573 999 2,002 5,756 320 24 19 38 12,463 $300,000 to $399,999 5,782 2,656 1,957 2,211 5,324 257 21 29 11 18,248 $400,000 to $499,999 7,184 2,834 1,674 702 2,164 335 10 9 6 14,918 $500,000 to $599,999 6,413 1,048 694 209 810 285 4 4 0 9,467 $600,000 to $699,999 4,592 490 333 119 394 67 1 4 0 6,000 $700,000 to $799,999 3,085 277 96 83 172 9 3 1 0 3,726 $800,000 to $899,999 2,018 154 72 30 108 0 0 1 0 2,383 $900,000 to $999,999 1,119 77 30 11 54 0 0 0 0 1,291 $1,000,000 to $1,249,999 1,432 68 28 15 102 2 2 1 0 1,650 $1,250,000 to $1,499,999 913 38 9 4 40 0 1 0 0 1,005 $1,500,000 to $1,749,999 479 22 9 2 30 0 0 1 0 543 $1,750,000 to $1,999,999 267 7 2 0 10 0 0 0 0 286 $2,000,000 + 603 6 2 1 25 0 0 0 0 637 Total Sales 37,200 8,402 5,964 6,056 17,423 1,287 110 69 76 76,587 Share of Total Sales 48.6% 11.0% 7.8% 7.9% 22.7% 1.7% 0.1% 0.1% 0.1% - Average Price $628,207 $459,667 $423,184 $329,183 $337,676 $413,646 $294,687 $409,235 $244,451 $499,350 Page 3 July 2010 Market Watch, October 2012 2
- 3. Toronto Real Estate Board ALL HOME TYPES, OCTOBER 2012 SUMMARY OF EXISTING HOME TRANSACTIONS ALL TREB AREAS Number of Sales Dollar Volume1 Average Price1 Median Price1 New Listings2 SNLR (Trend) 8 Active Listings3 Mos. Inv. (Trend)9 Avg. SP/LP 4 Avg. DOM5 TREB Total 6,896 $3,471,990,813 $503,479 $425,000 13,054 55.5% 20,737 2.4 98% 28 Halton Region 454 $268,340,565 $591,059 $465,000 781 58.5% 1,369 2.4 97% 31 Burlington 72 $33,739,250 $468,601 $408,250 119 58.8% 237 2.6 98% 31 Halton Hills 75 $34,387,500 $458,500 $409,900 110 68.4% 196 2.3 99% 29 Milton 124 $59,258,549 $477,892 $420,000 261 57.2% 352 1.9 97% 26 Oakville 183 $140,955,266 $770,247 $597,120 291 56.2% 584 2.8 96% 35 Peel Region 1,449 $651,437,734 $449,577 $406,000 2,716 54.8% 4,276 2.3 97% 27 Brampton 582 $237,593,568 $408,236 $389,750 1,164 53.7% 1,784 2.2 98% 26 Caledon 61 $32,791,650 $537,568 $490,000 133 54.2% 320 3.7 98% 33 Mississauga 806 $381,052,516 $472,770 $414,000 1,419 55.8% 2,172 2.2 97% 27 City of Toronto 2,730 $1,471,984,594 $539,188 $437,639 5,568 52.6% 8,492 2.6 98% 26 ! TURN PAGE FOR CITY OF TORONTO TABLES OR CLICK HERE: York Region 1,208 $718,392,047 $594,695 $531,500 2,426 55.4% 4,047 2.3 97% 28 Aurora 58 $30,826,880 $531,498 $444,200 132 62.9% 204 2.0 98% 22 E. Gwillimbury 30 $15,165,628 $505,521 $431,750 44 60.6% 103 2.9 97% 36 Georgina 60 $18,670,687 $311,178 $300,000 103 63.4% 227 3.1 98% 35 King 17 $16,283,000 $957,824 $880,000 55 49.6% 155 5.6 93% 65 Markham 306 $187,428,812 $612,512 $534,500 618 54.3% 1,019 2.2 97% 29 Newmarket 108 $49,335,550 $456,811 $421,500 172 70.4% 234 1.4 98% 22 Richmond Hill 251 $168,194,015 $670,096 $595,000 515 51.4% 841 2.2 97% 27 Vaughan 307 $191,692,295 $624,405 $575,000 671 53.4% 1,047 2.3 97% 25 Whitchurch-Stouffville 71 $40,795,180 $574,580 $518,000 116 52.9% 217 3.2 97% 34 Durham Region 849 $287,897,267 $339,102 $314,000 1,209 64.7% 1,758 2.1 98% 28 Ajax 149 $54,727,516 $367,299 $353,500 227 66.5% 264 1.6 99% 22 Brock 18 $4,496,100 $249,783 $193,500 33 43.1% 125 8.1 96% 74 Clarington 125 $35,569,330 $284,555 $268,000 168 67.1% 262 2.2 98% 31 Oshawa 206 $53,376,800 $259,111 $234,500 278 66.1% 371 1.9 98% 27 Pickering 121 $48,960,532 $404,632 $369,900 176 61.9% 234 2.0 98% 26 Scugog 24 $8,237,700 $343,238 $268,000 40 53.8% 112 4.4 96% 49 Uxbridge 34 $15,754,400 $463,365 $388,500 36 56.1% 106 4.4 97% 58 Whitby 172 $66,774,889 $388,226 $355,000 251 67.9% 284 1.6 99% 20 Dufferin County 52 $17,417,650 $334,955 $311,500 86 72.6% 129 2.4 98% 33 Orangeville 52 $17,417,650 $334,955 $311,500 86 72.6% 129 2.4 98% 33 Simcoe County 154 $56,520,956 $367,019 $327,950 268 60.0% 666 3.7 97% 46 Adjala-Tosorontio 11 $5,550,500 $504,591 $439,000 28 49.8% 84 6.5 96% 98 Bradford West Gwillimbury 42 $17,966,000 $427,762 $410,000 73 63.9% 149 2.3 97% 33 Essa 19 $5,875,640 $309,244 $237,000 25 53.8% 85 4.9 97% 45 Innisfil 46 $14,742,016 $320,479 $292,500 72 55.8% 188 4.5 98% 50 New Tecumseth 36 $12,386,800 $344,078 $299,500 70 68.5% 160 3.1 97% 39 Page 3 July 2010 Market Watch, October 2012 3
- 4. Toronto Real Estate Board ALL HOME TYPES, OCTOBER 2012 SUMMARY OF EXISTING HOME TRANSACTIONS CITY OF TORONTO MUNICIPAL BREAKDOWN 1 1 1 2 8 3 4 5 Number of Sales Dollar Volume Average Price Median Price New Listings SNLR (Trend) Active Listings Mos. Inv. (Trend)9 Avg. SP/LP Avg. DOM TREB Total 6,896 $3,471,990,813 $503,479 $425,000 13,054 55.5% 20,737 2.4 98% 28 City of Toronto Total 2,730 $1,471,984,594 $539,188 $437,639 5,568 52.6% 8,492 2.6 98% 26 Toronto West 723 $356,786,062 $493,480 $431,500 1,386 55.3% 2,073 2.6 99% 25 Toronto W01 74 $44,030,100 $595,001 $509,000 87 52.0% 132 2.5 100% 24 Toronto W02 67 $40,029,200 $597,451 $530,000 133 64.1% 135 1.4 100% 20 Toronto W03 64 $24,742,017 $386,594 $395,000 86 66.3% 120 1.7 99% 21 Toronto W04 79 $32,680,430 $413,676 $416,000 135 57.3% 207 2.7 97% 25 Toronto W05 72 $26,304,091 $365,335 $369,500 146 57.2% 257 2.9 97% 30 Toronto W06 106 $49,465,600 $466,657 $430,000 278 42.7% 459 3.8 98% 29 Toronto W07 28 $18,901,789 $675,064 $600,500 44 71.1% 39 1.3 103% 12 Toronto W08 128 $82,155,746 $641,842 $557,750 277 56.7% 394 2.6 99% 25 Toronto W09 41 $17,731,339 $432,472 $470,000 71 55.3% 123 2.9 99% 32 Toronto W10 64 $20,745,750 $324,152 $374,000 129 53.8% 207 2.9 97% 28 Toronto Central 1,214 $770,025,337 $634,288 $460,000 2,802 48.1% 4,508 2.9 98% 29 Toronto C01 305 $142,405,018 $466,902 $394,000 749 43.8% 1,325 3.5 98% 32 Toronto C02 80 $73,102,461 $913,781 $770,000 158 46.8% 273 3.6 99% 26 Toronto C03 43 $39,610,136 $921,166 $675,000 95 59.3% 117 2.2 99% 18 Toronto C04 84 $82,981,029 $987,869 $824,000 166 54.2% 244 2.3 99% 22 Toronto C06 22 $13,059,800 $593,627 $650,000 48 51.7% 96 2.7 98% 24 Toronto C07 87 $48,853,363 $561,533 $415,000 244 46.7% 373 2.8 97% 31 Toronto C08 143 $66,790,440 $467,066 $392,500 326 49.3% 468 2.8 97% 28 Toronto C09 28 $29,438,965 $1,051,392 $797,500 54 56.3% 82 2.6 99% 25 Toronto C10 64 $46,181,881 $721,592 $691,500 127 60.1% 140 1.7 100% 27 Toronto C11 38 $23,072,612 $607,174 $311,000 72 55.3% 134 2.3 99% 29 Toronto C12 24 $42,824,000 $1,784,333 $1,495,000 77 45.5% 168 4.1 93% 40 Toronto C13 67 $35,239,088 $525,957 $438,000 128 58.3% 174 2.0 99% 28 Toronto C14 131 $74,332,218 $567,422 $421,800 331 44.3% 519 2.9 98% 28 Toronto C15 98 $52,134,326 $531,983 $473,500 227 47.2% 395 2.9 96% 35 Toronto East 793 $345,173,195 $435,275 $420,000 1,380 58.7% 1,911 2.0 99% 24 Toronto E01 89 $51,409,846 $577,639 $562,000 143 61.9% 144 1.5 101% 15 Toronto E02 79 $47,295,022 $598,671 $530,000 117 63.1% 106 1.4 100% 13 Toronto E03 99 $51,786,937 $523,100 $517,000 147 60.9% 168 1.5 100% 20 Toronto E04 96 $32,825,787 $341,935 $385,000 166 58.4% 236 2.2 98% 23 Toronto E05 79 $30,417,988 $385,038 $360,000 138 62.0% 177 1.7 98% 26 Toronto E06 27 $14,682,964 $543,813 $525,000 63 54.6% 73 1.8 98% 14 Toronto E07 69 $26,173,064 $379,320 $369,000 156 55.3% 242 2.6 97% 24 Toronto E08 50 $22,675,233 $453,505 $427,500 106 55.1% 166 2.5 98% 23 Toronto E09 91 $28,077,193 $308,541 $291,000 158 55.9% 271 2.6 98% 36 Toronto E10 49 $21,322,008 $435,143 $448,000 98 60.3% 154 2.0 98% 30 Toronto E11 65 $18,507,153 $284,725 $291,000 88 57.5% 174 2.4 97% 36 Page 3 July 2010 Market Watch, October 2012 4
- 5. Toronto Real Estate Board ALL HOME TYPES, YEAR-TO-DATE 2012 SUMMARY OF EXISTING HOME TRANSACTIONS ALL TREB AREAS Number of Sales Dollar Volume1 Average Price1 Median Price1 New Listings2 Avg. SP/LP 4 Avg. DOM5 TREB Total 76,587 $38,243,756,642 $499,350 $420,000 144,216 99% 24 Halton Region 4,995 $2,818,032,341 $564,171 $470,000 8,883 98% 25 Burlington 734 $349,653,610 $476,367 $404,750 1,294 98% 28 Halton Hills 778 $359,669,226 $462,300 $429,250 1,189 98% 29 Milton 1,516 $701,730,519 $462,883 $428,250 2,748 99% 19 Oakville 1,967 $1,406,978,986 $715,292 $597,000 3,652 97% 28 Peel Region 16,705 $7,340,906,751 $439,444 $399,000 31,622 98% 23 Brampton 7,140 $2,890,126,508 $404,780 $384,500 13,673 98% 22 Caledon 721 $403,048,886 $559,014 $489,900 1,405 97% 33 Mississauga 8,844 $4,047,731,357 $457,681 $410,000 16,544 98% 23 City of Toronto 28,998 $15,721,540,345 $542,159 $427,000 58,116 100% 24 ! TURN PAGE FOR CITY OF TORONTO TABLES OR CLICK HERE: York Region 14,082 $8,371,015,768 $594,448 $536,000 26,747 99% 23 Aurora 795 $450,235,411 $566,334 $500,000 1,317 99% 20 E. Gwillimbury 283 $144,508,909 $510,632 $435,000 490 97% 32 Georgina 746 $236,785,778 $317,407 $295,000 1,214 98% 36 King 256 $218,397,579 $853,116 $721,000 539 95% 50 Markham 3,842 $2,338,113,557 $608,567 $554,000 7,441 99% 21 Newmarket 1,326 $595,311,409 $448,953 $425,000 1,958 99% 19 Richmond Hill 2,750 $1,827,669,595 $664,607 $598,900 5,707 99% 20 Vaughan 3,432 $2,164,341,214 $630,636 $575,000 6,804 98% 22 Whitchurch-Stouffville 652 $395,652,316 $606,829 $522,750 1,277 97% 31 Durham Region 9,432 $3,169,496,215 $336,036 $312,000 14,925 98% 27 Ajax 1,741 $641,808,568 $368,644 $352,000 2,672 99% 21 Brock 175 $46,811,940 $267,497 $234,000 412 96% 80 Clarington 1,517 $444,494,827 $293,009 $274,000 2,297 98% 30 Oshawa 2,287 $591,786,630 $258,761 $245,000 3,501 98% 26 Pickering 1,268 $503,423,625 $397,022 $369,950 2,110 98% 24 Scugog 282 $106,784,998 $378,670 $337,500 526 97% 46 Uxbridge 285 $134,867,511 $473,219 $435,000 531 97% 47 Whitby 1,877 $699,518,116 $372,679 $350,000 2,876 99% 20 Dufferin County 550 $188,977,465 $343,595 $320,000 779 98% 37 Orangeville 550 $188,977,465 $343,595 $320,000 779 98% 37 Simcoe County 1,825 $633,787,757 $347,281 $319,900 3,144 97% 45 Adjala-Tosorontio 126 $52,907,950 $419,904 $388,000 277 97% 74 Bradford West Gwillimbury 479 $197,899,724 $413,152 $389,000 768 98% 28 Essa 254 $75,453,656 $297,062 $260,000 466 98% 56 Innisfil 466 $148,376,879 $318,405 $300,000 869 97% 50 New Tecumseth 500 $159,149,548 $318,299 $292,250 764 97% 45 Page 3 July 2010 Market Watch, October 2012 5
- 6. Toronto Real Estate Board ALL HOME TYPES, YEAR-TO-DATE 2012 SUMMARY OF EXISTING HOME TRANSACTIONS CITY OF TORONTO MUNICIPAL BREAKDOWN 1 1 1 2 4 5 Number of Sales Dollar Volume Average Price Median Price New Listings Avg. SP/LP Avg. DOM TREB Total 76,587 $38,243,756,642 $499,350 $420,000 144,216 99% 24 City of Toronto Total 28,998 $15,721,540,345 $542,159 $427,000 58,116 100% 24 Toronto West 7,498 $3,556,763,278 $474,362 $415,000 14,189 100% 25 Toronto W01 517 $311,059,939 $601,663 $542,000 1,069 102% 19 Toronto W02 757 $460,598,958 $608,453 $565,000 1,212 103% 16 Toronto W03 641 $251,085,145 $391,708 $385,000 985 100% 22 Toronto W04 722 $270,926,779 $375,245 $368,000 1,320 98% 27 Toronto W05 944 $326,139,162 $345,486 $367,750 1,728 98% 31 Toronto W06 1,073 $486,406,032 $453,314 $422,500 2,598 99% 30 Toronto W07 284 $195,172,532 $687,227 $635,500 415 102% 17 Toronto W08 1,359 $836,458,442 $615,496 $519,990 2,569 99% 25 Toronto W09 430 $181,191,441 $421,375 $437,000 817 99% 27 Toronto W10 771 $237,724,848 $308,333 $340,000 1,476 98% 26 Toronto Central 13,033 $8,477,477,435 $650,462 $452,000 28,870 99% 25 Toronto C01 3,423 $1,552,305,578 $453,493 $392,000 8,383 99% 27 Toronto C02 649 $653,065,908 $1,006,265 $801,000 1,458 99% 26 Toronto C03 464 $451,872,352 $973,863 $649,500 824 100% 21 Toronto C04 863 $939,332,722 $1,088,450 $1,001,000 1,662 100% 20 Toronto C06 276 $168,976,571 $612,234 $624,000 556 100% 24 Toronto C07 996 $576,985,365 $579,303 $448,500 2,317 99% 23 Toronto C08 1,338 $587,538,300 $439,117 $388,500 2,931 99% 25 Toronto C09 257 $327,480,059 $1,274,241 $917,500 493 98% 23 Toronto C10 591 $394,184,837 $666,979 $567,000 1,056 102% 19 Toronto C11 378 $247,145,331 $653,824 $380,257 707 100% 23 Toronto C12 356 $634,745,664 $1,782,993 $1,506,500 845 97% 31 Toronto C13 711 $411,267,386 $578,435 $450,000 1,289 101% 22 Toronto C14 1,439 $845,694,552 $587,696 $426,000 3,503 99% 24 Toronto C15 1,292 $686,882,810 $531,643 $420,000 2,846 100% 25 Toronto East 8,467 $3,687,299,632 $435,491 $412,000 15,057 101% 21 Toronto E01 786 $454,252,122 $577,929 $555,278 1,306 104% 14 Toronto E02 679 $456,784,004 $672,730 $600,000 1,134 101% 13 Toronto E03 926 $493,132,187 $532,540 $510,750 1,595 102% 16 Toronto E04 995 $347,305,163 $349,050 $375,000 1,767 100% 23 Toronto E05 877 $357,463,107 $407,598 $360,000 1,507 100% 20 Toronto E06 336 $168,680,757 $502,026 $434,000 645 100% 16 Toronto E07 813 $299,616,846 $368,532 $335,000 1,556 100% 26 Toronto E08 547 $225,315,093 $411,911 $396,000 1,034 98% 25 Toronto E09 1,076 $347,562,761 $323,014 $316,500 1,979 99% 27 Toronto E10 590 $260,748,151 $441,946 $431,250 1,006 100% 21 Toronto E11 842 $276,439,441 $328,313 $318,050 1,528 99% 24 Page 3 July 2010 Market Watch, October 2012 6
- 7. Toronto Real Estate Board DETACHED HOUSES, OCTOBER 2012 Industrial Leasing SUMMARY OF EXISTING HOME TRANSACTIONS ALL TREB AREAS Sales1 Dollar Volume1 Average Price1 Median Price1 New Listings2 Active Listings3 Avg. SP/LP 4 Avg. DOM5 TREB Total 3,348 - $2,112,085,487 - $630,850 - $535,000 - 6,282 - 10,271 - 98% - 27 - Halton Region 268 $198,424,816 $740,391 $594,000 500 992 96% 32 Burlington 34 $21,037,400 $618,747 $560,000 79 173 97% 32 Halton Hills 53 $27,913,000 $526,660 $465,000 89 172 99% 27 Milton 60 $35,862,550 $597,709 $524,500 148 238 96% 29 Oakville 121 - $113,611,866 - $938,941 - $705,000 - 184 - 409 - 96% - 37 - Peel Region 668 $388,612,202 $581,755 $525,000 1,347 2,236 97% 26 Brampton 330 $155,815,753 $472,169 $460,500 708 1,119 97% 25 Caledon 50 $28,592,650 $571,853 $526,250 110 290 98% 36 Mississauga 288 - $204,203,799 - $709,041 - $608,000 - 529 - 827 - 97% - 26 - City of Toronto 931 $725,699,160 $779,484 $624,000 1,785 2,380 99% 19 ! TURN PAGE FOR CITY OF TORONTO TABLES OR CLICK HERE: - - - - - - - - York Region 724 $512,997,360 $708,560 $638,500 1,489 2,603 97% 28 Aurora 29 $18,501,280 $637,975 $570,000 90 143 98% 20 E. Gwillimbury 26 $13,972,628 $537,409 $450,000 39 98 97% 37 Georgina 55 $17,285,687 $314,285 $305,000 97 221 98% 37 King 16 $15,753,000 $984,563 $980,000 52 139 93% 67 Markham 153 $120,846,444 $789,846 $725,000 319 501 97% 26 Newmarket 67 $35,213,750 $525,578 $510,000 110 156 98% 22 Richmond Hill 151 $126,735,315 $839,307 $740,000 298 526 96% 26 Vaughan 171 $129,574,576 $757,746 $650,000 392 638 97% 25 Whitchurch-Stouffville 56 - $35,114,680 - $627,048 - $532,500 - 92 - 181 - 97% - 35 - Durham Region 592 $223,264,033 $377,135 $353,500 862 1,378 98% 29 Ajax 105 $41,865,690 $398,721 $384,500 141 173 98% 22 Brock 16 $4,118,100 $257,381 $196,000 31 121 96% 78 Clarington 81 $26,146,950 $322,802 $305,000 126 217 98% 30 Oshawa 147 $42,496,750 $289,094 $261,000 209 286 98% 27 Pickering 69 $33,634,932 $487,463 $442,000 103 161 98% 24 Scugog 24 $8,237,700 $343,238 $268,000 38 108 96% 49 Uxbridge 30 $14,423,400 $480,780 $413,500 31 91 97% 62 Whitby 120 - $52,340,511 - $436,171 - $397,250 - 183 - 221 - 99% - 20 - Dufferin County 36 $13,588,500 $377,458 $330,500 64 95 98% 28 Orangeville 36 - $13,588,500 - $377,458 - $330,500 - 64 - 95 - 98% - 28 - Simcoe County 129 $49,499,416 $383,716 $349,950 235 587 97% 49 Adjala-Tosorontio 11 $5,550,500 $504,591 $439,000 28 83 96% 98 Bradford West Gwillimbury 32 $14,644,000 $457,625 $422,000 61 131 96% 38 Essa 16 $5,211,400 $325,713 $253,500 19 72 97% 49 Innisfil 42 $13,791,516 $328,369 $302,700 70 185 97% 52 New Tecumseth 28 $10,302,000 $367,929 $303,000 57 116 97% 39 Page 3 July 2010 Market Watch, October 2012 7
- 8. Toronto Real Estate Board DETACHED HOUSES, OCTOBER 2012 Industrial Leasing SUMMARY OF EXISTING HOME TRANSACTIONS CITY OF TORONTO MUNICIPAL BREAKDOWN Sales1 Dollar Volume1 Average Price1 Median Price1 New Listings2 Active Listings3 Avg. SP/LP 4 Avg. DOM5 TREB Total 3,348 $2,112,085,487 $630,850 $535,000 6,282 10,271 98% 27 City of Toronto Total 931 $725,699,160 $779,484 $624,000 1,785 2,380 99% 19 Toronto West 319 $213,849,380 $670,374 $586,000 530 653 99% 20 Toronto W01 23 $22,138,200 $962,530 $880,000 24 24 100% 17 Toronto W02 27 $21,234,900 $786,478 $770,000 51 54 101% 17 Toronto W03 31 $12,642,277 $407,815 $405,000 36 59 99% 18 Toronto W04 47 $24,679,280 $525,091 $475,000 70 93 97% 21 Toronto W05 18 $9,727,692 $540,427 $524,690 32 42 97% 20 Toronto W06 30 $17,310,450 $577,015 $575,500 76 88 99% 21 Toronto W07 25 $17,538,789 $701,552 $625,000 32 29 104% 12 Toronto W08 68 $61,959,342 $911,167 $775,000 110 148 99% 22 Toronto W09 21 $13,498,200 $642,771 $635,000 44 50 99% 20 Toronto W10 29 $13,120,250 $452,422 $436,000 55 66 97% 24 Toronto Central 280 $328,124,383 $1,171,873 $931,500 618 943 98% 19 Toronto C01 4 $3,840,000 $960,000 $982,500 4 12 98% 46 Toronto C02 16 $23,995,671 $1,499,729 $1,550,000 26 33 100% 15 Toronto C03 24 $28,157,136 $1,173,214 $876,009 51 74 99% 15 Toronto C04 53 $67,976,300 $1,282,572 $1,125,000 106 157 98% 16 Toronto C06 14 $10,369,800 $740,700 $688,500 27 53 98% 11 Toronto C07 29 $26,936,800 $928,855 $807,000 91 131 98% 31 Toronto C08 3 $2,905,000 $968,333 $915,000 4 6 96% 11 Toronto C09 10 $16,475,788 $1,647,579 $1,439,950 16 29 98% 14 Toronto C10 21 $22,889,601 $1,089,981 $1,132,000 30 24 102% 13 Toronto C11 13 $16,316,112 $1,255,086 $995,000 24 35 99% 13 Toronto C12 14 $34,950,000 $2,496,429 $2,080,000 52 117 93% 35 Toronto C13 23 $20,381,175 $886,138 $655,000 42 51 100% 17 Toronto C14 29 $31,379,500 $1,082,052 $930,000 84 123 98% 20 Toronto C15 27 $21,551,500 $798,204 $772,000 61 98 96% 21 Toronto East 332 $183,725,397 $553,390 $493,250 637 784 99% 19 Toronto E01 21 $15,132,820 $720,610 $671,000 33 28 102% 19 Toronto E02 19 $15,926,000 $838,211 $759,000 45 56 100% 14 Toronto E03 63 $37,057,228 $588,210 $550,000 94 103 100% 18 Toronto E04 46 $19,657,687 $427,341 $414,500 86 93 98% 18 Toronto E05 23 $13,635,300 $592,839 $594,500 44 47 98% 19 Toronto E06 25 $13,901,964 $556,079 $526,000 54 63 98% 14 Toronto E07 25 $13,642,164 $545,687 $545,000 56 78 98% 18 Toronto E08 31 $18,340,233 $591,620 $494,000 60 74 98% 18 Toronto E09 31 $12,550,743 $404,863 $410,000 62 93 98% 25 Toronto E10 35 $17,813,758 $508,965 $485,000 71 96 98% 28 Toronto E11 13 $6,067,500 $466,731 $486,000 32 53 98% 18 Page 3 July 2010 Market Watch, October 2012 8
- 9. Toronto Real Estate Board SEMI-DETACHED HOUSES, OCTOBER 2012 Industrial Leasing SUMMARY OF EXISTING HOME TRANSACTIONS ALL TREB AREAS Sales1 Dollar Volume1 Average Price1 Median Price1 New Listings2 Active Listings3 Avg. SP/LP 4 Avg. DOM5 TREB Total 805 - $378,569,754 - $470,273 - $430,000 - 1,241 - 1,374 - 99% - 21 - Halton Region 27 $11,021,700 $408,211 $406,500 50 62 98% 28 Burlington 4 $1,667,000 $416,750 $415,750 1 3 100% 30 Halton Hills - - - - 6 7 - - Milton 17 $6,663,400 $391,965 $397,500 35 34 98% 28 Oakville 6- $2,691,300 - $448,550 - $437,500 - 8- 18 - 98% - 26 - Peel Region 254 $100,013,646 $393,755 $394,000 397 501 98% 23 Brampton 129 $46,858,750 $363,246 $363,000 204 288 98% 27 Caledon 6 $2,299,000 $383,167 $379,000 11 10 98% 18 Mississauga 119 - $50,855,896 - $427,360 - $419,000 - 182 - 203 - 97% - 20 - City of Toronto 347 $199,739,358 $575,618 $525,000 521 496 101% 18 ! TURN PAGE FOR CITY OF TORONTO TABLES OR CLICK HERE: - - - - - - - - York Region 102 $48,370,100 $474,217 $478,500 190 222 98% 23 Aurora 7 $2,765,300 $395,043 $390,000 12 11 98% 17 E. Gwillimbury - - - - - - - - Georgina 2 $595,000 $297,500 $297,500 - 1 99% 7 King 1 $530,000 $530,000 $530,000 - 1 99% 46 Markham 24 $11,667,300 $486,138 $481,500 53 55 99% 20 Newmarket 14 $5,345,500 $381,821 $410,000 24 33 98% 23 Richmond Hill 12 $6,219,000 $518,250 $537,500 29 36 98% 28 Vaughan 39 $19,994,000 $512,667 $508,000 62 68 97% 25 Whitchurch-Stouffville 3- $1,254,000 - $418,000 - $417,000 - 10 - 17 - 98% - 14 - Durham Region 64 $16,344,800 $255,388 $232,250 68 66 99% 24 Ajax 13 $4,523,300 $347,946 $345,500 16 9 101% 10 Brock - - - - - - - - Clarington 9 $1,837,800 $204,200 $216,000 5 3 98% 43 Oshawa 27 $5,299,500 $196,278 $205,000 30 35 98% 27 Pickering 11 $3,550,900 $322,809 $315,000 14 14 99% 12 Scugog - - - - 1 1 - - Uxbridge 2 $599,000 $299,500 $299,500 - - 98% 43 Whitby 2- $534,300 - $267,150 - $267,150 - 2- 4- 99% - 28 - Dufferin County 6 $1,442,650 $240,442 $239,625 11 11 98% 28 Orangeville 6 - $1,442,650 - $240,442 - $239,625 - 11 - 11 - 98% - 28 - Simcoe County 5 $1,637,500 $327,500 $375,000 4 16 98% 25 Adjala-Tosorontio - - - - - 1 - - Bradford West Gwillimbury 3 $1,162,500 $387,500 $377,500 2 8 99% 25 Essa - - - - 1 1 - - Innisfil - - - - - - - - New Tecumseth 2 $475,000 $237,500 $237,500 1 6 97% 25 Page 3 July 2010 Market Watch, October 2012 9
- 10. Toronto Real Estate Board SEMI-DETACHED HOUSES, OCTOBER 2012 Industrial Leasing SUMMARY OF EXISTING HOME TRANSACTIONS CITY OF TORONTO MUNICIPAL BREAKDOWN Sales1 Dollar Volume1 Average Price1 Median Price1 New Listings2 Active Listings3 Avg. SP/LP 4 Avg. DOM5 TREB Total 805 $378,569,754 $470,273 $430,000 1,241 1,374 99% 21 City of Toronto Total 347 $199,739,358 $575,618 $525,000 521 496 101% 18 Toronto West 97 $45,450,739 $468,564 $435,000 136 158 100% 22 Toronto W01 7 $4,784,400 $683,486 $660,400 5 9 105% 13 Toronto W02 19 $10,561,300 $555,858 $510,000 32 30 101% 15 Toronto W03 22 $9,151,740 $415,988 $427,250 34 32 100% 20 Toronto W04 5 $2,094,900 $418,980 $416,000 10 15 99% 20 Toronto W05 28 $11,153,899 $398,354 $390,750 40 56 97% 28 Toronto W06 8 $4,096,500 $512,063 $504,400 8 10 100% 25 Toronto W07 - - - - - - - - Toronto W08 3 $1,576,000 $525,333 $508,000 3 2 100% 35 Toronto W09 2 $745,000 $372,500 $372,500 2 2 111% 7 Toronto W10 3 $1,287,000 $429,000 $387,000 2 2 97% 26 Toronto Central 106 $80,201,162 $756,615 $716,500 192 180 101% 19 Toronto C01 21 $17,904,227 $852,582 $832,000 40 40 102% 18 Toronto C02 18 $18,170,500 $1,009,472 $829,750 34 39 101% 20 Toronto C03 14 $8,011,000 $572,214 $456,000 27 15 100% 12 Toronto C04 9 $6,902,529 $766,948 $765,900 13 6 106% 6 Toronto C06 - - - - - 2 - - Toronto C07 3 $1,639,500 $546,500 $535,000 9 6 97% 26 Toronto C08 6 $4,950,888 $825,148 $810,000 12 15 98% 25 Toronto C09 3 $2,569,900 $856,633 $820,000 2 2 99% 11 Toronto C10 14 $10,583,780 $755,984 $723,500 14 7 100% 27 Toronto C11 2 $1,460,000 $730,000 $730,000 4 4 107% 5 Toronto C12 - - - - 1 1 - - Toronto C13 4 $1,811,000 $452,750 $450,500 9 8 98% 8 Toronto C14 - - - - - - - - Toronto C15 12 $6,197,838 $516,487 $507,500 27 35 98% 27 Toronto East 144 $74,087,457 $514,496 $515,500 193 158 101% 14 Toronto E01 42 $24,288,326 $578,293 $587,063 54 43 102% 11 Toronto E02 41 $22,818,222 $556,542 $530,000 40 22 101% 9 Toronto E03 22 $11,953,709 $543,350 $543,250 32 27 101% 14 Toronto E04 10 $3,928,500 $392,850 $388,250 12 9 98% 16 Toronto E05 5 $2,151,900 $430,380 $431,000 13 14 98% 24 Toronto E06 1 $305,000 $305,000 $305,000 5 6 96% 24 Toronto E07 7 $3,014,000 $430,571 $426,000 14 12 99% 18 Toronto E08 - - - - - - - - Toronto E09 7 $2,636,300 $376,614 $379,000 7 2 98% 23 Toronto E10 1 $356,000 $356,000 $356,000 6 11 99% 11 Toronto E11 8 $2,635,500 $329,438 $315,000 10 12 97% 30 Page 3 July 2010 Market Watch, October 2012 10
- 11. Toronto Real Estate Board CONDOMINIUM TOWNHOUSES, OCTOBER 2012 Industrial Leasing SUMMARY OF EXISTING HOME TRANSACTIONS ALL TREB AREAS Sales1 Dollar Volume1 Average Price1 Median Price1 New Listings2 Active Listings3 Avg. SP/LP 4 Avg. DOM5 TREB Total 540 - $185,832,807 - $344,135 - $325,500 - 775 - 1,104 - 98% - 28 - Halton Region 39 $12,356,800 $316,841 $315,000 36 56 98% 31 Burlington 14 $4,279,500 $305,679 $279,500 12 16 97% 35 Halton Hills 9 $2,518,000 $279,778 $243,000 2 5 98% 29 Milton 1 $274,000 $274,000 $274,000 2 3 100% 10 Oakville 15 - $5,285,300 - $352,353 - $348,000 - 20 - 32 - 98% - 31 - Peel Region 195 $63,915,123 $327,770 $326,000 242 366 98% 29 Brampton 37 $9,385,190 $253,654 $238,500 64 91 98% 27 Caledon - - - - 2 2 - - Mississauga 158 - $54,529,933 - $345,126 - $342,000 - 176 - 273 - 98% - 29 - City of Toronto 181 $71,258,346 $393,693 $350,000 326 465 98% 26 ! TURN PAGE FOR CITY OF TORONTO TABLES OR CLICK HERE: - - - - - - - - York Region 65 $25,369,588 $390,301 $366,000 92 126 97% 31 Aurora 4 $2,154,900 $538,725 $505,000 10 16 96% 26 E. Gwillimbury - - - - - - - - Georgina - - - - - - - - King - - - - - - - - Markham 29 $11,755,488 $405,362 $391,000 38 63 97% 35 Newmarket 9 $2,686,900 $298,544 $286,000 8 6 98% 27 Richmond Hill 15 $5,831,300 $388,753 $370,000 20 23 98% 20 Vaughan 6 $2,446,000 $407,667 $404,250 14 17 95% 37 Whitchurch-Stouffville 2- $495,000 - $247,500 - $247,500 - 2- 1- 98% - 58 - Durham Region 54 $11,696,550 $216,603 $226,500 72 82 98% 27 Ajax 10 $2,432,700 $243,270 $258,500 13 13 98% 25 Brock 1 $195,000 $195,000 $195,000 2 4 98% 47 Clarington 1 $146,000 $146,000 $146,000 4 5 94% 90 Oshawa 17 $2,310,150 $135,891 $133,500 22 24 98% 25 Pickering 14 $3,894,900 $278,207 $271,750 21 25 98% 22 Scugog - - - - - - - - Uxbridge 1 $396,000 $396,000 $396,000 3 6 99% 15 Whitby 10 - $2,321,800 - $232,180 - $233,950 - 7- 5- 99% - 32 - Dufferin County 4 $804,500 $201,125 $202,500 6 6 98% 21 Orangeville 4 - $804,500 - $201,125 - $202,500 - 6 - 6 - 98% - 21 - Simcoe County 2 $431,900 $215,950 $215,950 1 3 99% 25 Adjala-Tosorontio - - - - - - - - Bradford West Gwillimbury 1 $217,000 $217,000 $217,000 1 - 99% 12 Essa - - - - - - - - Innisfil - - - - - - - - New Tecumseth 1 $214,900 $214,900 $214,900 - 3 100% 37 Page 3 July 2010 Market Watch, October 2012 11
- 12. Toronto Real Estate Board CONDOMINIUM TOWNHOUSES, OCTOBER 2012 Industrial Leasing SUMMARY OF EXISTING HOME TRANSACTIONS CITY OF TORONTO MUNICIPAL BREAKDOWN Sales1 Dollar Volume1 Average Price1 Median Price1 New Listings2 Active Listings3 Avg. SP/LP 4 Avg. DOM5 TREB Total 540 $185,832,807 $344,135 $325,500 775 1,104 98% 28 City of Toronto Total 181 $71,258,346 $393,693 $350,000 326 465 98% 26 Toronto West 56 $18,729,702 $334,459 $327,000 84 120 99% 22 Toronto W01 10 $3,979,600 $397,960 $353,750 8 7 100% 24 Toronto W02 7 $2,652,000 $378,857 $355,000 3 1 99% 25 Toronto W03 1 $323,000 $323,000 $323,000 - 3 98% 35 Toronto W04 6 $1,857,500 $309,583 $315,500 14 18 98% 19 Toronto W05 10 $2,740,500 $274,050 $275,000 27 45 96% 28 Toronto W06 4 $2,097,000 $524,250 $553,500 8 13 98% 17 Toronto W07 - - - - - - - - Toronto W08 8 $2,671,214 $333,902 $330,500 10 12 99% 23 Toronto W09 3 $1,102,888 $367,629 $392,000 4 6 101% 9 Toronto W10 7 $1,306,000 $186,571 $219,000 10 15 98% 15 Toronto Central 68 $35,725,456 $525,374 $433,500 136 187 98% 26 Toronto C01 23 $11,172,244 $485,750 $449,000 35 43 98% 21 Toronto C02 4 $2,956,500 $739,125 $733,750 3 9 100% 15 Toronto C03 - - - - 6 7 - - Toronto C04 - - - - 2 3 - - Toronto C06 - - - - 2 2 - - Toronto C07 6 $2,823,999 $470,667 $394,750 10 18 97% 49 Toronto C08 7 $2,707,500 $386,786 $372,500 12 11 99% 17 Toronto C09 1 $1,425,000 $1,425,000 $1,425,000 3 2 100% 8 Toronto C10 1 $358,000 $358,000 $358,000 6 10 97% 17 Toronto C11 1 $414,000 $414,000 $414,000 2 8 101% 30 Toronto C12 2 $2,249,500 $1,124,750 $1,124,750 7 9 97% 42 Toronto C13 3 $1,378,513 $459,504 $525,513 7 9 96% 51 Toronto C14 13 $7,540,600 $580,046 $600,800 17 19 98% 22 Toronto C15 7 $2,699,600 $385,657 $319,800 24 37 98% 34 Toronto East 57 $16,803,188 $294,793 $292,000 106 158 98% 29 Toronto E01 2 $712,900 $356,450 $356,450 9 12 99% 27 Toronto E02 4 $1,880,000 $470,000 $457,500 7 6 100% 5 Toronto E03 - - - - 1 2 - - Toronto E04 5 $1,634,500 $326,900 $300,000 13 23 98% 27 Toronto E05 14 $4,429,088 $316,363 $304,000 20 26 99% 28 Toronto E06 - - - - - - - - Toronto E07 6 $1,916,900 $319,483 $313,500 6 12 96% 24 Toronto E08 3 $790,000 $263,333 $260,000 9 18 95% 24 Toronto E09 7 $1,455,900 $207,986 $226,000 13 17 97% 34 Toronto E10 5 $894,000 $178,800 $155,000 9 14 97% 46 Toronto E11 11 $3,089,900 $280,900 $291,000 19 28 97% 32 Page 3 July 2010 Market Watch, October 2012 12