SlideShare ist ein Scribd-Unternehmen logo
1 von 25
Downloaden Sie, um offline zu lesen
For All Media/Public Inquiries:                   For All TREB Member Inquiries:
(416) 443-8158                                    (416) 443-8152                                            Third Quarter 2012
Economic Indicators Almost 3.5 Million Square Feet Leased in Q3 2012                                                                                 TorontoMLS
Real GDP Growth
                      1
                                                TORONTO, October 3, 2012 — Toronto Real Estate Board (TREB)                                     All Leasing Activity*
       Q2 2012 t                  1.8%          Commercial Division Members reported lease transactions accounting for                                         (Sq. Ft.)
                                                almost 3.5 million square feet of industrial, commercial/retail and office
Toronto Employment Growth2                      space during the Third Quarter of 2012. This result was down from slightly
    August 2012 t     1.6%                      more than 3.7 million square feet leased in the Third Quarter of 2011.


                                                                                                                                                                                   3,728,892
Toronto Unemployment Rate                       The year-over-year change in average lease rates was mixed. Based on


                                                                                                                                                  3,481,452
    August 2012 u      8.5%                     transactions for which pricing was disclosed, the average industrial lease
                                                rate was up compared to last year whereas average commercial/retail and
Inflation (Yr./Yr. CPI Growth)2                 office lease rates were down.
     August 2012 u         1.2%                 “The industrial market segment accounted for almost three-quarters of total
Bank of Canada Overnight Rate               3   leased space in the Third Quarter. Average lease rates were up for all
                                                industrial size categories reported by TREB. If growth in average industrial
September 2012 q        1.0%                                                                                                          Third Quarter 2012               Third Quarter 2011
                                                lease rates continues in the Fourth Quarter and into 2013, it would suggest
                                                                                                                                 * NOTE: This chart summarizes total industrial,
Prime Rate
              4                                 that market conditions are tightening with industrial firms in southern          commercial/retail and office square feet leased through
                                                                                                                                 TorontoMLS regardless of pricing terms.
                                                Ontario more confident about future growth,” said TREB Commercial
September 2012            q       3.0%
                                                Division Chair Cynthia Lai.
GoC Yield Curve (Sept. 2012)4                   Commercial Division Members reported 214 combined commercial sales in
  3 Month T-Bill t 0.99%                        the Third Quarter – down 18 per cent from 262 sales during the same period                       Total TorontoMLS
  6 Month T-Bill u 1.02%                        in 2011. The average selling price was down for all three categories, but a
                                                comparison of transactions suggests that the decline was more the result of                      All Sales Activity*
          1 Year u 1.09%
                                                a different mix of property types sold this year compared to last, especially
          2 Year u 1.09%
                                                in relation to commercial/retail and office space.
          3 Year u 1.16%
          5 Year u 1.31%                        “The mix of sold office space shifted towards larger properties in the Third
          7 Year u 1.47%                        Quarter of this year. Generally speaking, larger office properties are
         10 Year u 1.75%                        associated with a lower price per square foot. As a result, when larger
                                                properties account for a greater proportion of total transactions the overall                                                      262
Sources and Notes:
1
                                                average lease rate tends to dip, all else being equal,” said Lai.                                214
 Statistics Canada, Quarter-over-quarter
growth, annualized.                             “The dip in the in the average commercial/retail sale price was also driven
2
 Statistics Canada, Year-over-year growth       by sales of larger properties. Last year the mix and use of larger
for the most recently reported month
                                                commercial/retail properties sold dictated a higher price compared to this
3
 Bank of Canada, Rate from most recent          year. For transactions in smaller size categories, average selling prices were        Third Quarter 2012               Third Quarter 2011
Bank of Canada announcement
4
                                                more comparable between 2012 and 2011,” continued Lai.                           * NOTE: This chart summarizes total industrial and
 Bank of Canada, Rates for most recently                                                                                         commercial/retail sales through TorontoMLS regardless of
completed month                                                                                                                  pricing terms.
TREB Commercial Division


Total TorontoMLS Leasing Activity*                                                                  TorontoMLS Average Lease Rates ($/Sq.Ft. Net)*
(Millions of Square Feet Leased)                                                                                                 Third Quarter 2012                     Third Quarter 2011
                                                                                                    $25.00
                          4.0            3.73                                                                                                                 $20.37
                                  3.48
                                                                                                    $20.00
Millions of Square Feet


                          3.0                           2.76
                                                 2.56                     Third Quarter 2012                                                        $14.36
                                                                                                    $15.00
                                                                          Third Quarter 2011                                                                                       $10.79 $10.95
                          2.0
                                                                                                    $10.00
                                                                                                                     $5.05     $4.74
                          1.0                                      0.45 0.49           0.47 0.48     $5.00

                          0.0                                                                        $0.00
                                      Total      Industrial    Commercial/Retail        Office                          Industrial                Commercial/Retail                       Office
 * NOTE: This chart summarizes total industrial, commercial/retail and office square                * NOTE: Average lease rates are reported only for those properties sold on a per
 feet leased through TorontoMLS regardless of pricing terms.                                        square foot net basis and for which the selling price was disclosed.
 Source: TREB, Commercial Division                                                                  Source: TREB, Commercial Division


Total TorontoMLS Sales Activity*                                                                    TorontoMLS Average Sale Price ($/Sq. Ft.)*
(Number of Sales)
                                                                                                    $250.00                                                                                      $229.64
300                                   262                                 Third Quarter 2012                                    Third Quarter 2012
                                                                                                                                                                $189.70
                                                                                                    $200.00
250                             214                                       Third Quarter 2011                                    Third Quarter 2011
                                                                                                                                                                                       $146.05
200                                                                                                 $150.00
                                                                                                                                                     $116.11
150                                                     124
                                                101                      94
                                                                                                    $100.00           $70.18 $78.29
100                                                                74
                                                                                        39     44    $50.00
      50
                 0                                                                                    $0.00
                                 Total          Industrial     Commercial/Retail         Office                          Industrial                Commercial/Retail                       Office
 * NOTE: This chart summarizes total industrial and commercial/retail sales through                 * NOTE: Average sale prices are reported only for those properties for which the
 TorontoMLS regardless of pricing terms.                                                            selling price was disclosed.
 Source: TREB, Commercial Division                                                                  Source: TREB, Commercial Division


                                                                                                                Commercial Realty Watch, Third Quarter 2012                                                2
TREB Commercial Division
   SUMMARY OF INDUSTRIAL LEASING
                                                                                                                                                                                              ALL TREB AREAS
   TRANSACTIONS COMPLETED ON A PER SQUARE FOOT NET BASIS, WITH PRICING DISCLOSED*
                                              All Transactions               0 to 5,000 Square Feet           5,001 to 15,000 Square Feet        15,001 to 50,000 Square Feet             50,001 + Square Feet
                                   # Trans.         Sq. Ft.  $/SF Net   # Trans.     Sq. Ft.    $/SF Net    # Trans.     Sq. Ft.  $/SF Net      # Trans.    Sq. Ft.   $/SF Net       # Trans.    Sq. Ft.   $/SF Net
   TREB Total                        173        1,339,922     $5.05       118      287,275      $6.16          35       283,240      $5.51         13       379,716      $4.56          7        389,691      $4.36
   Halton Region                      8           35,236      $5.57        6        15,183      $7.31          2        20,053       $4.26          0           -          -            0           -              -
    Burlington                        2            7,461      $7.34        2         7,461      $7.34          0           -           -            0           -          -            0           -              -
    Halton Hills                      0              -          -          0           -          -            0           -           -            0           -          -            0           -              -
    Milton                            0              -          -          0           -          -            0           -           -            0           -          -            0           -              -
    Oakville                          6           27,775      $5.10        4         7,722      $7.28          2        20,053       $4.26          0           -          -            0           -              -
   Peel Region                        73         499,298      $5.15       52       135,755      $5.71          13       117,505      $5.56          6       137,698      $4.94          2        108,340      $4.27
    Brampton                          13         120,621      $4.94       10        19,035      $6.25          0            -          -            2        48,465      $4.86          1         53,121      $4.55
    Caledon                           2           14,561      $5.01       1          1,680      $5.50          1         12,881      $4.95          0           -          -            0            -          -
    Mississauga                       58         364,116      $5.22       41       115,040      $5.62          12       104,624      $5.63          4        89,233      $4.99          1         55,219      $4.00
   City of Toronto                    45         393,123      $4.28       32        76,636      $5.53          7        50,828       $4.68          3        84,923      $4.42          3        180,736      $3.58
     West                             25         237,349      $4.35       16        40,191      $5.92          5        35,479       $4.88          2        56,829      $4.25          2        104,850      $3.63
     Central                          4           38,281      $4.92       3         10,187      $5.37          0           -           -            1        28,094      $4.75          0            -          -
     East                             16         117,493      $3.93       13        26,258      $4.99          2        15,349       $4.22          0           -          -            1         75,886      $3.50
   York Region                        45         406,865      $5.62       26        54,301      $7.99          13       94,854       $6.17          4       157,095      $4.31          2        100,615      $5.87
    Aurora                            2           2,960       $6.12       2          2,960      $6.12          0           -           -            0           -          -            0            -          -
    E. Gwillimbury                    0             -           -         0            -          -            0           -           -            0           -          -            0            -          -
    Georgina                          0             -           -         0            -          -            0           -           -            0           -          -            0            -          -
    King                              0             -           -         0            -          -            0           -           -            0           -          -            0            -          -
    Markham                           15         149,484      $5.61       8         14,980      $9.28          5        34,489       $6.86          1        50,000      $3.00          1         50,015      $6.25
    Newmarket                         0             -           -         0            -          -            0           -           -            0           -          -            0            -          -
    Richmond Hill                     1           3,095       $7.70       1          3,095      $7.70          0           -           -            0           -          -            0            -          -
    Vaughan                           26         249,626      $5.58       14        31,566      $7.56          8        60,365       $5.77          3       107,095      $4.92          1         50,600      $5.50
    Whitchurch-Stouffville            1           1,700       $8.25       1          1,700      $8.25          0           -           -            0           -          -            0            -          -
   Durham Region                      0              -          -          0           -           -           0           -           -            0           -          -            0           -              -
    Ajax                              0              -          -          0           -           -           0           -           -            0           -          -            0           -              -
    Brock                             0              -          -          0           -           -           0           -           -            0           -          -            0           -              -
    Clarington                        0              -          -          0           -           -           0           -           -            0           -          -            0           -              -
    Oshawa                            0              -          -          0           -           -           0           -           -            0           -          -            0           -              -
    Pickering                         0              -          -          0           -           -           0           -           -            0           -          -            0           -              -
    Scugog                            0              -          -          0           -           -           0           -           -            0           -          -            0           -              -
    Uxbridge                          0              -          -          0           -           -           0           -           -            0           -          -            0           -              -
    Whitby                            0              -          -          0           -           -           0           -           -            0           -          -            0           -              -
   Dufferin County                    2           5,400       $4.93        2         5,400      $4.93          0           -           -            0           -          -            0           -              -
    Orangeville                       2           5,400       $4.93        2         5,400      $4.93          0           -           -            0           -          -            0           -              -
   Simcoe County                      0              -          -          0           -           -           0           -           -            0           -          -            0           -              -
     Adjala-Tosorontio                0              -          -          0           -           -           0           -           -            0           -          -            0           -              -
     Bradford West Gwillimbury        0              -          -          0           -           -           0           -           -            0           -          -            0           -              -
     Essa                             0              -          -          0           -           -           0           -           -            0           -          -            0           -              -
     Innisfil                         0              -          -          0           -           -           0           -           -            0           -          -            0           -              -
     New Tecumseth                    0              -          -          0           -           -           0           -           -            0           -          -            0           -              -
   *
    NOTE: Figures in this table cover transactions completed on a per square foot net basis and for which pricing was disclosed during the reporting period. This differs from the chart summarizing square feet
   leased on Page 2 of this report, which covers all leasing transactions in the TREB service area.
                                                                                                                          Commercial Realty Watch, Third Quarter 2012                                                  3
TREB Commercial Division
   SUMMARY OF INDUSTRIAL LEASING
                                                                                                                                                                                            CITY OF TORONTO
   TRANSACTIONS COMPLETED ON A PER SQUARE FOOT NET BASIS, WITH PRICING DISCLOSED
                                              All Transactions               0 to 5,000 Square Feet           5,001 to 15,000 Square Feet        15,001 to 50,000 Square Feet             50,001 + Square Feet
                                   # Trans.         Sq. Ft.  $/SF Net   # Trans.     Sq. Ft.    $/SF Net    # Trans.     Sq. Ft.  $/SF Net      # Trans.    Sq. Ft.   $/SF Net       # Trans.    Sq. Ft.   $/SF Net
   TREB Total                        173        1,339,922     $5.05       118      287,275      $6.16          35       283,240      $5.51         13       379,716      $4.56          7        389,691      $4.36
   City of Toronto                    45         393,123      $4.28       32        76,636      $5.53          7        50,828       $4.68          3        84,923      $4.42          3        180,736      $3.58
   Toronto West                       25         237,349      $4.35       16        40,191      $5.92          5        35,479       $4.88          2        56,829      $4.25          2        104,850      $3.63
    Toronto W01                       0             -           -         0            -          -            0           -           -            0           -          -            0            -          -
    Toronto W02                       0             -           -         0            -          -            0           -           -            0           -          -            0            -          -
    Toronto W03                       0             -           -         0            -          -            0           -           -            0           -          -            0            -          -
    Toronto W04                       1           5,375       $8.00       0            -          -            1         5,375       $8.00          0           -          -            0            -          -
    Toronto W05                       12         111,616      $4.34       8         19,231      $5.66          2        19,182       $4.25          1        22,553      $3.50          1         50,650      $4.25
    Toronto W06                       0             -           -         0            -          -            0           -           -            0           -          -            0            -          -
    Toronto W07                       0             -           -         0            -          -            0           -           -            0           -          -            0            -          -
    Toronto W08                       2           8,703       $4.33       1          2,901      $4.50          1         5,802       $4.25          0           -          -            0            -          -
    Toronto W09                       0             -           -         0            -          -            0           -           -            0           -          -            0            -          -
    Toronto W10                       10         111,655      $4.19       7         18,059      $6.42          1         5,120       $4.70          1        34,276      $4.75          1         54,200      $3.05
   Toronto Central                    4           38,281      $4.92        3        10,187      $5.37          0           -           -            1        28,094      $4.75          0           -              -
    Toronto C01                       0              -          -          0           -          -            0           -           -            0           -          -            0           -              -
    Toronto C02                       0              -          -          0           -          -            0           -           -            0           -          -            0           -              -
    Toronto C03                       0              -          -          0           -          -            0           -           -            0           -          -            0           -              -
    Toronto C04                       0              -          -          0           -          -            0           -           -            0           -          -            0           -              -
    Toronto C06                       0              -          -          0           -          -            0           -           -            0           -          -            0           -              -
    Toronto C07                       0              -          -          0           -          -            0           -           -            0           -          -            0           -              -
    Toronto C08                       0              -          -          0           -          -            0           -           -            0           -          -            0           -              -
    Toronto C09                       0              -          -          0           -          -            0           -           -            0           -          -            0           -              -
    Toronto C10                       0              -          -          0           -          -            0           -           -            0           -          -            0           -              -
    Toronto C11                       1           28,094      $4.75        0           -          -            0           -           -            1        28,094      $4.75          0           -              -
    Toronto C12                       0              -          -          0           -          -            0           -           -            0           -          -            0           -              -
    Toronto C13                       2            7,780      $5.41        2         7,780      $5.41          0           -           -            0           -          -            0           -              -
    Toronto C14                       0              -          -          0           -          -            0           -           -            0           -          -            0           -              -
    Toronto C15                       1            2,407      $5.25        1         2,407      $5.25          0           -           -            0           -          -            0           -              -
   Toronto East                       16         117,493      $3.93       13        26,258      $4.99          2        15,349       $4.22          0           -          -            1        75,886       $3.50
    Toronto E01                       0              -          -         0            -          -            0           -           -            0           -          -            0           -           -
    Toronto E02                       0              -          -         0            -          -            0           -           -            0           -          -            0           -           -
    Toronto E03                       0              -          -         0            -          -            0           -           -            0           -          -            0           -           -
    Toronto E04                       3            7,540      $4.75       3          7,540      $4.75          0           -           -            0           -          -            0           -           -
    Toronto E05                       0              -          -         0            -          -            0           -           -            0           -          -            0           -           -
    Toronto E06                       0              -          -         0            -          -            0           -           -            0           -          -            0           -           -
    Toronto E07                       6           96,378      $3.71       3          5,143      $5.35          2        15,349       $4.22          0           -          -            1        75,886       $3.50
    Toronto E08                       0              -          -         0            -          -            0           -           -            0           -          -            0           -           -
    Toronto E09                       3            7,541      $4.60       3          7,541      $4.60          0           -           -            0           -          -            0           -           -
    Toronto E10                       0              -          -         0            -          -            0           -           -            0           -          -            0           -           -
    Toronto E11                       4            6,034      $5.47       4          6,034      $5.47          0           -           -            0           -          -            0           -           -
   *
    NOTE: Figures in this table cover transactions completed on a per square foot net basis and for which pricing was disclosed during the reporting period. This differs from the chart summarizing square feet
   leased on Page 2 of this report, which covers all leasing transactions in the TREB service area.


                                                                                                                          Commercial Realty Watch, Third Quarter 2012                                                  4
TREB Commercial Division
   SUMMARY OF COMMERCIAL/RETAIL LEASING
                                                                                                                                                                                              ALL TREB AREAS
   TRANSACTIONS COMPLETED ON A PER SQUARE FOOT NET BASIS, WITH PRICING DISCLOSED
                                              All Transactions               0 to 1,000 Square Feet           1,001 TO 2,500 Square Feet          2,501 TO 5,000 Square Feet               5,001+ Square Feet
                                   # Trans.         Sq. Ft.  $/SF Net   # Trans.     Sq. Ft.    $/SF Net    # Trans.    Sq. Ft.   $/SF Net      # Trans.    Sq. Ft.   $/SF Net       # Trans.    Sq. Ft.   $/SF Net
   TREB Total                        108         235,105     $14.36       37        28,709      $25.13         55       86,738      $17.01         11        41,651      $14.34         5        78,007       $7.69
   Halton Region                      8           6,678      $22.53        7         5,607      $22.55         1         1,071      $22.41          0           -          -            0           -              -
    Burlington                        0             -          -           0           -          -            0           -          -             0           -          -            0           -              -
    Halton Hills                      3           2,651      $16.75        2         1,580      $12.91         1         1,071      $22.41          0           -          -            0           -              -
    Milton                            0             -          -           0           -          -            0           -          -             0           -          -            0           -              -
    Oakville                          5           4,027      $26.33        5         4,027      $26.33         0           -          -             0           -          -            0           -              -
   Peel Region                        13          22,392     $17.35        4         3,162      $24.48         7        11,451      $13.77          2        7,779       $19.72         0           -              -
    Brampton                          9           16,216     $18.76        2         1,472      $27.46         5         6,965      $15.84          2        7,779       $19.72         0           -              -
    Caledon                           0              -         -           0           -          -            0           -          -             0          -           -            0           -              -
    Mississauga                       4            6,176     $13.66        2         1,690      $21.89         2         4,486      $10.56          0          -           -            0           -              -
   City of Toronto                    47         120,096     $15.14       15        12,325      $29.01         23       34,885      $20.47          6        23,718      $16.06         3        49,168      $7.44
     West                             12          48,704     $8.60        5          4,488      $25.76         6         9,590      $16.27          0           -          -            1        34,626      $4.25
     Central                          19          34,304     $25.86       5          3,717      $41.62         11       16,165      $23.29          2         8,458      $25.86         1         5,964      $23.00
     East                             16          37,088     $13.82       5          4,120      $21.18         6         9,130      $19.90          4        15,260      $10.62         1         8,578      $9.50
   York Region                        27          63,280     $11.74        7         4,846      $23.57         17       27,066      $13.97          1        2,529       $6.50          2        28,839       $8.12
    Aurora                            1            1,497     $22.00        0           -          -            1         1,497      $22.00          0          -           -            0           -           -
    E. Gwillimbury                    0              -         -           0           -          -            0           -          -             0          -           -            0           -           -
    Georgina                          2            2,422     $13.13        0           -          -            2         2,422      $13.13          0          -           -            0           -           -
    King                              0              -         -           0           -          -            0           -          -             0          -           -            0           -           -
    Markham                           9           13,088     $14.23        4         2,670      $28.67         4         7,889      $11.83          1        2,529       $6.50          0           -           -
    Newmarket                         0              -         -           0           -          -            0           -          -             0          -           -            0           -           -
    Richmond Hill                     1             568      $22.00        1          568       $22.00         0           -          -             0          -           -            0           -           -
    Vaughan                           13          45,055     $10.48        1          958       $18.79         10       15,258      $14.43          0          -           -            2        28,839       $8.12
    Whitchurch-Stouffville            1             650      $11.08        1          650       $11.08         0           -          -             0          -           -            0           -           -
   Durham Region                      10          19,793     $12.67        3         2,165      $16.76         5        10,003      $16.77          2        7,625       $6.13          0           -              -
    Ajax                              2            3,315     $8.66         1          955       $14.00         1         2,360      $6.50           0          -           -            0           -              -
    Brock                             0              -         -           0           -          -            0           -          -             0          -           -            0           -              -
    Clarington                        1            2,370     $11.00        0           -          -            1         2,370      $11.00          0          -           -            0           -              -
    Oshawa                            1            1,773     $21.32        0           -          -            1         1,773      $21.32          0          -           -            0           -              -
    Pickering                         0              -         -           0           -          -            0           -          -             0          -           -            0           -              -
    Scugog                            2            4,035     $9.04         1          810       $17.19         0           -          -             1        3,225       $7.00          0           -              -
    Uxbridge                          0              -         -           0           -          -            0           -          -             0          -           -            0           -              -
    Whitby                            4            8,300     $14.66        1          400       $22.50         2         3,500      $25.29          1        4,400       $5.50          0           -              -
   Dufferin County                    1           1,200       $0.00        0           -           -           1         1,200      $16.00          0           -          -            0           -              -
    Orangeville                       1           1,200       $0.00        0           -           -           1         1,200      $16.00          0           -          -            0           -              -
   Simcoe County                      2           1,666      $14.41        1         604        $15.89         1         1,062      $13.56          0           -          -            0           -              -
     Adjala-Tosorontio                0             -          -           0          -           -            0           -          -             0           -          -            0           -              -
     Bradford West Gwillimbury        0             -          -           0          -           -            0           -          -             0           -          -            0           -              -
     Essa                             0             -          -           0          -           -            0           -          -             0           -          -            0           -              -
     Innisfil                         0             -          -           0          -           -            0           -          -             0           -          -            0           -              -
     New Tecumseth                    2           1,666      $14.41        1         604        $15.89         1         1,062      $13.56          0           -          -            0           -              -
   *
    NOTE: Figures in this table cover transactions completed on a per square foot net basis and for which pricing was disclosed during the reporting period. This differs from the chart summarizing square feet
   leased on Page 2 of this report, which covers all leasing transactions in the TREB service area.
                                                                                                                          Commercial Realty Watch, Third Quarter 2012                                                  5
TREB Commercial Division
   SUMMARY OF COMMERCIAL LEASING
                                                                                                                                                                                            CITY OF TORONTO
   TRANSACTIONS COMPLETED ON A PER SQUARE FOOT NET BASIS, WITH PRICING DISCLOSED
                                              All Transactions               0 to 1,000 Square Feet           1,001 TO 2,500 Square Feet          2,501 TO 5,000 Square Feet               5,001+ Square Feet
                                   # Trans.         Sq. Ft.  $/SF Net   # Trans.     Sq. Ft.    $/SF Net    # Trans.    Sq. Ft.   $/SF Net      # Trans.    Sq. Ft.   $/SF Net       # Trans.    Sq. Ft.   $/SF Net
   TREB Total                        108         235,105     $14.36       37        28,709      $25.13         55       86,738      $17.01         11        41,651      $14.34         5        78,007       $7.69
   City of Toronto                    47         120,096     $15.14       15        12,325      $29.01         23       34,885      $20.47          6        23,718      $16.06         3        49,168       $7.44
   Toronto West                       12          48,704     $8.60         5         4,488      $25.76         6         9,590      $16.27          0           -          -            1        34,626       $4.25
    Toronto W01                       0              -         -           0           -          -            0           -          -             0           -          -            0           -           -
    Toronto W02                       3            4,027     $16.84        1          987       $23.71         2         3,040      $14.61          0           -          -            0           -           -
    Toronto W03                       1            1,000     $19.20        1         1,000      $19.20         0           -          -             0           -          -            0           -           -
    Toronto W04                       1           34,626     $4.25         0           -          -            0           -          -             0           -          -            1        34,626       $4.25
    Toronto W05                       2            1,910     $16.02        1          850       $14.12         1         1,060      $17.55          0           -          -            0           -           -
    Toronto W06                       1            1,400     $20.57        0           -          -            1         1,400      $20.57          0           -          -            0           -           -
    Toronto W07                       1             755      $55.63        1          755       $55.63         0           -          -             0           -          -            0           -           -
    Toronto W08                       2            2,496     $22.36        1          896       $21.21         1         1,600      $23.00          0           -          -            0           -           -
    Toronto W09                       1            2,490     $11.00        0           -          -            1         2,490      $11.00          0           -          -            0           -           -
    Toronto W10                       0              -         -           0           -          -            0           -          -             0           -          -            0           -           -
   Toronto Central                    19          34,304     $25.86        5         3,717      $41.62         11       16,165      $23.29          2        8,458       $25.86         1         5,964      $23.00
    Toronto C01                       6           13,068     $29.64        1          450       $45.47         3         4,160      $35.63          2        8,458       $25.86         0           -          -
    Toronto C02                       4            9,098     $26.73        1          875       $35.66         2         2,259      $33.13          0          -           -            1         5,964      $23.00
    Toronto C03                       4            7,189     $13.53        0           -          -            4         7,189      $13.53          0          -           -            0           -          -
    Toronto C04                       1            1,000     $48.00        1         1,000      $48.00         0           -          -             0          -           -            0           -          -
    Toronto C06                       1            1,357     $15.48        0           -          -            1         1,357      $15.48          0          -           -            0           -          -
    Toronto C07                       1            1,200     $29.37        0           -          -            1         1,200      $29.37          0          -           -            0           -          -
    Toronto C08                       0              -         -           0           -          -            0           -          -             0          -           -            0           -          -
    Toronto C09                       0              -         -           0           -          -            0           -          -             0          -           -            0           -          -
    Toronto C10                       0              -         -           0           -          -            0           -          -             0          -           -            0           -          -
    Toronto C11                       1             955      $30.00        1          955       $30.00         0           -          -             0          -           -            0           -          -
    Toronto C12                       0              -         -           0           -          -            0           -          -             0          -           -            0           -          -
    Toronto C13                       0              -         -           0           -          -            0           -          -             0          -           -            0           -          -
    Toronto C14                       1             437      $60.41        1          437       $60.41         0           -          -             0          -           -            0           -          -
    Toronto C15                       0              -         -           0           -          -            0           -          -             0          -           -            0           -          -
   Toronto East                       16          37,088     $13.82        5         4,120      $21.18         6         9,130      $19.90          4        15,260      $10.62         1         8,578       $9.50
    Toronto E01                       1            1,300     $30.00        0           -          -            1         1,300      $30.00          0           -          -            0           -           -
    Toronto E02                       4            5,330     $28.79        2         1,200      $38.38         2         4,130      $26.00          0           -          -            0           -           -
    Toronto E03                       2            4,370     $15.19        1         1,000      $22.20         0           -          -             1         3,370      $13.11         0           -           -
    Toronto E04                       4           18,142     $9.64         1          986       $12.00         0           -          -             2         8,578      $9.50          1         8,578       $9.50
    Toronto E05                       0              -         -           0           -          -            0           -          -             0           -          -            0           -           -
    Toronto E06                       0              -         -           0           -          -            0           -          -             0           -          -            0           -           -
    Toronto E07                       1             934      $7.71         1          934       $7.71          0           -          -             0           -          -            0           -           -
    Toronto E08                       0              -         -           0           -          -            0           -          -             0           -          -            0           -           -
    Toronto E09                       2            2,420     $9.30         0           -          -            2         2,420      $9.30           0           -          -            0           -           -
    Toronto E10                       1            1,280     $10.00        0           -          -            1         1,280      $10.00          0           -          -            0           -           -
    Toronto E11                       1            3,312     $11.00        0           -          -            0           -          -             1         3,312      $11.00         0           -           -
   *
    NOTE: Figures in this table cover transactions completed on a per square foot net basis and for which pricing was disclosed during the reporting period. This differs from the chart summarizing square feet
   leased on Page 2 of this report, which covers all leasing transactions in the TREB service area.


                                                                                                                          Commercial Realty Watch, Third Quarter 2012                                                 6
TREB Commercial Division
   SUMMARY OF OFFICE LEASING
                                                                                                                                                                                              ALL TREB AREAS
   TRANSACTIONS COMPLETED ON A PER SQUARE FOOT NET BASIS, WITH PRICING DISCLOSED
                                              All Transactions               0 to 1,000 Square Feet           1,001 TO 2,500 Square Feet          2,501 TO 5,000 Square Feet               5,001+ Square Feet
                                   # Trans.         Sq. Ft.  $/SF Net   # Trans.     Sq. Ft.    $/SF Net    # Trans.    Sq. Ft.   $/SF Net      # Trans.    Sq. Ft.   $/SF Net       # Trans.    Sq. Ft.   $/SF Net
   TREB Total                        109         300,511     $10.79       51        32,748      $14.52         33       53,242      $12.05         16        54,155      $10.83         9        160,366      $9.59
   Halton Region                      11          16,878     $13.83        4         1,312      $13.41         4         5,840      $11.90          3        9,726       $15.05         0           -              -
    Burlington                        2            5,481     $11.99        0           -          -            0           -          -             2        5,481       $11.99         0           -              -
    Halton Hills                      5            3,712     $11.85        4         1,312      $13.41         1         2,400      $11.00          0          -           -            0           -              -
    Milton                            1            1,168     $12.00        0           -          -            1         1,168      $12.00          0          -           -            0           -              -
    Oakville                          3            6,517     $16.83        0           -          -            2         2,272      $12.79          1        4,245       $19.00         0           -              -
   Peel Region                        24          37,950      $9.38       10         6,330      $9.99          10       18,246      $10.36          4        13,374      $7.75          0           -              -
    Brampton                          4            2,998      $8.80       3          1,731      $8.66          1         1,267      $9.00           0           -          -            0           -              -
    Caledon                           0              -          -         0            -          -            0           -          -             0           -          -            0           -              -
    Mississauga                       20          34,952      $9.43       7          4,599      $10.50         9        16,979      $10.46          4        13,374      $7.75          0           -              -
   City of Toronto                    37         148,406     $10.91       24        14,834      $18.12         6         9,214      $18.52          4        14,307      $13.38         3        110,051     $8.97
     West                             15         115,022     $9.11        10         6,981      $12.97         1         1,373      $11.36          2         5,877      $17.39         2        100,791     $8.33
     Central                          16          29,582     $16.85       9          5,251      $24.51         4         6,641      $19.92          2         8,430      $10.59         1         9,260      $16.00
     East                             6            3,802     $19.02       5          2,602      $19.03         1         1,200      $19.00          0           -          -            0           -          -
   York Region                        35          91,866     $10.94       13        10,272      $12.26         12       18,693      $10.70          4        12,586      $10.30         6        50,315      $10.93
    Aurora                            2            4,060     $11.29       0            -          -            2         4,060      $11.29          0           -          -            0           -          -
    E. Gwillimbury                    0              -         -          0            -          -            0           -          -             0           -          -            0           -          -
    Georgina                          0              -         -          0            -          -            0           -          -             0           -          -            0           -          -
    King                              0              -         -          0            -          -            0           -          -             0           -          -            0           -          -
    Markham                           13          40,005     $9.36        4          3,065      $10.71         3         4,310      $9.41           3         9,505      $10.80         3        23,125      $8.58
    Newmarket                         1            8,591     $10.00       0            -          -            0           -          -             0           -          -            1         8,591      $10.00
    Richmond Hill                     10          11,610     $10.50       5          4,109      $10.78         5         7,501      $10.34          0           -          -            0           -          -
    Vaughan                           9           27,600     $13.67       4          3,098      $15.75         2         2,822      $12.76          1         3,081      $8.75          2        18,599      $14.28
    Whitchurch-Stouffville            0              -         -          0            -          -            0           -          -             0           -          -            0           -          -
   Durham Region                      2           5,411      $5.19         0           -           -           1         1,249      $10.00          1        4,162       $3.75          0           -              -
    Ajax                              1           1,249      $10.00        0           -           -           1         1,249      $10.00          0          -           -            0           -              -
    Brock                             0             -          -           0           -           -           0           -          -             0          -           -            0           -              -
    Clarington                        0             -          -           0           -           -           0           -          -             0          -           -            0           -              -
    Oshawa                            0             -          -           0           -           -           0           -          -             0          -           -            0           -              -
    Pickering                         1           4,162      $3.75         0           -           -           0           -          -             1        4,162       $3.75          0           -              -
    Scugog                            0             -          -           0           -           -           0           -          -             0          -           -            0           -              -
    Uxbridge                          0             -          -           0           -           -           0           -          -             0          -           -            0           -              -
    Whitby                            0             -          -           0           -           -           0           -          -             0          -           -            0           -              -
   Dufferin County                    0              -          -          0           -           -           0           -           -            0           -          -            0           -              -
    Orangeville                       0              -          -          0           -           -           0           -           -            0           -          -            0           -              -
   Simcoe County                      0              -          -          0           -           -           0           -           -            0           -          -            0           -              -
     Adjala-Tosorontio                0              -          -          0           -           -           0           -           -            0           -          -            0           -              -
     Bradford West Gwillimbury        0              -          -          0           -           -           0           -           -            0           -          -            0           -              -
     Essa                             0              -          -          0           -           -           0           -           -            0           -          -            0           -              -
     Innisfil                         0              -          -          0           -           -           0           -           -            0           -          -            0           -              -
     New Tecumseth                    0              -          -          0           -           -           0           -           -            0           -          -            0           -              -
   *
    NOTE: Figures in this table cover transactions completed on a per square foot net basis and for which pricing was disclosed during the reporting period. This differs from the chart summarizing square feet
   leased on Page 2 of this report, which covers all leasing transactions in the TREB service area.
                                                                                                                          Commercial Realty Watch, Third Quarter 2012                                                  7
TREB Commercial Division
   SUMMARY OF OFFICE LEASING
                                                                                                                                                                                            CITY OF TORONTO
   TRANSACTIONS COMPLETED ON A PER SQUARE FOOT NET BASIS, WITH PRICING DISCLOSED
                                              All Transactions               0 to 1,000 Square Feet           1,001 TO 2,500 Square Feet          2,501 TO 5,000 Square Feet               5,001+ Square Feet
                                   # Trans.         Sq. Ft.  $/SF Net   # Trans.     Sq. Ft.    $/SF Net    # Trans.    Sq. Ft.   $/SF Net      # Trans.    Sq. Ft.   $/SF Net       # Trans.    Sq. Ft.   $/SF Net
   TREB Total                        109         300,511     $10.79       51        32,748      $14.52         33       53,242      $12.05         16        54,155      $10.83         9        160,366      $9.59
   City of Toronto                    37         148,406     $10.91       24        14,834      $18.12         6         9,214      $18.52          4        14,307      $13.38         3        110,051      $8.97
   Toronto West                       15         115,022     $9.11        10         6,981      $12.97         1         1,373      $11.36          2        5,877       $17.39         2        100,791      $8.33
    Toronto W01                       1            2,677     $26.22       0            -          -            0           -          -             1        2,677       $26.22         0            -          -
    Toronto W02                       0              -         -          0            -          -            0           -          -             0          -           -            0            -          -
    Toronto W03                       1             400      $13.50       1           400       $13.50         0           -          -             0          -           -            0            -          -
    Toronto W04                       4            2,888     $11.49       4          2,888      $11.49         0           -          -             0          -           -            0            -          -
    Toronto W05                       6           16,172     $5.81        4          3,008      $13.29         1         1,373      $11.36          0          -           -            1         11,791      $3.25
    Toronto W06                       1             685      $17.52       1           685       $17.52         0           -          -             0          -           -            0            -          -
    Toronto W07                       0              -         -          0            -          -            0           -          -             0          -           -            0            -          -
    Toronto W08                       2           92,200     $9.03        0            -          -            0           -          -             1        3,200       $10.00         1         89,000      $9.00
    Toronto W09                       0              -         -          0            -          -            0           -          -             0          -           -            0            -          -
    Toronto W10                       0              -         -          0            -          -            0           -          -             0          -           -            0            -          -
   Toronto Central                    16          29,582     $16.85        9         5,251      $24.51         4         6,641      $19.92          2        8,430       $10.59         1         9,260      $16.00
    Toronto C01                       3            2,420     $29.26        2          770       $46.75         1         1,650      $21.09          0          -           -            0           -          -
    Toronto C02                       4           16,316     $17.65        1          557       $29.08         1         1,869      $26.50          1        4,630       $16.00         1         9,260      $16.00
    Toronto C03                       0              -         -           0           -          -            0           -          -             0          -           -            0           -          -
    Toronto C04                       0              -         -           0           -          -            0           -          -             0          -           -            0           -          -
    Toronto C06                       0              -         -           0           -          -            0           -          -             0          -           -            0           -          -
    Toronto C07                       2            2,195     $19.68        1          500       $27.60         1         1,695      $17.35          0          -           -            0           -          -
    Toronto C08                       0              -         -           0           -          -            0           -          -             0          -           -            0           -          -
    Toronto C09                       0              -         -           0           -          -            0           -          -             0          -           -            0           -          -
    Toronto C10                       1             900      $16.67        1          900       $16.67         0           -          -             0          -           -            0           -          -
    Toronto C11                       0              -         -           0           -          -            0           -          -             0          -           -            0           -          -
    Toronto C12                       0              -         -           0           -          -            0           -          -             0          -           -            0           -          -
    Toronto C13                       1            1,427     $13.00        0           -          -            1         1,427      $13.00          0          -           -            0           -          -
    Toronto C14                       2            1,081     $29.67        2         1,081      $29.67         0           -          -             0          -           -            0           -          -
    Toronto C15                       3            5,243     $5.87         2         1,443      $10.81         0           -          -             1        3,800       $4.00          0           -          -
   Toronto East                       6           3,802      $19.02        5         2,602      $19.03         1         1,200      $19.00          0           -          -            0           -              -
    Toronto E01                       1           1,200      $19.00        0           -          -            1         1,200      $19.00          0           -          -            0           -              -
    Toronto E02                       0             -          -           0           -          -            0           -          -             0           -          -            0           -              -
    Toronto E03                       2           1,522      $22.86        2         1,522      $22.86         0           -          -             0           -          -            0           -              -
    Toronto E04                       1            550       $5.50         1          550       $5.50          0           -          -             0           -          -            0           -              -
    Toronto E05                       0             -          -           0           -          -            0           -          -             0           -          -            0           -              -
    Toronto E06                       0             -          -           0           -          -            0           -          -             0           -          -            0           -              -
    Toronto E07                       1            250       $24.00        1          250       $24.00         0           -          -             0           -          -            0           -              -
    Toronto E08                       0             -          -           0           -          -            0           -          -             0           -          -            0           -              -
    Toronto E09                       1            280       $20.36        1          280       $20.36         0           -          -             0           -          -            0           -              -
    Toronto E10                       0             -          -           0           -          -            0           -          -             0           -          -            0           -              -
    Toronto E11                       0             -          -           0           -          -            0           -          -             0           -          -            0           -              -
   *
    NOTE: Figures in this table cover transactions completed on a per square foot net basis and for which pricing was disclosed during the reporting period. This differs from the chart summarizing square feet
   leased on Page 2 of this report, which covers all leasing transactions in the TREB service area.


                                                                                                                          Commercial Realty Watch, Third Quarter 2012                                                  8
TREB Commercial Division
   SUMMARY OF INDUSTRIAL SALES
                                                                                                                                                                                                 ALL TREB AREAS
   TRANSACTIONS COMPLETED WITH PRICING DISCLOSED
                                              All Transactions                0 to 5,000 Square Feet            5,001 to 15,000 Square Feet         15,001 to 50,000 Square Feet             50,001 + Square Feet
                                   # Trans.         Sq. Ft.    $/SF      # Trans.     Sq. Ft.     $/SF        # Trans.     Sq. Ft.     $/SF        # Trans.    Sq. Ft.     $/SF         # Trans.    Sq. Ft.     $/SF
   TREB Total                         101       1,907,356    $70.18        54        105,651     $156.13         17       148,482     $110.36         19       509,769     $101.86         11      1,143,454     $43.14
   Halton Region                       3          97,496     $75.75         1         1,260      $206.35         0            -           -           1         24,270     $122.58          1        71,966      $57.67
    Burlington                         0             -         -            0           -           -            0            -           -           0            -          -             0           -          -
    Halton Hills                       0             -         -            0           -           -            0            -           -           0            -          -             0           -          -
    Milton                             0             -         -            0           -           -            0            -           -           0            -          -             0           -          -
    Oakville                           3          97,496     $75.75         1         1,260      $206.35         0            -           -           1         24,270     $122.58          1        71,966      $57.67
   Peel Region                        25         433,023    $108.75        13        28,151      $159.76         3         31,527     $111.81         7        227,918     $117.67          2       145,427      $84.21
    Brampton                          9          189,379     $89.50        6          9,024      $166.48         0            -          -            1         34,928      $91.62          2       145,427      $84.21
    Caledon                           1           11,200     $80.36        0            -           -            1         11,200      $80.36         0            -          -             0          -           -
    Mississauga                       15         232,444    $125.79        7         19,127      $156.58         2         20,327     $129.14         6        192,990     $122.39          0          -           -
   City of Toronto                    33         887,266     $59.15        13        27,303      $142.12         9         64,718     $116.61         6        129,008      $91.93          5       666,237      $43.82
     West                             15         433,830     $70.03        2          6,000      $160.00         6         43,855     $125.16         4         91,688      $91.12          3       292,287      $53.29
     Central                          0             -          -           0            -           -            0            -          -            0            -          -             0          -           -
     East                             18         453,436     $48.75        11        21,303      $137.09         3         20,863      $98.64         2         37,320      $93.92          2       373,950      $36.43
   York Region                        26         130,200    $136.43        21        40,005      $170.83         2         19,448     $140.12         3         70,747     $115.96          0           -           -
    Aurora                            5           37,665    $104.08        4          7,388      $170.55         0            -          -            1         30,277      $87.86          0           -           -
    E. Gwillimbury                    0              -         -           0            -           -            0            -          -            0            -          -             0           -           -
    Georgina                          0              -         -           0            -           -            0            -          -            0            -          -             0           -           -
    King                              0              -         -           0            -           -            0            -          -            0            -          -             0           -           -
    Markham                           5            8,365    $166.89        5          8,365      $166.89         0            -          -            0            -          -             0           -           -
    Newmarket                         2            3,467    $175.94        2          3,467      $175.94         0            -          -            0            -          -             0           -           -
    Richmond Hill                     3            6,285    $194.91        3          6,285      $194.91         0            -          -            0            -          -             0           -           -
    Vaughan                           11          74,418    $142.60        7         14,500      $161.59         2         19,448     $140.12         2         40,470     $136.98          0           -           -
    Whitchurch-Stouffville            0              -         -           0            -           -            0            -          -            0            -          -             0           -           -
   Durham Region                      12         320,265     $27.39         5         7,032      $106.44         3         32,789      $78.99         1         20,620      $82.44          3       259,824      $14.38
    Ajax                              1           20,620     $82.44         0           -           -            0            -          -            1         20,620      $82.44          0           -          -
    Brock                             1           12,387     $77.90         0           -           -            1         12,387      $77.90         0            -          -             0           -          -
    Clarington                        1            1,495    $105.69         1         1,495      $105.69         0            -          -            0            -          -             0           -          -
    Oshawa                            2            6,877     $85.79         1         1,475      $111.86         1          5,402      $78.67         0            -          -             0           -          -
    Pickering                         1             942      $87.58         1          942        $87.58         0            -          -            0            -          -             0           -          -
    Scugog                            2          200,376     $7.59          0           -           -            0            -          -            0            -          -             2       200,376      $7.59
    Uxbridge                          0              -         -            0           -           -            0            -          -            0            -          -             0           -          -
    Whitby                            4           77,568     $48.45         2         3,120      $109.94         1         15,000      $80.00         0            -          -             1        59,448      $37.26
   Dufferin County                     1          1,900       $0.00         1         1,900      $144.74         0            -           -           0            -           -            0           -           -
    Orangeville                        1          1,900       $0.00         1         1,900      $144.74         0            -           -           0            -           -            0           -           -
   Simcoe County                       1          37,206      $9.86         0           -           -            0            -           -           1         37,206      $9.86           0           -           -
     Adjala-Tosorontio                 0             -          -           0           -           -            0            -           -           0            -          -             0           -           -
     Bradford West Gwillimbury         0             -          -           0           -           -            0            -           -           0            -          -             0           -           -
     Essa                              0             -          -           0           -           -            0            -           -           0            -          -             0           -           -
     Innisfil                          0             -          -           0           -           -            0            -           -           0            -          -             0           -           -
     New Tecumseth                     1          37,206      $9.86         0           -           -            0            -           -           1         37,206      $9.86           0           -           -
   *
    NOTE: Figures in this table cover transactions for which pricing was disclosed during the reporting period. This differs from the chart summarizing sales on Page 2 of this report, which covers all sale transactions
   in the TREB service area.
                                                                                                                            Commercial Realty Watch, Third Quarter 2012                                                      9
TREB Commercial Division
   SUMMARY OF INDUSTRIAL SALES - CONDOMINIUM BREAKOUT
                                                                                                                                                                                                 ALL TREB AREAS
   TRANSACTIONS COMPLETED WITH PRICING DISCLOSED
                                              All Transactions                0 to 5,000 Square Feet            5,001 to 15,000 Square Feet         15,001 to 50,000 Square Feet             50,001 + Square Feet
                                   # Trans.         Sq. Ft.    $/SF      # Trans.     Sq. Ft.     $/SF        # Trans.     Sq. Ft.     $/SF        # Trans.    Sq. Ft.     $/SF         # Trans.    Sq. Ft.     $/SF
   TREB Total                         47         103,752    $139.08        43        77,524      $149.89         4         26,228     $117.62         0            -           -            0           -           -
   Halton Region                       1          1,260     $206.35         1         1,260      $206.35         0            -           -           0            -           -            0           -           -
    Burlington                         0            -          -            0           -           -            0            -           -           0            -           -            0           -           -
    Halton Hills                       0            -          -            0           -           -            0            -           -           0            -           -            0           -           -
    Milton                             0            -          -            0           -           -            0            -           -           0            -           -            0           -           -
    Oakville                           1          1,260     $206.35         1         1,260      $206.35         0            -           -           0            -           -            0           -           -
   Peel Region                         8          13,937    $156.63         8        13,937      $156.63         0            -           -           0            -           -            0           -           -
    Brampton                           4           5,566    $150.90         4         5,566      $150.90         0            -           -           0            -           -            0           -           -
    Caledon                            0             -         -            0           -           -            0            -           -           0            -           -            0           -           -
    Mississauga                        4           8,371    $160.43         4         8,371      $160.43         0            -           -           0            -           -            0           -           -
   City of Toronto                    14          42,701    $115.56        11        22,203      $113.70         3         20,498     $117.57         0            -           -            0           -           -
     West                             3           17,450    $115.19        1          3,000      $101.67         2         14,450     $117.99         0            -           -            0           -           -
     Central                          0              -         -           0            -           -            0            -          -            0            -           -            0           -           -
     East                             11          25,251    $115.81        10        19,203      $115.58         1          6,048     $116.57         0            -           -            0           -           -
   York Region                        19          38,722    $167.97        18        32,992      $176.68         1         5,730      $117.80         0            -           -            0           -           -
    Aurora                            4            7,388    $170.55        4          7,388      $170.55         0           -           -            0            -           -            0           -           -
    E. Gwillimbury                    0              -         -           0            -           -            0           -           -            0            -           -            0           -           -
    Georgina                          0              -         -           0            -           -            0           -           -            0            -           -            0           -           -
    King                              0              -         -           0            -           -            0           -           -            0            -           -            0           -           -
    Markham                           5            8,365    $166.89        5          8,365      $166.89         0           -           -            0            -           -            0           -           -
    Newmarket                         2            3,467    $175.94        2          3,467      $175.94         0           -           -            0            -           -            0           -           -
    Richmond Hill                     2            4,600    $196.74        2          4,600      $196.74         0           -           -            0            -           -            0           -           -
    Vaughan                           6           14,902    $156.56        5          9,172      $180.77         1         5,730      $117.80         0            -           -            0           -           -
    Whitchurch-Stouffville            0              -         -           0            -           -            0           -           -            0            -           -            0           -           -
   Durham Region                       4          5,232     $104.84         4         5,232      $104.84         0            -           -           0            -           -            0           -           -
    Ajax                               0            -          -            0           -           -            0            -           -           0            -           -            0           -           -
    Brock                              0            -          -            0           -           -            0            -           -           0            -           -            0           -           -
    Clarington                         1          1,495     $105.69         1         1,495      $105.69         0            -           -           0            -           -            0           -           -
    Oshawa                             1          1,475     $111.86         1         1,475      $111.86         0            -           -           0            -           -            0           -           -
    Pickering                          1           942       $87.58         1          942        $87.58         0            -           -           0            -           -            0           -           -
    Scugog                             0            -          -            0           -           -            0            -           -           0            -           -            0           -           -
    Uxbridge                           0            -          -            0           -           -            0            -           -           0            -           -            0           -           -
    Whitby                             1          1,320     $108.33         1         1,320      $108.33         0            -           -           0            -           -            0           -           -
   Dufferin County                     1          1,900       $0.00         1         1,900      $144.74         0            -           -           0            -           -            0           -           -
    Orangeville                        1          1,900       $0.00         1         1,900      $144.74         0            -           -           0            -           -            0           -           -
   Simcoe County                       0             -          -           0           -           -            0            -           -           0            -           -            0           -           -
     Adjala-Tosorontio                 0             -          -           0           -           -            0            -           -           0            -           -            0           -           -
     Bradford West Gwillimbury         0             -          -           0           -           -            0            -           -           0            -           -            0           -           -
     Essa                              0             -          -           0           -           -            0            -           -           0            -           -            0           -           -
     Innisfil                          0             -          -           0           -           -            0            -           -           0            -           -            0           -           -
     New Tecumseth                     0             -          -           0           -           -            0            -           -           0            -           -            0           -           -
   *
    NOTE: Figures in this table cover transactions for which pricing was disclosed during the reporting period. This differs from the chart summarizing sales on Page 2 of this report, which covers all sale transactions
   in the TREB service area.
                                                                                                                            Commercial Realty Watch, Third Quarter 2012                                                  10
TREB Commercial Division
   SUMMARY OF INDUSTRIAL SALES - OTHER TYPES BREAKOUT
                                                                                                                                                                                                 ALL TREB AREAS
   TRANSACTIONS COMPLETED WITH PRICING DISCLOSED
                                              All Transactions                0 to 5,000 Square Feet            5,001 to 15,000 Square Feet         15,001 to 50,000 Square Feet             50,001 + Square Feet
                                   # Trans.         Sq. Ft.    $/SF      # Trans.     Sq. Ft.     $/SF        # Trans.     Sq. Ft.     $/SF        # Trans.    Sq. Ft.     $/SF         # Trans.    Sq. Ft.     $/SF
   TREB Total                         54        1,803,604    $66.22        11        28,127      $173.34         13       122,254     $108.81         19       509,769     $101.86         11      1,143,454     $43.14
   Halton Region                       2          96,236     $74.04         0           -           -            0            -           -           1         24,270     $122.58          1        71,966      $57.67
    Burlington                         0             -         -            0           -           -            0            -           -           0            -          -             0           -          -
    Halton Hills                       0             -         -            0           -           -            0            -           -           0            -          -             0           -          -
    Milton                             0             -         -            0           -           -            0            -           -           0            -          -             0           -          -
    Oakville                           2          96,236     $74.04         0           -           -            0            -           -           1         24,270     $122.58          1        71,966      $57.67
   Peel Region                        17         419,086    $107.15         5        14,214      $162.83         3         31,527     $111.81         7        227,918     $117.67          2       145,427      $84.21
    Brampton                          5          183,813     $87.64         2         3,458      $191.57         0            -          -            1         34,928      $91.62          2       145,427      $84.21
    Caledon                           1           11,200     $80.36         0           -           -            1         11,200      $80.36         0            -          -             0          -           -
    Mississauga                       11         224,073    $124.50         3        10,756      $153.59         2         20,327     $129.14         6        192,990     $122.39          0          -           -
   City of Toronto                    19         844,565     $56.30         2         5,100      $265.88         6         44,220     $116.17         6        129,008      $91.93          5       666,237      $43.82
     West                             12         416,380     $68.13         1         3,000      $218.33         4         29,405     $128.69         4         91,688      $91.12          3       292,287      $53.29
     Central                          0             -          -            0           -           -            0            -          -            0            -          -             0          -           -
     East                             7          428,185     $44.80         1         2,100      $333.81         2         14,815      $91.33         2         37,320      $93.92          2       373,950      $36.43
   York Region                         7          91,478    $123.07         3         7,013      $143.31         1         13,718     $149.44         3         70,747     $115.96          0           -           -
    Aurora                             1          30,277     $87.86         0           -           -            0            -          -            1         30,277      $87.86          0           -           -
    E. Gwillimbury                     0             -         -            0           -           -            0            -          -            0            -          -             0           -           -
    Georgina                           0             -         -            0           -           -            0            -          -            0            -          -             0           -           -
    King                               0             -         -            0           -           -            0            -          -            0            -          -             0           -           -
    Markham                            0             -         -            0           -           -            0            -          -            0            -          -             0           -           -
    Newmarket                          0             -         -            0           -           -            0            -          -            0            -          -             0           -           -
    Richmond Hill                      1           1,685    $189.91         1         1,685      $189.91         0            -          -            0            -          -             0           -           -
    Vaughan                            5          59,516    $139.10         2         5,328      $128.57         1         13,718     $149.44         2         40,470     $136.98          0           -           -
    Whitchurch-Stouffville             0             -         -            0           -           -            0            -          -            0            -          -             0           -           -
   Durham Region                       8         315,033     $26.11         1         1,800      $111.11         3         32,789      $78.99         1         20,620      $82.44          3       259,824      $14.38
    Ajax                               1          20,620     $82.44         0           -           -            0            -          -            1         20,620      $82.44          0           -          -
    Brock                              1          12,387     $77.90         0           -           -            1         12,387      $77.90         0            -          -             0           -          -
    Clarington                         0             -         -            0           -           -            0            -          -            0            -          -             0           -          -
    Oshawa                             1           5,402     $78.67         0           -           -            1          5,402      $78.67         0            -          -             0           -          -
    Pickering                          0             -         -            0           -           -            0            -          -            0            -          -             0           -          -
    Scugog                             2         200,376     $7.59          0           -           -            0            -          -            0            -          -             2       200,376      $7.59
    Uxbridge                           0             -         -            0           -           -            0            -          -            0            -          -             0           -          -
    Whitby                             3          76,248     $47.41         1         1,800      $111.11         1         15,000      $80.00         0            -          -             1        59,448      $37.26
   Dufferin County                     0             -          -           0           -           -            0            -           -           0            -           -            0           -           -
    Orangeville                        0             -          -           0           -           -            0            -           -           0            -           -            0           -           -
   Simcoe County                       1          37,206      $9.86         0           -           -            0            -           -           1         37,206      $9.86           0           -           -
     Adjala-Tosorontio                 0             -          -           0           -           -            0            -           -           0            -          -             0           -           -
     Bradford West Gwillimbury         0             -          -           0           -           -            0            -           -           0            -          -             0           -           -
     Essa                              0             -          -           0           -           -            0            -           -           0            -          -             0           -           -
     Innisfil                          0             -          -           0           -           -            0            -           -           0            -          -             0           -           -
     New Tecumseth                     1          37,206      $9.86         0           -           -            0            -           -           1         37,206      $9.86           0           -           -
   *
    NOTE: Figures in this table cover transactions for which pricing was disclosed during the reporting period. This differs from the chart summarizing sales on Page 2 of this report, which covers all sale transactions
   in the TREB service area.
                                                                                                                            Commercial Realty Watch, Third Quarter 2012                                                   11
Commercial Real Estate Market Watch for Toronto: September 2012

Weitere ähnliche Inhalte

Ähnlich wie Commercial Real Estate Market Watch for Toronto: September 2012

TREB Condo Report Q4 2012
TREB Condo Report Q4 2012TREB Condo Report Q4 2012
TREB Condo Report Q4 2012Chaba Tamasi
 
Rental Market Report Q4 2012
Rental Market Report Q4 2012Rental Market Report Q4 2012
Rental Market Report Q4 2012Chaba Tamasi
 
Condo Report OCT 2012
Condo Report OCT 2012Condo Report OCT 2012
Condo Report OCT 2012Chaba Tamasi
 
Toronto condo market statistical report Q4 2011
Toronto condo market statistical report Q4 2011Toronto condo market statistical report Q4 2011
Toronto condo market statistical report Q4 2011John Helfrich
 
TREB Market Watch October 2012
TREB Market Watch October 2012TREB Market Watch October 2012
TREB Market Watch October 2012realestatesnatch
 
TREB Market Watch Report November 2012
TREB Market Watch Report November 2012TREB Market Watch Report November 2012
TREB Market Watch Report November 2012realestatesnatch
 
Las Vegas Americas Market Beat Office Q42011
Las Vegas Americas Market Beat Office Q42011Las Vegas Americas Market Beat Office Q42011
Las Vegas Americas Market Beat Office Q42011Jessica Parrish
 
Condo report q3-2011
Condo report q3-2011Condo report q3-2011
Condo report q3-2011mikkagan
 
Toronto condo market statistical report 2011
Toronto condo market statistical report 2011Toronto condo market statistical report 2011
Toronto condo market statistical report 2011John Helfrich
 
Office fall2010 final
Office fall2010 finalOffice fall2010 final
Office fall2010 finalChris Fyvie
 
DC 3Q12 Office Snapshot
DC 3Q12 Office SnapshotDC 3Q12 Office Snapshot
DC 3Q12 Office Snapshotkottmeier
 
Las Vegas Americas Market Beat Industrial Q42011
Las Vegas Americas Market Beat Industrial Q42011Las Vegas Americas Market Beat Industrial Q42011
Las Vegas Americas Market Beat Industrial Q42011Jessica Parrish
 
Toronto real estate statistics august 2011
Toronto real estate statistics august 2011Toronto real estate statistics august 2011
Toronto real estate statistics august 2011John Helfrich
 

Ähnlich wie Commercial Real Estate Market Watch for Toronto: September 2012 (20)

TREB Condo Report Q4 2012
TREB Condo Report Q4 2012TREB Condo Report Q4 2012
TREB Condo Report Q4 2012
 
Toronto REALTORS Rental Market Report 4th Quarter 2012. Toronto Real Estate B...
Toronto REALTORS Rental Market Report 4th Quarter 2012. Toronto Real Estate B...Toronto REALTORS Rental Market Report 4th Quarter 2012. Toronto Real Estate B...
Toronto REALTORS Rental Market Report 4th Quarter 2012. Toronto Real Estate B...
 
Rental Market Report Q4 2012
Rental Market Report Q4 2012Rental Market Report Q4 2012
Rental Market Report Q4 2012
 
Condo Report OCT 2012
Condo Report OCT 2012Condo Report OCT 2012
Condo Report OCT 2012
 
Greater Toronto REALTORS Rental Report for Q2, 2012
Greater Toronto REALTORS Rental Report for Q2, 2012Greater Toronto REALTORS Rental Report for Q2, 2012
Greater Toronto REALTORS Rental Report for Q2, 2012
 
Greater Toronto REALTORS Condo Report for Q2, 2012
Greater Toronto REALTORS Condo Report for Q2, 2012Greater Toronto REALTORS Condo Report for Q2, 2012
Greater Toronto REALTORS Condo Report for Q2, 2012
 
Toronto condo market statistical report Q4 2011
Toronto condo market statistical report Q4 2011Toronto condo market statistical report Q4 2011
Toronto condo market statistical report Q4 2011
 
TREB Market Watch October 2012
TREB Market Watch October 2012TREB Market Watch October 2012
TREB Market Watch October 2012
 
Toronto Real Estate Board Market Watch for October 2012
Toronto Real Estate Board Market Watch for October 2012Toronto Real Estate Board Market Watch for October 2012
Toronto Real Estate Board Market Watch for October 2012
 
TREB Market Watch Report November 2012
TREB Market Watch Report November 2012TREB Market Watch Report November 2012
TREB Market Watch Report November 2012
 
Las Vegas Americas Market Beat Office Q42011
Las Vegas Americas Market Beat Office Q42011Las Vegas Americas Market Beat Office Q42011
Las Vegas Americas Market Beat Office Q42011
 
Office q4 2011
Office q4 2011Office q4 2011
Office q4 2011
 
Condo report q3-2011
Condo report q3-2011Condo report q3-2011
Condo report q3-2011
 
Greater Toronto Resale Condominium Report
Greater Toronto Resale Condominium ReportGreater Toronto Resale Condominium Report
Greater Toronto Resale Condominium Report
 
Toronto condo market statistical report 2011
Toronto condo market statistical report 2011Toronto condo market statistical report 2011
Toronto condo market statistical report 2011
 
Office fall2010 final
Office fall2010 finalOffice fall2010 final
Office fall2010 final
 
DC 3Q12 Office Snapshot
DC 3Q12 Office SnapshotDC 3Q12 Office Snapshot
DC 3Q12 Office Snapshot
 
Las Vegas Americas Market Beat Industrial Q42011
Las Vegas Americas Market Beat Industrial Q42011Las Vegas Americas Market Beat Industrial Q42011
Las Vegas Americas Market Beat Industrial Q42011
 
Market Watch 2013 02
Market Watch 2013 02Market Watch 2013 02
Market Watch 2013 02
 
Toronto real estate statistics august 2011
Toronto real estate statistics august 2011Toronto real estate statistics august 2011
Toronto real estate statistics august 2011
 

Mehr von Richard Silver, Certified International REALTOR®

Mehr von Richard Silver, Certified International REALTOR® (20)

The Indian Diaspora in Canada
The Indian Diaspora in CanadaThe Indian Diaspora in Canada
The Indian Diaspora in Canada
 
Canadian Foreign Buyer Mortgage Requirements
Canadian Foreign Buyer Mortgage RequirementsCanadian Foreign Buyer Mortgage Requirements
Canadian Foreign Buyer Mortgage Requirements
 
FIABCI USA International Symposium : Gateway Cities 2017
 FIABCI USA International Symposium : Gateway Cities 2017 FIABCI USA International Symposium : Gateway Cities 2017
FIABCI USA International Symposium : Gateway Cities 2017
 
Torontoism Team at Sotheby's International Realty Canada
Torontoism Team at Sotheby's International Realty CanadaTorontoism Team at Sotheby's International Realty Canada
Torontoism Team at Sotheby's International Realty Canada
 
Emerge Presentation 2016
Emerge Presentation 2016Emerge Presentation 2016
Emerge Presentation 2016
 
Accessing the Asian Market
Accessing the Asian MarketAccessing the Asian Market
Accessing the Asian Market
 
Becoming Paperless for Real Estate:
Becoming Paperless for Real Estate: Becoming Paperless for Real Estate:
Becoming Paperless for Real Estate:
 
Becoming Paperless
Becoming PaperlessBecoming Paperless
Becoming Paperless
 
Asia Trip 2015
Asia Trip 2015 Asia Trip 2015
Asia Trip 2015
 
10 things international buyers should know
10 things international buyers should know10 things international buyers should know
10 things international buyers should know
 
Becoming paperless for Ontario REALTORS
Becoming paperless for Ontario REALTORSBecoming paperless for Ontario REALTORS
Becoming paperless for Ontario REALTORS
 
Gander 2015 Presentation
Gander 2015 PresentationGander 2015 Presentation
Gander 2015 Presentation
 
RETechTalk 2015 Apps.
RETechTalk 2015 Apps.RETechTalk 2015 Apps.
RETechTalk 2015 Apps.
 
Top Tier Trends Across Canada
Top Tier Trends Across CanadaTop Tier Trends Across Canada
Top Tier Trends Across Canada
 
Toronto Housing Market Charts for February 2013
Toronto Housing Market Charts for February 2013Toronto Housing Market Charts for February 2013
Toronto Housing Market Charts for February 2013
 
Toronto Central Community Market Charts for the 4th Quarter 2012
Toronto Central Community Market Charts for the 4th Quarter 2012Toronto Central Community Market Charts for the 4th Quarter 2012
Toronto Central Community Market Charts for the 4th Quarter 2012
 
Casey House Celebrates 25 Years!!
Casey House Celebrates 25 Years!! Casey House Celebrates 25 Years!!
Casey House Celebrates 25 Years!!
 
N. Barry Lyons on the Toronto Condo Market for 2013
N. Barry Lyons on the Toronto Condo Market for 2013N. Barry Lyons on the Toronto Condo Market for 2013
N. Barry Lyons on the Toronto Condo Market for 2013
 
Yorkville Hazelton Heritage Conservation District
Yorkville Hazelton Heritage Conservation DistrictYorkville Hazelton Heritage Conservation District
Yorkville Hazelton Heritage Conservation District
 
Market Watch for January 2013
Market Watch for January 2013Market Watch for January 2013
Market Watch for January 2013
 

Kürzlich hochgeladen

Kohinoor Hinjewadi Phase 2 In Pune - PDF.pdf
Kohinoor Hinjewadi Phase 2 In Pune - PDF.pdfKohinoor Hinjewadi Phase 2 In Pune - PDF.pdf
Kohinoor Hinjewadi Phase 2 In Pune - PDF.pdfmonikasharma630
 
Goyal Orchid Life East Bangalore.pdf.pdf
Goyal Orchid Life East Bangalore.pdf.pdfGoyal Orchid Life East Bangalore.pdf.pdf
Goyal Orchid Life East Bangalore.pdf.pdfkratirudram
 
Listing Turkey Green life Istanbul Eyup Catalog
Listing Turkey Green life Istanbul Eyup CatalogListing Turkey Green life Istanbul Eyup Catalog
Listing Turkey Green life Istanbul Eyup CatalogListing Turkey
 
Prestige Somerville Whitefield Bangalore E- Brochure.pdf
Prestige Somerville Whitefield Bangalore E- Brochure.pdfPrestige Somerville Whitefield Bangalore E- Brochure.pdf
Prestige Somerville Whitefield Bangalore E- Brochure.pdffaheemali990101
 
Kolte Patil Mirabilis at Horamavu Road, Bangalore E brochure.pdf
Kolte Patil Mirabilis at Horamavu Road, Bangalore E brochure.pdfKolte Patil Mirabilis at Horamavu Road, Bangalore E brochure.pdf
Kolte Patil Mirabilis at Horamavu Road, Bangalore E brochure.pdfAhanundefined
 
Provident Kenworth Rajendra Nagar Hyderabad.pdf
Provident Kenworth Rajendra Nagar Hyderabad.pdfProvident Kenworth Rajendra Nagar Hyderabad.pdf
Provident Kenworth Rajendra Nagar Hyderabad.pdfashiyadav24
 
Experion Elements Sector 45 Noida_Brochure.pdf.pdf
Experion Elements Sector 45 Noida_Brochure.pdf.pdfExperion Elements Sector 45 Noida_Brochure.pdf.pdf
Experion Elements Sector 45 Noida_Brochure.pdf.pdfkratirudram
 
Clemson Engineering Consultant Dubai For Innovative and Sustainable Engineeri...
Clemson Engineering Consultant Dubai For Innovative and Sustainable Engineeri...Clemson Engineering Consultant Dubai For Innovative and Sustainable Engineeri...
Clemson Engineering Consultant Dubai For Innovative and Sustainable Engineeri...Clemson Engineering Consultant
 
Ganga Fusion 85 Gurugram - PDF Download.pdf
Ganga Fusion 85 Gurugram - PDF Download.pdfGanga Fusion 85 Gurugram - PDF Download.pdf
Ganga Fusion 85 Gurugram - PDF Download.pdfanjalisaini334541
 
Prestige Sector 94 at Noida E Brochure.pdf
Prestige Sector 94 at Noida E Brochure.pdfPrestige Sector 94 at Noida E Brochure.pdf
Prestige Sector 94 at Noida E Brochure.pdfsarak0han45400
 
Listing Turkey - Viva Perla Maltepe Catalog
Listing Turkey - Viva Perla Maltepe CatalogListing Turkey - Viva Perla Maltepe Catalog
Listing Turkey - Viva Perla Maltepe CatalogListing Turkey
 
Kolte Patil Universe Hinjewadi Pune Brochure.pdf
Kolte Patil Universe Hinjewadi Pune Brochure.pdfKolte Patil Universe Hinjewadi Pune Brochure.pdf
Kolte Patil Universe Hinjewadi Pune Brochure.pdfPrachiRudram
 
Lancaster Market Expenses and Company Worksheet
Lancaster Market Expenses and Company WorksheetLancaster Market Expenses and Company Worksheet
Lancaster Market Expenses and Company WorksheetTom Blefko
 
Sobha Oakshire Devanhalli Bangalore.pdf.pdf
Sobha Oakshire Devanhalli Bangalore.pdf.pdfSobha Oakshire Devanhalli Bangalore.pdf.pdf
Sobha Oakshire Devanhalli Bangalore.pdf.pdfkratirudram
 
The Role of Mortgage Brokers in Retirement Housing: Key Considerations
The Role of Mortgage Brokers in Retirement Housing: Key ConsiderationsThe Role of Mortgage Brokers in Retirement Housing: Key Considerations
The Role of Mortgage Brokers in Retirement Housing: Key Considerationssunlite Mortgage
 
Purva Park Hill Kanakapura Road Bangalore.pdf
Purva Park Hill  Kanakapura Road Bangalore.pdfPurva Park Hill  Kanakapura Road Bangalore.pdf
Purva Park Hill Kanakapura Road Bangalore.pdfashiyadav24
 
LCAR Unit 21 - Closing the Real Estate Transaction - 14th Edition Revised
LCAR Unit 21 - Closing the Real Estate Transaction - 14th Edition RevisedLCAR Unit 21 - Closing the Real Estate Transaction - 14th Edition Revised
LCAR Unit 21 - Closing the Real Estate Transaction - 14th Edition RevisedTom Blefko
 
Pride Wonderland Dhanori Pune Brochure.pdf
Pride Wonderland Dhanori Pune Brochure.pdfPride Wonderland Dhanori Pune Brochure.pdf
Pride Wonderland Dhanori Pune Brochure.pdfabbu831446
 
LCAR Unit 20 - Appraising Real Estate - 14th Edition Revised
LCAR Unit 20 - Appraising Real Estate - 14th Edition RevisedLCAR Unit 20 - Appraising Real Estate - 14th Edition Revised
LCAR Unit 20 - Appraising Real Estate - 14th Edition RevisedTom Blefko
 
Anandtara Iris Residences Mundhwa Pune Brochure.pdf
Anandtara Iris Residences Mundhwa Pune Brochure.pdfAnandtara Iris Residences Mundhwa Pune Brochure.pdf
Anandtara Iris Residences Mundhwa Pune Brochure.pdfabbu831446
 

Kürzlich hochgeladen (20)

Kohinoor Hinjewadi Phase 2 In Pune - PDF.pdf
Kohinoor Hinjewadi Phase 2 In Pune - PDF.pdfKohinoor Hinjewadi Phase 2 In Pune - PDF.pdf
Kohinoor Hinjewadi Phase 2 In Pune - PDF.pdf
 
Goyal Orchid Life East Bangalore.pdf.pdf
Goyal Orchid Life East Bangalore.pdf.pdfGoyal Orchid Life East Bangalore.pdf.pdf
Goyal Orchid Life East Bangalore.pdf.pdf
 
Listing Turkey Green life Istanbul Eyup Catalog
Listing Turkey Green life Istanbul Eyup CatalogListing Turkey Green life Istanbul Eyup Catalog
Listing Turkey Green life Istanbul Eyup Catalog
 
Prestige Somerville Whitefield Bangalore E- Brochure.pdf
Prestige Somerville Whitefield Bangalore E- Brochure.pdfPrestige Somerville Whitefield Bangalore E- Brochure.pdf
Prestige Somerville Whitefield Bangalore E- Brochure.pdf
 
Kolte Patil Mirabilis at Horamavu Road, Bangalore E brochure.pdf
Kolte Patil Mirabilis at Horamavu Road, Bangalore E brochure.pdfKolte Patil Mirabilis at Horamavu Road, Bangalore E brochure.pdf
Kolte Patil Mirabilis at Horamavu Road, Bangalore E brochure.pdf
 
Provident Kenworth Rajendra Nagar Hyderabad.pdf
Provident Kenworth Rajendra Nagar Hyderabad.pdfProvident Kenworth Rajendra Nagar Hyderabad.pdf
Provident Kenworth Rajendra Nagar Hyderabad.pdf
 
Experion Elements Sector 45 Noida_Brochure.pdf.pdf
Experion Elements Sector 45 Noida_Brochure.pdf.pdfExperion Elements Sector 45 Noida_Brochure.pdf.pdf
Experion Elements Sector 45 Noida_Brochure.pdf.pdf
 
Clemson Engineering Consultant Dubai For Innovative and Sustainable Engineeri...
Clemson Engineering Consultant Dubai For Innovative and Sustainable Engineeri...Clemson Engineering Consultant Dubai For Innovative and Sustainable Engineeri...
Clemson Engineering Consultant Dubai For Innovative and Sustainable Engineeri...
 
Ganga Fusion 85 Gurugram - PDF Download.pdf
Ganga Fusion 85 Gurugram - PDF Download.pdfGanga Fusion 85 Gurugram - PDF Download.pdf
Ganga Fusion 85 Gurugram - PDF Download.pdf
 
Prestige Sector 94 at Noida E Brochure.pdf
Prestige Sector 94 at Noida E Brochure.pdfPrestige Sector 94 at Noida E Brochure.pdf
Prestige Sector 94 at Noida E Brochure.pdf
 
Listing Turkey - Viva Perla Maltepe Catalog
Listing Turkey - Viva Perla Maltepe CatalogListing Turkey - Viva Perla Maltepe Catalog
Listing Turkey - Viva Perla Maltepe Catalog
 
Kolte Patil Universe Hinjewadi Pune Brochure.pdf
Kolte Patil Universe Hinjewadi Pune Brochure.pdfKolte Patil Universe Hinjewadi Pune Brochure.pdf
Kolte Patil Universe Hinjewadi Pune Brochure.pdf
 
Lancaster Market Expenses and Company Worksheet
Lancaster Market Expenses and Company WorksheetLancaster Market Expenses and Company Worksheet
Lancaster Market Expenses and Company Worksheet
 
Sobha Oakshire Devanhalli Bangalore.pdf.pdf
Sobha Oakshire Devanhalli Bangalore.pdf.pdfSobha Oakshire Devanhalli Bangalore.pdf.pdf
Sobha Oakshire Devanhalli Bangalore.pdf.pdf
 
The Role of Mortgage Brokers in Retirement Housing: Key Considerations
The Role of Mortgage Brokers in Retirement Housing: Key ConsiderationsThe Role of Mortgage Brokers in Retirement Housing: Key Considerations
The Role of Mortgage Brokers in Retirement Housing: Key Considerations
 
Purva Park Hill Kanakapura Road Bangalore.pdf
Purva Park Hill  Kanakapura Road Bangalore.pdfPurva Park Hill  Kanakapura Road Bangalore.pdf
Purva Park Hill Kanakapura Road Bangalore.pdf
 
LCAR Unit 21 - Closing the Real Estate Transaction - 14th Edition Revised
LCAR Unit 21 - Closing the Real Estate Transaction - 14th Edition RevisedLCAR Unit 21 - Closing the Real Estate Transaction - 14th Edition Revised
LCAR Unit 21 - Closing the Real Estate Transaction - 14th Edition Revised
 
Pride Wonderland Dhanori Pune Brochure.pdf
Pride Wonderland Dhanori Pune Brochure.pdfPride Wonderland Dhanori Pune Brochure.pdf
Pride Wonderland Dhanori Pune Brochure.pdf
 
LCAR Unit 20 - Appraising Real Estate - 14th Edition Revised
LCAR Unit 20 - Appraising Real Estate - 14th Edition RevisedLCAR Unit 20 - Appraising Real Estate - 14th Edition Revised
LCAR Unit 20 - Appraising Real Estate - 14th Edition Revised
 
Anandtara Iris Residences Mundhwa Pune Brochure.pdf
Anandtara Iris Residences Mundhwa Pune Brochure.pdfAnandtara Iris Residences Mundhwa Pune Brochure.pdf
Anandtara Iris Residences Mundhwa Pune Brochure.pdf
 

Commercial Real Estate Market Watch for Toronto: September 2012

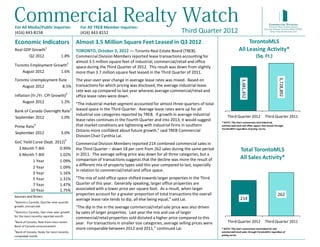
  • 1. For All Media/Public Inquiries: For All TREB Member Inquiries: (416) 443-8158 (416) 443-8152 Third Quarter 2012 Economic Indicators Almost 3.5 Million Square Feet Leased in Q3 2012 TorontoMLS Real GDP Growth 1 TORONTO, October 3, 2012 — Toronto Real Estate Board (TREB) All Leasing Activity* Q2 2012 t 1.8% Commercial Division Members reported lease transactions accounting for (Sq. Ft.) almost 3.5 million square feet of industrial, commercial/retail and office Toronto Employment Growth2 space during the Third Quarter of 2012. This result was down from slightly August 2012 t 1.6% more than 3.7 million square feet leased in the Third Quarter of 2011. 3,728,892 Toronto Unemployment Rate The year-over-year change in average lease rates was mixed. Based on 3,481,452 August 2012 u 8.5% transactions for which pricing was disclosed, the average industrial lease rate was up compared to last year whereas average commercial/retail and Inflation (Yr./Yr. CPI Growth)2 office lease rates were down. August 2012 u 1.2% “The industrial market segment accounted for almost three-quarters of total Bank of Canada Overnight Rate 3 leased space in the Third Quarter. Average lease rates were up for all industrial size categories reported by TREB. If growth in average industrial September 2012 q 1.0% Third Quarter 2012 Third Quarter 2011 lease rates continues in the Fourth Quarter and into 2013, it would suggest * NOTE: This chart summarizes total industrial, Prime Rate 4 that market conditions are tightening with industrial firms in southern commercial/retail and office square feet leased through TorontoMLS regardless of pricing terms. Ontario more confident about future growth,” said TREB Commercial September 2012 q 3.0% Division Chair Cynthia Lai. GoC Yield Curve (Sept. 2012)4 Commercial Division Members reported 214 combined commercial sales in 3 Month T-Bill t 0.99% the Third Quarter – down 18 per cent from 262 sales during the same period Total TorontoMLS 6 Month T-Bill u 1.02% in 2011. The average selling price was down for all three categories, but a comparison of transactions suggests that the decline was more the result of All Sales Activity* 1 Year u 1.09% a different mix of property types sold this year compared to last, especially 2 Year u 1.09% in relation to commercial/retail and office space. 3 Year u 1.16% 5 Year u 1.31% “The mix of sold office space shifted towards larger properties in the Third 7 Year u 1.47% Quarter of this year. Generally speaking, larger office properties are 10 Year u 1.75% associated with a lower price per square foot. As a result, when larger properties account for a greater proportion of total transactions the overall 262 Sources and Notes: 1 average lease rate tends to dip, all else being equal,” said Lai. 214 Statistics Canada, Quarter-over-quarter growth, annualized. “The dip in the in the average commercial/retail sale price was also driven 2 Statistics Canada, Year-over-year growth by sales of larger properties. Last year the mix and use of larger for the most recently reported month commercial/retail properties sold dictated a higher price compared to this 3 Bank of Canada, Rate from most recent year. For transactions in smaller size categories, average selling prices were Third Quarter 2012 Third Quarter 2011 Bank of Canada announcement 4 more comparable between 2012 and 2011,” continued Lai. * NOTE: This chart summarizes total industrial and Bank of Canada, Rates for most recently commercial/retail sales through TorontoMLS regardless of completed month pricing terms.
  • 2. TREB Commercial Division Total TorontoMLS Leasing Activity* TorontoMLS Average Lease Rates ($/Sq.Ft. Net)* (Millions of Square Feet Leased) Third Quarter 2012 Third Quarter 2011 $25.00 4.0 3.73 $20.37 3.48 $20.00 Millions of Square Feet 3.0 2.76 2.56 Third Quarter 2012 $14.36 $15.00 Third Quarter 2011 $10.79 $10.95 2.0 $10.00 $5.05 $4.74 1.0 0.45 0.49 0.47 0.48 $5.00 0.0 $0.00 Total Industrial Commercial/Retail Office Industrial Commercial/Retail Office * NOTE: This chart summarizes total industrial, commercial/retail and office square * NOTE: Average lease rates are reported only for those properties sold on a per feet leased through TorontoMLS regardless of pricing terms. square foot net basis and for which the selling price was disclosed. Source: TREB, Commercial Division Source: TREB, Commercial Division Total TorontoMLS Sales Activity* TorontoMLS Average Sale Price ($/Sq. Ft.)* (Number of Sales) $250.00 $229.64 300 262 Third Quarter 2012 Third Quarter 2012 $189.70 $200.00 250 214 Third Quarter 2011 Third Quarter 2011 $146.05 200 $150.00 $116.11 150 124 101 94 $100.00 $70.18 $78.29 100 74 39 44 $50.00 50 0 $0.00 Total Industrial Commercial/Retail Office Industrial Commercial/Retail Office * NOTE: This chart summarizes total industrial and commercial/retail sales through * NOTE: Average sale prices are reported only for those properties for which the TorontoMLS regardless of pricing terms. selling price was disclosed. Source: TREB, Commercial Division Source: TREB, Commercial Division Commercial Realty Watch, Third Quarter 2012 2
  • 3. TREB Commercial Division SUMMARY OF INDUSTRIAL LEASING ALL TREB AREAS TRANSACTIONS COMPLETED ON A PER SQUARE FOOT NET BASIS, WITH PRICING DISCLOSED* All Transactions 0 to 5,000 Square Feet 5,001 to 15,000 Square Feet 15,001 to 50,000 Square Feet 50,001 + Square Feet # Trans. Sq. Ft. $/SF Net # Trans. Sq. Ft. $/SF Net # Trans. Sq. Ft. $/SF Net # Trans. Sq. Ft. $/SF Net # Trans. Sq. Ft. $/SF Net TREB Total 173 1,339,922 $5.05 118 287,275 $6.16 35 283,240 $5.51 13 379,716 $4.56 7 389,691 $4.36 Halton Region 8 35,236 $5.57 6 15,183 $7.31 2 20,053 $4.26 0 - - 0 - - Burlington 2 7,461 $7.34 2 7,461 $7.34 0 - - 0 - - 0 - - Halton Hills 0 - - 0 - - 0 - - 0 - - 0 - - Milton 0 - - 0 - - 0 - - 0 - - 0 - - Oakville 6 27,775 $5.10 4 7,722 $7.28 2 20,053 $4.26 0 - - 0 - - Peel Region 73 499,298 $5.15 52 135,755 $5.71 13 117,505 $5.56 6 137,698 $4.94 2 108,340 $4.27 Brampton 13 120,621 $4.94 10 19,035 $6.25 0 - - 2 48,465 $4.86 1 53,121 $4.55 Caledon 2 14,561 $5.01 1 1,680 $5.50 1 12,881 $4.95 0 - - 0 - - Mississauga 58 364,116 $5.22 41 115,040 $5.62 12 104,624 $5.63 4 89,233 $4.99 1 55,219 $4.00 City of Toronto 45 393,123 $4.28 32 76,636 $5.53 7 50,828 $4.68 3 84,923 $4.42 3 180,736 $3.58 West 25 237,349 $4.35 16 40,191 $5.92 5 35,479 $4.88 2 56,829 $4.25 2 104,850 $3.63 Central 4 38,281 $4.92 3 10,187 $5.37 0 - - 1 28,094 $4.75 0 - - East 16 117,493 $3.93 13 26,258 $4.99 2 15,349 $4.22 0 - - 1 75,886 $3.50 York Region 45 406,865 $5.62 26 54,301 $7.99 13 94,854 $6.17 4 157,095 $4.31 2 100,615 $5.87 Aurora 2 2,960 $6.12 2 2,960 $6.12 0 - - 0 - - 0 - - E. Gwillimbury 0 - - 0 - - 0 - - 0 - - 0 - - Georgina 0 - - 0 - - 0 - - 0 - - 0 - - King 0 - - 0 - - 0 - - 0 - - 0 - - Markham 15 149,484 $5.61 8 14,980 $9.28 5 34,489 $6.86 1 50,000 $3.00 1 50,015 $6.25 Newmarket 0 - - 0 - - 0 - - 0 - - 0 - - Richmond Hill 1 3,095 $7.70 1 3,095 $7.70 0 - - 0 - - 0 - - Vaughan 26 249,626 $5.58 14 31,566 $7.56 8 60,365 $5.77 3 107,095 $4.92 1 50,600 $5.50 Whitchurch-Stouffville 1 1,700 $8.25 1 1,700 $8.25 0 - - 0 - - 0 - - Durham Region 0 - - 0 - - 0 - - 0 - - 0 - - Ajax 0 - - 0 - - 0 - - 0 - - 0 - - Brock 0 - - 0 - - 0 - - 0 - - 0 - - Clarington 0 - - 0 - - 0 - - 0 - - 0 - - Oshawa 0 - - 0 - - 0 - - 0 - - 0 - - Pickering 0 - - 0 - - 0 - - 0 - - 0 - - Scugog 0 - - 0 - - 0 - - 0 - - 0 - - Uxbridge 0 - - 0 - - 0 - - 0 - - 0 - - Whitby 0 - - 0 - - 0 - - 0 - - 0 - - Dufferin County 2 5,400 $4.93 2 5,400 $4.93 0 - - 0 - - 0 - - Orangeville 2 5,400 $4.93 2 5,400 $4.93 0 - - 0 - - 0 - - Simcoe County 0 - - 0 - - 0 - - 0 - - 0 - - Adjala-Tosorontio 0 - - 0 - - 0 - - 0 - - 0 - - Bradford West Gwillimbury 0 - - 0 - - 0 - - 0 - - 0 - - Essa 0 - - 0 - - 0 - - 0 - - 0 - - Innisfil 0 - - 0 - - 0 - - 0 - - 0 - - New Tecumseth 0 - - 0 - - 0 - - 0 - - 0 - - * NOTE: Figures in this table cover transactions completed on a per square foot net basis and for which pricing was disclosed during the reporting period. This differs from the chart summarizing square feet leased on Page 2 of this report, which covers all leasing transactions in the TREB service area. Commercial Realty Watch, Third Quarter 2012 3
  • 4. TREB Commercial Division SUMMARY OF INDUSTRIAL LEASING CITY OF TORONTO TRANSACTIONS COMPLETED ON A PER SQUARE FOOT NET BASIS, WITH PRICING DISCLOSED All Transactions 0 to 5,000 Square Feet 5,001 to 15,000 Square Feet 15,001 to 50,000 Square Feet 50,001 + Square Feet # Trans. Sq. Ft. $/SF Net # Trans. Sq. Ft. $/SF Net # Trans. Sq. Ft. $/SF Net # Trans. Sq. Ft. $/SF Net # Trans. Sq. Ft. $/SF Net TREB Total 173 1,339,922 $5.05 118 287,275 $6.16 35 283,240 $5.51 13 379,716 $4.56 7 389,691 $4.36 City of Toronto 45 393,123 $4.28 32 76,636 $5.53 7 50,828 $4.68 3 84,923 $4.42 3 180,736 $3.58 Toronto West 25 237,349 $4.35 16 40,191 $5.92 5 35,479 $4.88 2 56,829 $4.25 2 104,850 $3.63 Toronto W01 0 - - 0 - - 0 - - 0 - - 0 - - Toronto W02 0 - - 0 - - 0 - - 0 - - 0 - - Toronto W03 0 - - 0 - - 0 - - 0 - - 0 - - Toronto W04 1 5,375 $8.00 0 - - 1 5,375 $8.00 0 - - 0 - - Toronto W05 12 111,616 $4.34 8 19,231 $5.66 2 19,182 $4.25 1 22,553 $3.50 1 50,650 $4.25 Toronto W06 0 - - 0 - - 0 - - 0 - - 0 - - Toronto W07 0 - - 0 - - 0 - - 0 - - 0 - - Toronto W08 2 8,703 $4.33 1 2,901 $4.50 1 5,802 $4.25 0 - - 0 - - Toronto W09 0 - - 0 - - 0 - - 0 - - 0 - - Toronto W10 10 111,655 $4.19 7 18,059 $6.42 1 5,120 $4.70 1 34,276 $4.75 1 54,200 $3.05 Toronto Central 4 38,281 $4.92 3 10,187 $5.37 0 - - 1 28,094 $4.75 0 - - Toronto C01 0 - - 0 - - 0 - - 0 - - 0 - - Toronto C02 0 - - 0 - - 0 - - 0 - - 0 - - Toronto C03 0 - - 0 - - 0 - - 0 - - 0 - - Toronto C04 0 - - 0 - - 0 - - 0 - - 0 - - Toronto C06 0 - - 0 - - 0 - - 0 - - 0 - - Toronto C07 0 - - 0 - - 0 - - 0 - - 0 - - Toronto C08 0 - - 0 - - 0 - - 0 - - 0 - - Toronto C09 0 - - 0 - - 0 - - 0 - - 0 - - Toronto C10 0 - - 0 - - 0 - - 0 - - 0 - - Toronto C11 1 28,094 $4.75 0 - - 0 - - 1 28,094 $4.75 0 - - Toronto C12 0 - - 0 - - 0 - - 0 - - 0 - - Toronto C13 2 7,780 $5.41 2 7,780 $5.41 0 - - 0 - - 0 - - Toronto C14 0 - - 0 - - 0 - - 0 - - 0 - - Toronto C15 1 2,407 $5.25 1 2,407 $5.25 0 - - 0 - - 0 - - Toronto East 16 117,493 $3.93 13 26,258 $4.99 2 15,349 $4.22 0 - - 1 75,886 $3.50 Toronto E01 0 - - 0 - - 0 - - 0 - - 0 - - Toronto E02 0 - - 0 - - 0 - - 0 - - 0 - - Toronto E03 0 - - 0 - - 0 - - 0 - - 0 - - Toronto E04 3 7,540 $4.75 3 7,540 $4.75 0 - - 0 - - 0 - - Toronto E05 0 - - 0 - - 0 - - 0 - - 0 - - Toronto E06 0 - - 0 - - 0 - - 0 - - 0 - - Toronto E07 6 96,378 $3.71 3 5,143 $5.35 2 15,349 $4.22 0 - - 1 75,886 $3.50 Toronto E08 0 - - 0 - - 0 - - 0 - - 0 - - Toronto E09 3 7,541 $4.60 3 7,541 $4.60 0 - - 0 - - 0 - - Toronto E10 0 - - 0 - - 0 - - 0 - - 0 - - Toronto E11 4 6,034 $5.47 4 6,034 $5.47 0 - - 0 - - 0 - - * NOTE: Figures in this table cover transactions completed on a per square foot net basis and for which pricing was disclosed during the reporting period. This differs from the chart summarizing square feet leased on Page 2 of this report, which covers all leasing transactions in the TREB service area. Commercial Realty Watch, Third Quarter 2012 4
  • 5. TREB Commercial Division SUMMARY OF COMMERCIAL/RETAIL LEASING ALL TREB AREAS TRANSACTIONS COMPLETED ON A PER SQUARE FOOT NET BASIS, WITH PRICING DISCLOSED All Transactions 0 to 1,000 Square Feet 1,001 TO 2,500 Square Feet 2,501 TO 5,000 Square Feet 5,001+ Square Feet # Trans. Sq. Ft. $/SF Net # Trans. Sq. Ft. $/SF Net # Trans. Sq. Ft. $/SF Net # Trans. Sq. Ft. $/SF Net # Trans. Sq. Ft. $/SF Net TREB Total 108 235,105 $14.36 37 28,709 $25.13 55 86,738 $17.01 11 41,651 $14.34 5 78,007 $7.69 Halton Region 8 6,678 $22.53 7 5,607 $22.55 1 1,071 $22.41 0 - - 0 - - Burlington 0 - - 0 - - 0 - - 0 - - 0 - - Halton Hills 3 2,651 $16.75 2 1,580 $12.91 1 1,071 $22.41 0 - - 0 - - Milton 0 - - 0 - - 0 - - 0 - - 0 - - Oakville 5 4,027 $26.33 5 4,027 $26.33 0 - - 0 - - 0 - - Peel Region 13 22,392 $17.35 4 3,162 $24.48 7 11,451 $13.77 2 7,779 $19.72 0 - - Brampton 9 16,216 $18.76 2 1,472 $27.46 5 6,965 $15.84 2 7,779 $19.72 0 - - Caledon 0 - - 0 - - 0 - - 0 - - 0 - - Mississauga 4 6,176 $13.66 2 1,690 $21.89 2 4,486 $10.56 0 - - 0 - - City of Toronto 47 120,096 $15.14 15 12,325 $29.01 23 34,885 $20.47 6 23,718 $16.06 3 49,168 $7.44 West 12 48,704 $8.60 5 4,488 $25.76 6 9,590 $16.27 0 - - 1 34,626 $4.25 Central 19 34,304 $25.86 5 3,717 $41.62 11 16,165 $23.29 2 8,458 $25.86 1 5,964 $23.00 East 16 37,088 $13.82 5 4,120 $21.18 6 9,130 $19.90 4 15,260 $10.62 1 8,578 $9.50 York Region 27 63,280 $11.74 7 4,846 $23.57 17 27,066 $13.97 1 2,529 $6.50 2 28,839 $8.12 Aurora 1 1,497 $22.00 0 - - 1 1,497 $22.00 0 - - 0 - - E. Gwillimbury 0 - - 0 - - 0 - - 0 - - 0 - - Georgina 2 2,422 $13.13 0 - - 2 2,422 $13.13 0 - - 0 - - King 0 - - 0 - - 0 - - 0 - - 0 - - Markham 9 13,088 $14.23 4 2,670 $28.67 4 7,889 $11.83 1 2,529 $6.50 0 - - Newmarket 0 - - 0 - - 0 - - 0 - - 0 - - Richmond Hill 1 568 $22.00 1 568 $22.00 0 - - 0 - - 0 - - Vaughan 13 45,055 $10.48 1 958 $18.79 10 15,258 $14.43 0 - - 2 28,839 $8.12 Whitchurch-Stouffville 1 650 $11.08 1 650 $11.08 0 - - 0 - - 0 - - Durham Region 10 19,793 $12.67 3 2,165 $16.76 5 10,003 $16.77 2 7,625 $6.13 0 - - Ajax 2 3,315 $8.66 1 955 $14.00 1 2,360 $6.50 0 - - 0 - - Brock 0 - - 0 - - 0 - - 0 - - 0 - - Clarington 1 2,370 $11.00 0 - - 1 2,370 $11.00 0 - - 0 - - Oshawa 1 1,773 $21.32 0 - - 1 1,773 $21.32 0 - - 0 - - Pickering 0 - - 0 - - 0 - - 0 - - 0 - - Scugog 2 4,035 $9.04 1 810 $17.19 0 - - 1 3,225 $7.00 0 - - Uxbridge 0 - - 0 - - 0 - - 0 - - 0 - - Whitby 4 8,300 $14.66 1 400 $22.50 2 3,500 $25.29 1 4,400 $5.50 0 - - Dufferin County 1 1,200 $0.00 0 - - 1 1,200 $16.00 0 - - 0 - - Orangeville 1 1,200 $0.00 0 - - 1 1,200 $16.00 0 - - 0 - - Simcoe County 2 1,666 $14.41 1 604 $15.89 1 1,062 $13.56 0 - - 0 - - Adjala-Tosorontio 0 - - 0 - - 0 - - 0 - - 0 - - Bradford West Gwillimbury 0 - - 0 - - 0 - - 0 - - 0 - - Essa 0 - - 0 - - 0 - - 0 - - 0 - - Innisfil 0 - - 0 - - 0 - - 0 - - 0 - - New Tecumseth 2 1,666 $14.41 1 604 $15.89 1 1,062 $13.56 0 - - 0 - - * NOTE: Figures in this table cover transactions completed on a per square foot net basis and for which pricing was disclosed during the reporting period. This differs from the chart summarizing square feet leased on Page 2 of this report, which covers all leasing transactions in the TREB service area. Commercial Realty Watch, Third Quarter 2012 5
  • 6. TREB Commercial Division SUMMARY OF COMMERCIAL LEASING CITY OF TORONTO TRANSACTIONS COMPLETED ON A PER SQUARE FOOT NET BASIS, WITH PRICING DISCLOSED All Transactions 0 to 1,000 Square Feet 1,001 TO 2,500 Square Feet 2,501 TO 5,000 Square Feet 5,001+ Square Feet # Trans. Sq. Ft. $/SF Net # Trans. Sq. Ft. $/SF Net # Trans. Sq. Ft. $/SF Net # Trans. Sq. Ft. $/SF Net # Trans. Sq. Ft. $/SF Net TREB Total 108 235,105 $14.36 37 28,709 $25.13 55 86,738 $17.01 11 41,651 $14.34 5 78,007 $7.69 City of Toronto 47 120,096 $15.14 15 12,325 $29.01 23 34,885 $20.47 6 23,718 $16.06 3 49,168 $7.44 Toronto West 12 48,704 $8.60 5 4,488 $25.76 6 9,590 $16.27 0 - - 1 34,626 $4.25 Toronto W01 0 - - 0 - - 0 - - 0 - - 0 - - Toronto W02 3 4,027 $16.84 1 987 $23.71 2 3,040 $14.61 0 - - 0 - - Toronto W03 1 1,000 $19.20 1 1,000 $19.20 0 - - 0 - - 0 - - Toronto W04 1 34,626 $4.25 0 - - 0 - - 0 - - 1 34,626 $4.25 Toronto W05 2 1,910 $16.02 1 850 $14.12 1 1,060 $17.55 0 - - 0 - - Toronto W06 1 1,400 $20.57 0 - - 1 1,400 $20.57 0 - - 0 - - Toronto W07 1 755 $55.63 1 755 $55.63 0 - - 0 - - 0 - - Toronto W08 2 2,496 $22.36 1 896 $21.21 1 1,600 $23.00 0 - - 0 - - Toronto W09 1 2,490 $11.00 0 - - 1 2,490 $11.00 0 - - 0 - - Toronto W10 0 - - 0 - - 0 - - 0 - - 0 - - Toronto Central 19 34,304 $25.86 5 3,717 $41.62 11 16,165 $23.29 2 8,458 $25.86 1 5,964 $23.00 Toronto C01 6 13,068 $29.64 1 450 $45.47 3 4,160 $35.63 2 8,458 $25.86 0 - - Toronto C02 4 9,098 $26.73 1 875 $35.66 2 2,259 $33.13 0 - - 1 5,964 $23.00 Toronto C03 4 7,189 $13.53 0 - - 4 7,189 $13.53 0 - - 0 - - Toronto C04 1 1,000 $48.00 1 1,000 $48.00 0 - - 0 - - 0 - - Toronto C06 1 1,357 $15.48 0 - - 1 1,357 $15.48 0 - - 0 - - Toronto C07 1 1,200 $29.37 0 - - 1 1,200 $29.37 0 - - 0 - - Toronto C08 0 - - 0 - - 0 - - 0 - - 0 - - Toronto C09 0 - - 0 - - 0 - - 0 - - 0 - - Toronto C10 0 - - 0 - - 0 - - 0 - - 0 - - Toronto C11 1 955 $30.00 1 955 $30.00 0 - - 0 - - 0 - - Toronto C12 0 - - 0 - - 0 - - 0 - - 0 - - Toronto C13 0 - - 0 - - 0 - - 0 - - 0 - - Toronto C14 1 437 $60.41 1 437 $60.41 0 - - 0 - - 0 - - Toronto C15 0 - - 0 - - 0 - - 0 - - 0 - - Toronto East 16 37,088 $13.82 5 4,120 $21.18 6 9,130 $19.90 4 15,260 $10.62 1 8,578 $9.50 Toronto E01 1 1,300 $30.00 0 - - 1 1,300 $30.00 0 - - 0 - - Toronto E02 4 5,330 $28.79 2 1,200 $38.38 2 4,130 $26.00 0 - - 0 - - Toronto E03 2 4,370 $15.19 1 1,000 $22.20 0 - - 1 3,370 $13.11 0 - - Toronto E04 4 18,142 $9.64 1 986 $12.00 0 - - 2 8,578 $9.50 1 8,578 $9.50 Toronto E05 0 - - 0 - - 0 - - 0 - - 0 - - Toronto E06 0 - - 0 - - 0 - - 0 - - 0 - - Toronto E07 1 934 $7.71 1 934 $7.71 0 - - 0 - - 0 - - Toronto E08 0 - - 0 - - 0 - - 0 - - 0 - - Toronto E09 2 2,420 $9.30 0 - - 2 2,420 $9.30 0 - - 0 - - Toronto E10 1 1,280 $10.00 0 - - 1 1,280 $10.00 0 - - 0 - - Toronto E11 1 3,312 $11.00 0 - - 0 - - 1 3,312 $11.00 0 - - * NOTE: Figures in this table cover transactions completed on a per square foot net basis and for which pricing was disclosed during the reporting period. This differs from the chart summarizing square feet leased on Page 2 of this report, which covers all leasing transactions in the TREB service area. Commercial Realty Watch, Third Quarter 2012 6
  • 7. TREB Commercial Division SUMMARY OF OFFICE LEASING ALL TREB AREAS TRANSACTIONS COMPLETED ON A PER SQUARE FOOT NET BASIS, WITH PRICING DISCLOSED All Transactions 0 to 1,000 Square Feet 1,001 TO 2,500 Square Feet 2,501 TO 5,000 Square Feet 5,001+ Square Feet # Trans. Sq. Ft. $/SF Net # Trans. Sq. Ft. $/SF Net # Trans. Sq. Ft. $/SF Net # Trans. Sq. Ft. $/SF Net # Trans. Sq. Ft. $/SF Net TREB Total 109 300,511 $10.79 51 32,748 $14.52 33 53,242 $12.05 16 54,155 $10.83 9 160,366 $9.59 Halton Region 11 16,878 $13.83 4 1,312 $13.41 4 5,840 $11.90 3 9,726 $15.05 0 - - Burlington 2 5,481 $11.99 0 - - 0 - - 2 5,481 $11.99 0 - - Halton Hills 5 3,712 $11.85 4 1,312 $13.41 1 2,400 $11.00 0 - - 0 - - Milton 1 1,168 $12.00 0 - - 1 1,168 $12.00 0 - - 0 - - Oakville 3 6,517 $16.83 0 - - 2 2,272 $12.79 1 4,245 $19.00 0 - - Peel Region 24 37,950 $9.38 10 6,330 $9.99 10 18,246 $10.36 4 13,374 $7.75 0 - - Brampton 4 2,998 $8.80 3 1,731 $8.66 1 1,267 $9.00 0 - - 0 - - Caledon 0 - - 0 - - 0 - - 0 - - 0 - - Mississauga 20 34,952 $9.43 7 4,599 $10.50 9 16,979 $10.46 4 13,374 $7.75 0 - - City of Toronto 37 148,406 $10.91 24 14,834 $18.12 6 9,214 $18.52 4 14,307 $13.38 3 110,051 $8.97 West 15 115,022 $9.11 10 6,981 $12.97 1 1,373 $11.36 2 5,877 $17.39 2 100,791 $8.33 Central 16 29,582 $16.85 9 5,251 $24.51 4 6,641 $19.92 2 8,430 $10.59 1 9,260 $16.00 East 6 3,802 $19.02 5 2,602 $19.03 1 1,200 $19.00 0 - - 0 - - York Region 35 91,866 $10.94 13 10,272 $12.26 12 18,693 $10.70 4 12,586 $10.30 6 50,315 $10.93 Aurora 2 4,060 $11.29 0 - - 2 4,060 $11.29 0 - - 0 - - E. Gwillimbury 0 - - 0 - - 0 - - 0 - - 0 - - Georgina 0 - - 0 - - 0 - - 0 - - 0 - - King 0 - - 0 - - 0 - - 0 - - 0 - - Markham 13 40,005 $9.36 4 3,065 $10.71 3 4,310 $9.41 3 9,505 $10.80 3 23,125 $8.58 Newmarket 1 8,591 $10.00 0 - - 0 - - 0 - - 1 8,591 $10.00 Richmond Hill 10 11,610 $10.50 5 4,109 $10.78 5 7,501 $10.34 0 - - 0 - - Vaughan 9 27,600 $13.67 4 3,098 $15.75 2 2,822 $12.76 1 3,081 $8.75 2 18,599 $14.28 Whitchurch-Stouffville 0 - - 0 - - 0 - - 0 - - 0 - - Durham Region 2 5,411 $5.19 0 - - 1 1,249 $10.00 1 4,162 $3.75 0 - - Ajax 1 1,249 $10.00 0 - - 1 1,249 $10.00 0 - - 0 - - Brock 0 - - 0 - - 0 - - 0 - - 0 - - Clarington 0 - - 0 - - 0 - - 0 - - 0 - - Oshawa 0 - - 0 - - 0 - - 0 - - 0 - - Pickering 1 4,162 $3.75 0 - - 0 - - 1 4,162 $3.75 0 - - Scugog 0 - - 0 - - 0 - - 0 - - 0 - - Uxbridge 0 - - 0 - - 0 - - 0 - - 0 - - Whitby 0 - - 0 - - 0 - - 0 - - 0 - - Dufferin County 0 - - 0 - - 0 - - 0 - - 0 - - Orangeville 0 - - 0 - - 0 - - 0 - - 0 - - Simcoe County 0 - - 0 - - 0 - - 0 - - 0 - - Adjala-Tosorontio 0 - - 0 - - 0 - - 0 - - 0 - - Bradford West Gwillimbury 0 - - 0 - - 0 - - 0 - - 0 - - Essa 0 - - 0 - - 0 - - 0 - - 0 - - Innisfil 0 - - 0 - - 0 - - 0 - - 0 - - New Tecumseth 0 - - 0 - - 0 - - 0 - - 0 - - * NOTE: Figures in this table cover transactions completed on a per square foot net basis and for which pricing was disclosed during the reporting period. This differs from the chart summarizing square feet leased on Page 2 of this report, which covers all leasing transactions in the TREB service area. Commercial Realty Watch, Third Quarter 2012 7
  • 8. TREB Commercial Division SUMMARY OF OFFICE LEASING CITY OF TORONTO TRANSACTIONS COMPLETED ON A PER SQUARE FOOT NET BASIS, WITH PRICING DISCLOSED All Transactions 0 to 1,000 Square Feet 1,001 TO 2,500 Square Feet 2,501 TO 5,000 Square Feet 5,001+ Square Feet # Trans. Sq. Ft. $/SF Net # Trans. Sq. Ft. $/SF Net # Trans. Sq. Ft. $/SF Net # Trans. Sq. Ft. $/SF Net # Trans. Sq. Ft. $/SF Net TREB Total 109 300,511 $10.79 51 32,748 $14.52 33 53,242 $12.05 16 54,155 $10.83 9 160,366 $9.59 City of Toronto 37 148,406 $10.91 24 14,834 $18.12 6 9,214 $18.52 4 14,307 $13.38 3 110,051 $8.97 Toronto West 15 115,022 $9.11 10 6,981 $12.97 1 1,373 $11.36 2 5,877 $17.39 2 100,791 $8.33 Toronto W01 1 2,677 $26.22 0 - - 0 - - 1 2,677 $26.22 0 - - Toronto W02 0 - - 0 - - 0 - - 0 - - 0 - - Toronto W03 1 400 $13.50 1 400 $13.50 0 - - 0 - - 0 - - Toronto W04 4 2,888 $11.49 4 2,888 $11.49 0 - - 0 - - 0 - - Toronto W05 6 16,172 $5.81 4 3,008 $13.29 1 1,373 $11.36 0 - - 1 11,791 $3.25 Toronto W06 1 685 $17.52 1 685 $17.52 0 - - 0 - - 0 - - Toronto W07 0 - - 0 - - 0 - - 0 - - 0 - - Toronto W08 2 92,200 $9.03 0 - - 0 - - 1 3,200 $10.00 1 89,000 $9.00 Toronto W09 0 - - 0 - - 0 - - 0 - - 0 - - Toronto W10 0 - - 0 - - 0 - - 0 - - 0 - - Toronto Central 16 29,582 $16.85 9 5,251 $24.51 4 6,641 $19.92 2 8,430 $10.59 1 9,260 $16.00 Toronto C01 3 2,420 $29.26 2 770 $46.75 1 1,650 $21.09 0 - - 0 - - Toronto C02 4 16,316 $17.65 1 557 $29.08 1 1,869 $26.50 1 4,630 $16.00 1 9,260 $16.00 Toronto C03 0 - - 0 - - 0 - - 0 - - 0 - - Toronto C04 0 - - 0 - - 0 - - 0 - - 0 - - Toronto C06 0 - - 0 - - 0 - - 0 - - 0 - - Toronto C07 2 2,195 $19.68 1 500 $27.60 1 1,695 $17.35 0 - - 0 - - Toronto C08 0 - - 0 - - 0 - - 0 - - 0 - - Toronto C09 0 - - 0 - - 0 - - 0 - - 0 - - Toronto C10 1 900 $16.67 1 900 $16.67 0 - - 0 - - 0 - - Toronto C11 0 - - 0 - - 0 - - 0 - - 0 - - Toronto C12 0 - - 0 - - 0 - - 0 - - 0 - - Toronto C13 1 1,427 $13.00 0 - - 1 1,427 $13.00 0 - - 0 - - Toronto C14 2 1,081 $29.67 2 1,081 $29.67 0 - - 0 - - 0 - - Toronto C15 3 5,243 $5.87 2 1,443 $10.81 0 - - 1 3,800 $4.00 0 - - Toronto East 6 3,802 $19.02 5 2,602 $19.03 1 1,200 $19.00 0 - - 0 - - Toronto E01 1 1,200 $19.00 0 - - 1 1,200 $19.00 0 - - 0 - - Toronto E02 0 - - 0 - - 0 - - 0 - - 0 - - Toronto E03 2 1,522 $22.86 2 1,522 $22.86 0 - - 0 - - 0 - - Toronto E04 1 550 $5.50 1 550 $5.50 0 - - 0 - - 0 - - Toronto E05 0 - - 0 - - 0 - - 0 - - 0 - - Toronto E06 0 - - 0 - - 0 - - 0 - - 0 - - Toronto E07 1 250 $24.00 1 250 $24.00 0 - - 0 - - 0 - - Toronto E08 0 - - 0 - - 0 - - 0 - - 0 - - Toronto E09 1 280 $20.36 1 280 $20.36 0 - - 0 - - 0 - - Toronto E10 0 - - 0 - - 0 - - 0 - - 0 - - Toronto E11 0 - - 0 - - 0 - - 0 - - 0 - - * NOTE: Figures in this table cover transactions completed on a per square foot net basis and for which pricing was disclosed during the reporting period. This differs from the chart summarizing square feet leased on Page 2 of this report, which covers all leasing transactions in the TREB service area. Commercial Realty Watch, Third Quarter 2012 8
  • 9. TREB Commercial Division SUMMARY OF INDUSTRIAL SALES ALL TREB AREAS TRANSACTIONS COMPLETED WITH PRICING DISCLOSED All Transactions 0 to 5,000 Square Feet 5,001 to 15,000 Square Feet 15,001 to 50,000 Square Feet 50,001 + Square Feet # Trans. Sq. Ft. $/SF # Trans. Sq. Ft. $/SF # Trans. Sq. Ft. $/SF # Trans. Sq. Ft. $/SF # Trans. Sq. Ft. $/SF TREB Total 101 1,907,356 $70.18 54 105,651 $156.13 17 148,482 $110.36 19 509,769 $101.86 11 1,143,454 $43.14 Halton Region 3 97,496 $75.75 1 1,260 $206.35 0 - - 1 24,270 $122.58 1 71,966 $57.67 Burlington 0 - - 0 - - 0 - - 0 - - 0 - - Halton Hills 0 - - 0 - - 0 - - 0 - - 0 - - Milton 0 - - 0 - - 0 - - 0 - - 0 - - Oakville 3 97,496 $75.75 1 1,260 $206.35 0 - - 1 24,270 $122.58 1 71,966 $57.67 Peel Region 25 433,023 $108.75 13 28,151 $159.76 3 31,527 $111.81 7 227,918 $117.67 2 145,427 $84.21 Brampton 9 189,379 $89.50 6 9,024 $166.48 0 - - 1 34,928 $91.62 2 145,427 $84.21 Caledon 1 11,200 $80.36 0 - - 1 11,200 $80.36 0 - - 0 - - Mississauga 15 232,444 $125.79 7 19,127 $156.58 2 20,327 $129.14 6 192,990 $122.39 0 - - City of Toronto 33 887,266 $59.15 13 27,303 $142.12 9 64,718 $116.61 6 129,008 $91.93 5 666,237 $43.82 West 15 433,830 $70.03 2 6,000 $160.00 6 43,855 $125.16 4 91,688 $91.12 3 292,287 $53.29 Central 0 - - 0 - - 0 - - 0 - - 0 - - East 18 453,436 $48.75 11 21,303 $137.09 3 20,863 $98.64 2 37,320 $93.92 2 373,950 $36.43 York Region 26 130,200 $136.43 21 40,005 $170.83 2 19,448 $140.12 3 70,747 $115.96 0 - - Aurora 5 37,665 $104.08 4 7,388 $170.55 0 - - 1 30,277 $87.86 0 - - E. Gwillimbury 0 - - 0 - - 0 - - 0 - - 0 - - Georgina 0 - - 0 - - 0 - - 0 - - 0 - - King 0 - - 0 - - 0 - - 0 - - 0 - - Markham 5 8,365 $166.89 5 8,365 $166.89 0 - - 0 - - 0 - - Newmarket 2 3,467 $175.94 2 3,467 $175.94 0 - - 0 - - 0 - - Richmond Hill 3 6,285 $194.91 3 6,285 $194.91 0 - - 0 - - 0 - - Vaughan 11 74,418 $142.60 7 14,500 $161.59 2 19,448 $140.12 2 40,470 $136.98 0 - - Whitchurch-Stouffville 0 - - 0 - - 0 - - 0 - - 0 - - Durham Region 12 320,265 $27.39 5 7,032 $106.44 3 32,789 $78.99 1 20,620 $82.44 3 259,824 $14.38 Ajax 1 20,620 $82.44 0 - - 0 - - 1 20,620 $82.44 0 - - Brock 1 12,387 $77.90 0 - - 1 12,387 $77.90 0 - - 0 - - Clarington 1 1,495 $105.69 1 1,495 $105.69 0 - - 0 - - 0 - - Oshawa 2 6,877 $85.79 1 1,475 $111.86 1 5,402 $78.67 0 - - 0 - - Pickering 1 942 $87.58 1 942 $87.58 0 - - 0 - - 0 - - Scugog 2 200,376 $7.59 0 - - 0 - - 0 - - 2 200,376 $7.59 Uxbridge 0 - - 0 - - 0 - - 0 - - 0 - - Whitby 4 77,568 $48.45 2 3,120 $109.94 1 15,000 $80.00 0 - - 1 59,448 $37.26 Dufferin County 1 1,900 $0.00 1 1,900 $144.74 0 - - 0 - - 0 - - Orangeville 1 1,900 $0.00 1 1,900 $144.74 0 - - 0 - - 0 - - Simcoe County 1 37,206 $9.86 0 - - 0 - - 1 37,206 $9.86 0 - - Adjala-Tosorontio 0 - - 0 - - 0 - - 0 - - 0 - - Bradford West Gwillimbury 0 - - 0 - - 0 - - 0 - - 0 - - Essa 0 - - 0 - - 0 - - 0 - - 0 - - Innisfil 0 - - 0 - - 0 - - 0 - - 0 - - New Tecumseth 1 37,206 $9.86 0 - - 0 - - 1 37,206 $9.86 0 - - * NOTE: Figures in this table cover transactions for which pricing was disclosed during the reporting period. This differs from the chart summarizing sales on Page 2 of this report, which covers all sale transactions in the TREB service area. Commercial Realty Watch, Third Quarter 2012 9
  • 10. TREB Commercial Division SUMMARY OF INDUSTRIAL SALES - CONDOMINIUM BREAKOUT ALL TREB AREAS TRANSACTIONS COMPLETED WITH PRICING DISCLOSED All Transactions 0 to 5,000 Square Feet 5,001 to 15,000 Square Feet 15,001 to 50,000 Square Feet 50,001 + Square Feet # Trans. Sq. Ft. $/SF # Trans. Sq. Ft. $/SF # Trans. Sq. Ft. $/SF # Trans. Sq. Ft. $/SF # Trans. Sq. Ft. $/SF TREB Total 47 103,752 $139.08 43 77,524 $149.89 4 26,228 $117.62 0 - - 0 - - Halton Region 1 1,260 $206.35 1 1,260 $206.35 0 - - 0 - - 0 - - Burlington 0 - - 0 - - 0 - - 0 - - 0 - - Halton Hills 0 - - 0 - - 0 - - 0 - - 0 - - Milton 0 - - 0 - - 0 - - 0 - - 0 - - Oakville 1 1,260 $206.35 1 1,260 $206.35 0 - - 0 - - 0 - - Peel Region 8 13,937 $156.63 8 13,937 $156.63 0 - - 0 - - 0 - - Brampton 4 5,566 $150.90 4 5,566 $150.90 0 - - 0 - - 0 - - Caledon 0 - - 0 - - 0 - - 0 - - 0 - - Mississauga 4 8,371 $160.43 4 8,371 $160.43 0 - - 0 - - 0 - - City of Toronto 14 42,701 $115.56 11 22,203 $113.70 3 20,498 $117.57 0 - - 0 - - West 3 17,450 $115.19 1 3,000 $101.67 2 14,450 $117.99 0 - - 0 - - Central 0 - - 0 - - 0 - - 0 - - 0 - - East 11 25,251 $115.81 10 19,203 $115.58 1 6,048 $116.57 0 - - 0 - - York Region 19 38,722 $167.97 18 32,992 $176.68 1 5,730 $117.80 0 - - 0 - - Aurora 4 7,388 $170.55 4 7,388 $170.55 0 - - 0 - - 0 - - E. Gwillimbury 0 - - 0 - - 0 - - 0 - - 0 - - Georgina 0 - - 0 - - 0 - - 0 - - 0 - - King 0 - - 0 - - 0 - - 0 - - 0 - - Markham 5 8,365 $166.89 5 8,365 $166.89 0 - - 0 - - 0 - - Newmarket 2 3,467 $175.94 2 3,467 $175.94 0 - - 0 - - 0 - - Richmond Hill 2 4,600 $196.74 2 4,600 $196.74 0 - - 0 - - 0 - - Vaughan 6 14,902 $156.56 5 9,172 $180.77 1 5,730 $117.80 0 - - 0 - - Whitchurch-Stouffville 0 - - 0 - - 0 - - 0 - - 0 - - Durham Region 4 5,232 $104.84 4 5,232 $104.84 0 - - 0 - - 0 - - Ajax 0 - - 0 - - 0 - - 0 - - 0 - - Brock 0 - - 0 - - 0 - - 0 - - 0 - - Clarington 1 1,495 $105.69 1 1,495 $105.69 0 - - 0 - - 0 - - Oshawa 1 1,475 $111.86 1 1,475 $111.86 0 - - 0 - - 0 - - Pickering 1 942 $87.58 1 942 $87.58 0 - - 0 - - 0 - - Scugog 0 - - 0 - - 0 - - 0 - - 0 - - Uxbridge 0 - - 0 - - 0 - - 0 - - 0 - - Whitby 1 1,320 $108.33 1 1,320 $108.33 0 - - 0 - - 0 - - Dufferin County 1 1,900 $0.00 1 1,900 $144.74 0 - - 0 - - 0 - - Orangeville 1 1,900 $0.00 1 1,900 $144.74 0 - - 0 - - 0 - - Simcoe County 0 - - 0 - - 0 - - 0 - - 0 - - Adjala-Tosorontio 0 - - 0 - - 0 - - 0 - - 0 - - Bradford West Gwillimbury 0 - - 0 - - 0 - - 0 - - 0 - - Essa 0 - - 0 - - 0 - - 0 - - 0 - - Innisfil 0 - - 0 - - 0 - - 0 - - 0 - - New Tecumseth 0 - - 0 - - 0 - - 0 - - 0 - - * NOTE: Figures in this table cover transactions for which pricing was disclosed during the reporting period. This differs from the chart summarizing sales on Page 2 of this report, which covers all sale transactions in the TREB service area. Commercial Realty Watch, Third Quarter 2012 10
  • 11. TREB Commercial Division SUMMARY OF INDUSTRIAL SALES - OTHER TYPES BREAKOUT ALL TREB AREAS TRANSACTIONS COMPLETED WITH PRICING DISCLOSED All Transactions 0 to 5,000 Square Feet 5,001 to 15,000 Square Feet 15,001 to 50,000 Square Feet 50,001 + Square Feet # Trans. Sq. Ft. $/SF # Trans. Sq. Ft. $/SF # Trans. Sq. Ft. $/SF # Trans. Sq. Ft. $/SF # Trans. Sq. Ft. $/SF TREB Total 54 1,803,604 $66.22 11 28,127 $173.34 13 122,254 $108.81 19 509,769 $101.86 11 1,143,454 $43.14 Halton Region 2 96,236 $74.04 0 - - 0 - - 1 24,270 $122.58 1 71,966 $57.67 Burlington 0 - - 0 - - 0 - - 0 - - 0 - - Halton Hills 0 - - 0 - - 0 - - 0 - - 0 - - Milton 0 - - 0 - - 0 - - 0 - - 0 - - Oakville 2 96,236 $74.04 0 - - 0 - - 1 24,270 $122.58 1 71,966 $57.67 Peel Region 17 419,086 $107.15 5 14,214 $162.83 3 31,527 $111.81 7 227,918 $117.67 2 145,427 $84.21 Brampton 5 183,813 $87.64 2 3,458 $191.57 0 - - 1 34,928 $91.62 2 145,427 $84.21 Caledon 1 11,200 $80.36 0 - - 1 11,200 $80.36 0 - - 0 - - Mississauga 11 224,073 $124.50 3 10,756 $153.59 2 20,327 $129.14 6 192,990 $122.39 0 - - City of Toronto 19 844,565 $56.30 2 5,100 $265.88 6 44,220 $116.17 6 129,008 $91.93 5 666,237 $43.82 West 12 416,380 $68.13 1 3,000 $218.33 4 29,405 $128.69 4 91,688 $91.12 3 292,287 $53.29 Central 0 - - 0 - - 0 - - 0 - - 0 - - East 7 428,185 $44.80 1 2,100 $333.81 2 14,815 $91.33 2 37,320 $93.92 2 373,950 $36.43 York Region 7 91,478 $123.07 3 7,013 $143.31 1 13,718 $149.44 3 70,747 $115.96 0 - - Aurora 1 30,277 $87.86 0 - - 0 - - 1 30,277 $87.86 0 - - E. Gwillimbury 0 - - 0 - - 0 - - 0 - - 0 - - Georgina 0 - - 0 - - 0 - - 0 - - 0 - - King 0 - - 0 - - 0 - - 0 - - 0 - - Markham 0 - - 0 - - 0 - - 0 - - 0 - - Newmarket 0 - - 0 - - 0 - - 0 - - 0 - - Richmond Hill 1 1,685 $189.91 1 1,685 $189.91 0 - - 0 - - 0 - - Vaughan 5 59,516 $139.10 2 5,328 $128.57 1 13,718 $149.44 2 40,470 $136.98 0 - - Whitchurch-Stouffville 0 - - 0 - - 0 - - 0 - - 0 - - Durham Region 8 315,033 $26.11 1 1,800 $111.11 3 32,789 $78.99 1 20,620 $82.44 3 259,824 $14.38 Ajax 1 20,620 $82.44 0 - - 0 - - 1 20,620 $82.44 0 - - Brock 1 12,387 $77.90 0 - - 1 12,387 $77.90 0 - - 0 - - Clarington 0 - - 0 - - 0 - - 0 - - 0 - - Oshawa 1 5,402 $78.67 0 - - 1 5,402 $78.67 0 - - 0 - - Pickering 0 - - 0 - - 0 - - 0 - - 0 - - Scugog 2 200,376 $7.59 0 - - 0 - - 0 - - 2 200,376 $7.59 Uxbridge 0 - - 0 - - 0 - - 0 - - 0 - - Whitby 3 76,248 $47.41 1 1,800 $111.11 1 15,000 $80.00 0 - - 1 59,448 $37.26 Dufferin County 0 - - 0 - - 0 - - 0 - - 0 - - Orangeville 0 - - 0 - - 0 - - 0 - - 0 - - Simcoe County 1 37,206 $9.86 0 - - 0 - - 1 37,206 $9.86 0 - - Adjala-Tosorontio 0 - - 0 - - 0 - - 0 - - 0 - - Bradford West Gwillimbury 0 - - 0 - - 0 - - 0 - - 0 - - Essa 0 - - 0 - - 0 - - 0 - - 0 - - Innisfil 0 - - 0 - - 0 - - 0 - - 0 - - New Tecumseth 1 37,206 $9.86 0 - - 0 - - 1 37,206 $9.86 0 - - * NOTE: Figures in this table cover transactions for which pricing was disclosed during the reporting period. This differs from the chart summarizing sales on Page 2 of this report, which covers all sale transactions in the TREB service area. Commercial Realty Watch, Third Quarter 2012 11