
Empfohlen
Empfohlen
Weitere ähnliche Inhalte
Was ist angesagt?
Was ist angesagt? (20)
Andere mochten auch
Andere mochten auch (13)
Ähnlich wie 2008-06-08 HTAP Aerosol Science Review
Ähnlich wie 2008-06-08 HTAP Aerosol Science Review (20)
Mehr von Rudolf Husar
Mehr von Rudolf Husar (20)
Kürzlich hochgeladen
Kürzlich hochgeladen (20)
2008-06-08 HTAP Aerosol Science Review
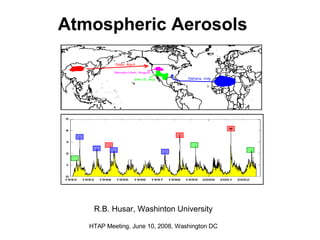
- 1. Atmospheric Aerosols R.B. Husar, Washinton University HTAP Meeting, June 10, 2008, Washington DC
- 2. Dimensions of Gaseous Pollutants: X, Y, Z, T Dimensions of Aerosols: Particle Size, Composition, Shape
- 4. Phase II HTAP Goal: Integration of Emissions, Models and Observations
- 5. Aerosols are Indicators of Many Earth System Processes Including Human-induced Perturbations Volcanoes Dust storms Fires Anthropogenic Pollution EPA NAAQS PM2.5, O3 Exceptional Event Rule Exclusion of data when it is strongly influenced by “exceptional events" (EE), such as smoke from wildfires or windblown dust or LRTP.
- 8. Continental Surface Visibility (7000+ Human Observers) Low Visibility High Visibility
- 9. Continental Surface Extinction Coefficient Climatology Dec, Jan, Feb Jun, Jul, Aug Sep, Oct, Nov Mar, Apr, May India Husar et al, 2000
- 12. Everglades, FL Big Bend, TX G. Smoky Mtn. Sahara Dust - July Mex. Smoke-May
- 13. Emission: Green Modeling: Green Observations: Green
- 14. Emission: Yellow Modeling: Yellow Observations: Yellow
- 16. Central American Smoke Plume Surface PM2.5 Ozone
- 17. Kansas Agricultural Smoke, April 12, 2003 Fire Pixels Organics 35 ug/m3 max Ag Fires SeaWiFS, Refl Smoke Emission April 11: 87 T/day April 10: 1240 T/d Assuming Mass Extinction Efficiency: 5 m 2 /g
- 18. Emission: Red Modeling: Yellow Observations: Yellow
- 19. Aerosol Nitrate Anomaly – Every 3 Days
- 20. Seasonal PM25 by Region Sulfate-driven Jul-Aug peak Feb-Mar peak, of unknown origin
- 22. Origin of Fine Dust Events over the US Gobi dust in spring Sahara in summer Fine dust events over the US are mainly from intercontinental transport
- 24. Supporting Evidence: Transport Analysis Satellite data (e.g. SeaWiFS) show Sahara Dust reaching Gulf of Mexico and entering the continent. The air masses arrive to Big Bend, TX form the east (July) and from the west (April)
- 25. Sahara PM Events over the Eastern US PM10 July 5, 1992 PM10 June 21, 1997 PM10 June 30 1993 Sahara Dust Sahara Dust TOMS, July Aerosol Index
- 26. Asian Dust Cloud over N. America On April 27, the dust cloud arrived in North America. Regional average PM10 concentrations increased to 65 g/m 3 In Washington State, PM10 concentrations exceeded 100 g/m 3 Asian Dust 100 g/m 3 Hourly PM10
- 27. ~50% of the variability in springtime PM 2.5 in the Western U.S. can be explained by changes in Asian dust (Fischer et al., 2008)
- 28. EPISODIC EPISODIC EPISODIC … episodic emissions require emission-observation-model integration…