Building Cox's Bazar as a Brand
•
5 gefällt mir•2,398 views

Prepared this under Marketing Research Course of MBA Program. The report is divided into 5 parts. For your convenience the content of the part 1 are as follows- 1.1 Background of the problem 1.2 Problem statement 1.3 Objective 1.4 Problem Variables 1.5 Approach to the problem 1.6 Conceptual Framework 1.7 Research Question 1.8 Hypotheses 1.9 Analytical Model and thus goes the other 4 parts of the report...

Empfohlen
Weitere ähnliche Inhalte
Was ist angesagt?
Was ist angesagt? (20)
Andere mochten auch
Andere mochten auch (13)
Ähnlich wie Building Cox's Bazar as a Brand
Ähnlich wie Building Cox's Bazar as a Brand (20)
Kürzlich hochgeladen
Kürzlich hochgeladen (20)
Building Cox's Bazar as a Brand
- 1. 1.1 Background of the problem People are now very busy around the world. They have very little time to spend on amusement. So they want to go in a place where they can find every possible thing for amusement. Traveling is good refreshment in crowded life. People wants to feel relax. They want to feel fun and want to enjoy some time from their busy life with their families. Sea beaches around the world providing one of the best way to amuse the tourists. Tourists feel calm and peaceful in the sea beaches. Cox‟s Bazar is the product that able to provide every enjoyment, refreshment, calm, and enchanted feeling to everyone. Around the world there are so many sea beaches from which some are artificial and some are natural. Bangladesh fortunately gets this by nature. Cox‟s Bazar is the largest unbroken beach in the world. But Bangladesh tourism hasn‟t able to make Cox‟s Bazar as a brand. Local those who are affluent and foreign travelers don‟t feel more curiosity to travel Cox‟s Bazar than other beaches in the world though it‟s the largest one. There locate a problem behind this. Cox‟s Bazar is rich enough for its scenic beauty but not avail sufficient option for tourist. Branding helps to create an image to the people‟s mind. Brand helps to place object with some added attention. Branding helps to get Cox‟s Bazar that additional consideration from people all over the world. Bangladesh Porjoton Corporation has scope to build Cox‟s Bazar as a brand. Therefore, it is necessary to uncover the reasons of building that helps to build Cox‟s Bazar a brand. 1.2 Problem statement Management Decision Problem Can Cox‟s Bazar be branded? Marketing Research Problem To determine the factors that are essential for building Cox‟s Bazar a brand. 1.3 Objective Broad Statement: Build Cox‟s Bazar a brand Specific component: Focus on the perception of tourist about Cox‟s Bazar. Identify attitude toward Cox‟s Bazar. Specify that is needed to build Cox‟s Bazar a brand. Page : 01 1
- 2. 1.4 Problem Variables Dependent Variable Build Cox‟s Bazar a Brand Independent Variables 1. Slogan 2. Logos & Symbols 3. Image 4. International Advertisement 5. Tourist securities 6. Food Facilities in Hotels 7. Entertainment Facilities 8. Importance of beach environment 9. Cost 1.5 Approach to the problem Branding is a promise to the consumer, an expectation of performance and a mark of integrity and reputation (Kaplanidou & Vogt, 2003.) It builds up continuously in the mind of the consumer and is affected by memories, experiences and other visitor‟s comments. Branding also aims to secure repeat purchases through some degree of brand security. “Branding is perhaps the most powerful marketing weapon available to contemporary destination marketers” (Morgan and Pritchard, 2002, p.11) These elements are very much important as brand components: identity, essence, personality, image, character and culture (Kaplanidou & Vogt, 2003). There are some components of branding and those are given bellow: Brand Identity: “Brand identity should help establishing a relationship between the brand and the customer by generating a value propositioning involving functional, emotional or self expressive benefits”. (Aaker 1996:68) Brand Image: Brand Image is related to how the brand is currently perceived by consumers (Aaker, 1996:71). Brand Personality: The personality of the brand can be associated with a set of human characteristics, such as gender, age, warmth, socio-economic class etc. Brand Essence or Soul: The Soul of the brand includes the emotional elements and values of the brand. These emotional elements should be part of a long term positioning strategy that does not Page : 02 2
- 3. change too often and which strategically positions the brand in the mind of the consumer (Kaplanidou & Vogt, 2003). Brand character: The character of the brand is perceived in terms of integrity, trustworthiness and honesty. This also relates to the promise of the brand to deliver the experience associated with the brand (Kaplanidou, 2003). According to the WTO there are various tools which could assist in effectively communicating the brand image. Those are: Slogans Themes Visual symbols A tone of voice and Design styles (WTO, 29 January 2007) Cox‟s Bazar is a tourist destination. It may become a good brand also. If we want to make Cox‟s Bazar a good brand then the process will known as a destination branding. Destination branding is, “A strong national brand stands for something and does it with authenticity, distinctiveness, style, emotion and co-ordination” (Hildreth, 2006). Destination branding is a process used to develop a unique identity and personality that is different from all competitive destinations. Destination branding is “selecting a consistent brand element mix to identify and distinguish a destination through positive image building” (Cai, 2000) „„Destination branding‟‟ (DB) has been considered a potent marketing tool (Morgan, Pritchard, Pride 2004). It is defined as „„selecting a consistent element mix to identify and distinguish [a destination] through positive image-building‟‟ (Cai 2002:722), and has been considered synonymous with (re)positioning (Gilmore 2002), image-building (Curtis 2001), and image- reconstruction (Hall 2002) of a destination. DB has been also analogous to corporate or umbrella branding, whereby a destination functions like a company that produces various product/service brands. (Gnoth 2002; Papadopoulos and Heslop 2002) According to the Department of Parks, Recreation and Tourism Resources of Michigan State University, “a destination brand is all about how visitors perceive the destination in their minds. Destination branding stretches much further than a destination logo or slogan but rather captures the distinct elements of the destination in the brand and communicates.” The branding of destinations has to aim to create an appropriate image, which is appealing and yet truthful in content and style. (Lumsdon, 1997: 169) Branding of a product does not only differentiate the product competitively but also serves as means of adding perceived value to the product. A strong branding image will create a strong identity of the product and/or service. The Page : 03 3
- 4. visible manifestation within a competitive market and the desire to create a competitive advantage to reinforce product and service differentiation is therefore extremely important. Destination branding is about combining all things associated with the 'place' (i.e., its products and services from various industries: agriculture; tourism; sports; arts; investment; technology; Education, etc. That collaborates under one brand. Its aim is to capture the essence of the destination, in a unified manner, and can be consumed simultaneously at a symbolic and experiential level. It is then used to market those unique added values to consumer needs and sustaining its success in the face of competition. A destination brand is: A way to communicate a destination‟s unique identity to visitors A means of differentiating a destination from its competitors A uniform “look” that all destination partners can consistently use A symbol, name, term or design, or combination of these elements A destination brand is not just: An advertising slogan (or tag line) A logo to stick on a t-shirt A distinctive color scheme A brochure or Web site An emotional attachment to the destination must be built with a brand that is: Credible Deliverable Differentiating Conveying powerful ideas Enthusing for partners and stakeholders Resonating with visitors Five Phase of Destination branding Phase1: Market investigation, analysis and strategic recommendations Phase 2: Brand identity development Phase 3: Brand launch and introduction – communicating the vision Phase 4: Brand implementation Phase 5: Monitoring, evaluation and review Page : 04 4
- 5. Brand drivers are the essence of a place – the destination‟s unique and own-able qualities that make it different from other places. Walter Landor, Landor Associates, San Francisco as quoted in: “More than a logo: Building a brand identity” by Kathleen Cassedy, HSMAI Marketing Review, Summer 2001 According to Fabricius (2006); from the WTO the benefits of effective branding and positioning include: Customer loyalty and also industry loyalty Not only do tourists „buy in‟ to the destination but industry stakeholders also share in a national umbrella branding strategy. Quality, service and efficiency of the tourism products can thus become continuing elements carried throughout the hierarchical structure of tourism role players and stakeholders. The national branding strategy could encourage and foster loyalty from governmental role players (NTB), to Non Governmental Organizations (NGO‟s), to accommodation suppliers and also to attraction and activity offerings (Marconi, 2000; Fabricius, 2006). Commercial value of a destination can also be increased an effective branding strategy has the ability to increase market share dramatically (Fabricius, 2006). Enabler for private and public partnerships and Seamless communications Branding strategies have the power to blur boundaries between public and private partnerships. The elimination of such boundaries can ensure more effectiveness and efficiency through cooperation and also communication (Fabricius, 2006). Promotional tool An effective branding strategy will also serve as a promotional tool as past, current and potential visitors‟ deciding and motivating phases of travelling can be affected by the branding strategy. The deciding and motivating phase to a certain destination can either be convinced or de-motivated to travel to a destination, depending on how appropriate, attractive and appealing the branding strategy is perceived. (Fabricius, 2006) Local support, however, is usually a necessary component for a successful tourism strategy, as noted by Bourke and Luloff (1995), and echoed by Brass (1996), Burr (1995), and Woods (1992). That is why tourism strategies must be consistent with local goals and be sensitive to sustaining a community‟s character and traditions. McDaniel‟s (2001) article of southwestern Virginia, which highlights the tourism potential of the region‟s scenic and abundant recreational activities, is a representative exampleThe common measures for Destination Branding effectiveness were target markets‟ awareness level (destination name recall), perceptions of a destination, touristic behavior (activities, season, travel frequency, and information sources), and future tourism intentions. Page : 05 5
- 6. As Mundt (2002) argued, „„branding‟‟ seems to be used as a replacement for „„image-building.‟‟ Accordingly, the measures to evaluate effectiveness of destination branding are not different from those for image. Thus, the term, DB might be „„old wine in a new bottle.‟‟ That is, it may be re- adorned jargon to emphasize the need for unequivocal „„focus‟‟ in marketing a destination to appeal to tourists. It may also be that branding strategies would work only under certain conditions, while other destinations do not need it if the existing marketing function does the job. For example, branding strategies would be effective if a nation is undergoing redefinition of identity, such as Central and Eastern European countries (Hall 2002). As destination branding is becoming prevalent for its touted benefits, it seems evident that a clearer conceptualization needs to be established. To do so, empirically testable models based on integrative understanding of various cases rather than currently existing normative models („„what should be‟‟) are called for to evaluate the validity of DB. The current study was intended to initiate the development of its theoretical foundations and should assist destination marketing organizations in deciding if it is viable to invest their limited resources in destination branding (Henderson 2000). Page : 06 6
- 7. 1.6 Conceptual Framework Physical Emotional Benefit Benefit Experience Tourist Evaluation Brand Awareness Image Brand Imagery Brand Feeling Positioning Brand Resonance Cox’s Bazar a Brand Figure: Conceptual Framework of building Cox’s Bazar as a brand Page : 07 7
- 8. 1.7 Research Question A structured questionnaire has been used to collect data. Multiple choice questions and dichotomous questions have been used to develop structured questionnaire. a. Q1: Is there any scope for building Cox‟s Bazar brand? b. H1: There is potential scope for building Cox‟s Bazar a brand 1.8 Hypotheses a. H0: There is not potential scope for building Cox‟s Bazar a brand. b. H1: There is potential scope for building Cox‟s Bazar a brand 1.9 Analytical Model 1.9.a Verbal Model To build Cox‟s Bazar a brand, facilities of hotels, rooms and beaches and other variables help to draw an experience. That experience helps to build and image and other variables like slogan, logos, advertisement helps to build an association to make Cox‟s Bazar a brand. 1.9.b Graphical model Food Facility Slogan Logos & Symbols Image Cost of Travel International Entertainment Advertisement Facility Build Cox’s Bazar a Brand Security Local transportation Beach environment Figure: Graphical model of building Cox‟s Bazar as a brand Page : 08 8
- 9. 1.9.c Mathematical Model y = a0 + Σ ai xi Where, Y = building brand a0, ai = model parameters to be estimated statistically Xi = factors that helps to build brand Page : 09 9
- 10. 2.1 Types of Research Building Cox‟s Bazar as a brand is a descriptive research. It needs some quantitative information to take a decision. Secondary information about the area of this research is not available. That‟s why we had to collect primary information from the sample. 2.2 Information Needed To do the research we used information that focus on I) Issues that a tourist thinks about Cox‟s Bazar depending on different aspects. ii) Obstacle of developing Cox‟s Bazar a brand. 2.3 Data Collection Method As we collected primary information, we choose personal, and mail interviews method as data collection tool. 2.4 Scaling Technique The questionnaire consists of some questions of brand related issues on which the respondent tourists have been asked to document their response on different dimensions of Nine-point rating scale. These objective questions have attempted to collect objective data like the extent of tourists' positive and negative attitudes on different tourism arrangements/services in Bangladesh and also other attributes that related to building brand. The questionnaire for the respondent tourists will contain a nine-point Likert Scale. 2.5 Nature of question Questions will focus on the considerations of factors that will help to build Cox‟ Bazar a brand. 1. Tourism facilities that require building brand. For example, some questions state through open ended, some close ended and questionnaire also includes dichotomous, and 9 point Likert scale. 2. Questionnaire contains 25 questions asked to the respondents. 3. Average interviewing time is 30 minutes. 2.6 Population of the study There are some categories of population have been set based on the objectives and scope of the study. These are (i) Executives of the BPC, (ii) owners of private tour operators (TOAB members), (iii) Tourists visiting the country, (iv) Owners of travel agencies, (v) Hotel managers, and (vi) Restaurants managers. The first category consists of currently employed executives of the BPC. An up to date Page : 10 10
- 11. TOAB (Tour Operators Association of Bangladesh) members' list consisting of names and addresses of 32 firms has been used as the base of population for the second category. The size and composition of population for the tourist category is not precisely known and their proper categorization could not be made. Since no up to date list of travel agencies, hotels, and restaurants operating in Bangladesh has been found, the sizes of population for those three sectors remain unknown. 2.7 Sample Size Sample selection We used stratified sampling technique for selecting respondents considering hotels and different foreign cultural center as strata. We took 30 respondents as the sample of our study. i. Tourism Firms: Five types of tourism firms have been examined in this study. These include BPC, Private Tour operators, Travel Agencies, Hotels, and Restaurants. Hotels and restaurants have been studied as they play important roles to serve tourist guests and in adopting tour operators' services, and thus accelerating the development of tourism activities in Bangladesh. ii. Tourists: The study has included the foreign tourists & local tourist who have visited different destinations of the country. It will help to demonstrate perceptions and preference of them. iii. Cultural Centers: British Council, Russian cultural center and others consider as sampling frame because number of foreigners are there as tourist. As these foreigners travel throughout the world, their assessment can make our research reliable and valid. 2.8 Fieldwork Field operation is the phase of the project during which researchers make contact with the respondents, administrator the data collection instruments, record the data, and return the data to a central location for processing. We have collected data by contacting our respective respondent in different cultural center, tourist firms and hotels. We have collected data within 7 days, and take other seven days for preparing analysis and report. Data Collection Data Input Report Preparation 7 days 2 days 5 days Page : 11 11
- 12. 3.1 Analysis of Variance & Analysis of Covariance Analysis of variance is a statistical technique for examining the difference among means for two or more populations. If two factors are involved, the analysis is termed two-way analysis of variance. In our research we consider two ways ANOVA for examining difference. Independent variables need to be categorical and dependent variable need to be metric. In analysis of variance we estimate two measures of variation: within group and between groups. F Ratio helps to identify rejection or acceptance of null hypotheses. If F value is larger than the critical value, null hypothesis is rejected. Analysis of Covariance – An advanced analysis of variance procedure in which the effects of one or more metric-scaled extraneous variables are removed from the dependent variable before conducting the ANOVA. In our research we consider weather as covariate or extraneous factor which effects need to be removed from the dependent variable, building Cox‟s Bazar a brand. Hypotheses for ANOVA- Ho: µ1 = µ2 = µ3 = µ4 = µ5 H1: µ1 ≠ µ2 ≠ µ3 ≠µ4 ≠ µ5 For analyzing the data we were instructed to use “Multiple Regression Analysis”, “Discriminant Analysis”, Logit analysis, Multidimensional scale, Analysis of variance and Analysis of covariance. We have collected data according to these model need. Following part of the report illustrate overall analysis of building Cox‟s Bazar a brand. 3.2 Multiple Regression Analysis “Multiple Regression Analysis” is a statistical technique that simultaneously develops a mathematical relationship between two or more independent variables and an interval-scaled dependent variable. For building Cox‟s Bazar a brand we need to consider different variable. These variables influence the dependent variable building Cox‟s Bazar a brand. Regression analysis states the associative relationship between metric dependent variable and independent variable. The coefficients associated with each of the independent variables are denoted by β. This coefficient denotes how much relationship exists between that particular independent variable and the dependent variable. From this research, the multiple regression equation would stand: A/T= C+ β1S+ β2 IA+ β3IE+ β4 CT+ β5BN+ β6 SE+ β7 IF+ β8 For building Cox‟s Bazar a brand Where, S = Slogan IA= International advertisement IE= Insufficient Entertainment facility CT= Cost of Travel BE= Beach Environment Page : 12 12
- 13. SE= Security IF= Inadequate Food I= Image Null hypothesis state there is no potential scope for building Cox‟s Bazar a brand and the alternative hypothesis is that there are potential scope for building Cox‟s Bazar a brand. If the β of all independent variable is same that it means the independent variables have no effect on the dependent variable of each package. Which means, the null hypothesis is accepted. But if the β of all the independent variables are not same for each variable then it can be said that the null hypothesis is rejected and automatically the alternative hypothesis would be accepted. We can also use the R2 Value to test hypothesis. If this value is 0 for each variable then it can be said that there is no relationship among the dependent and independent variables for each package. If not, then we can say there are some relationships among the variables, which means we can reject the null hypothesis and accept alternative hypothesis. Hypotheses test with multiple regression analysis given below- 1st method, using β H0: β1= β2=β3= β4= β5= β6= β7 H1: β1≠β2≠β3≠β4≠β5≠β6≠β7 2nd method, using R2 Value H0: R2 =0 H1: R2 ≠0 3.3 Factor Analysis Mathematically, factor analysis is somewhat similar to multiple regression analysis, in that each variable expressed as a linear combination of underlying factors. This technique used to determine the underlying dimensions of a larger set of inter correlated variable. X I =Ai1 F1+ Ai2 F2 + Ai3 F3+ ViUi The analytical process is based on a matrix of correlations between the variables. For the factor analysis to be appropriate, the variables must be correlated. If the correlations between all the variables are small, factor analysis may not be appropriate. Barlett test of Sphericity can be used to test null hypothesis that the variables are uncorrelated in the population. Another useful statistic is the Kaise-Meyer-Olkin (KMO) measure of sampling adequacy. KMO statistic indicates that the correlations between pairs of variables cannot be explained by other variables and that factor analysis may not be appropriate. Generally, a value greater than 0.5 is desirable. Page : 13 13
- 14. We also analyzed Eigen vale that explained the total variance by each factor. Factor matrix helps to understand the standardized variables in terms of the factors. These coefficients, the factor loadings, represent the correlations between the factor and the variables are closely related. The coefficient can be used to interpret the factors. Interpretation is facilitated by identifying the variables that have large loadings on the same factor. Here in this model hypotheses are, When it is determined that factor analysis is an appropriate for analyzing the data, an appropriate method must be selected. We select principal component factor that consider the total variance in the data. 3.4 Discriminant Analysis Discriminant Analysis is described as a technique for analyzing marketing research data when the criterion or dependent variable is categorical and the predictor or independent variables are interval in nature. In our research, of building Cox‟s Bazar a brand, we collect data of those tourists who went Cox‟s Bazar in last three years frequent or non-frequently. That helps to divide them into two groups. As discriminant analysis use to classify an object or person into two groups it helps to identify significant differences exist among the groups, in terms of the predictor variable. The analysis was done based on 4 factors- “Wilk‟s λ Analysis” which represents the influencing ability of the independent variables, “F Ratio” and “Significance” measurement for the significance of each independent variables and “Standard Canonical Discriminant Function Coefficient (SCDFC)” to measure the importance of the independent variable. For “Wilk‟s λ Analysis”, it was assumed that, the higher the value of Wilk‟s λ, the lower the influencing ability of that independent variable and vice versa. Significance was measured directly. To prove the significance is true, “F Ratio” was used. The higher the value of F, the higher the significance of the independent variable. At last, importance of each independent variable was measured using “Standard Canonical Discriminant Function Coefficient”, which refers to the highest valued independent variable as the most important one and the lowest valued independent variable as the least important one. Hypotheses test was also done with this analysis. For this purpose, group means of both the group of frequent visitor and non-frequent visitor were selected as the group parameter. The null hypothesis would be that, these means are equal for each group. The alternative hypothesis would be these group means are not equal. The hypotheses test has given in a brief in the following- Page : 14 14
- 15. H0: µh=µl H1: µh ≠µl µh= Group mean of the frequent visitor µl= Group mean of the non-frequent visitor 3.5 Logit Analysis This model considers binary dependent variable and metric independent variable. In logistic regression, commonly used measures of model fit are based on the likelihood function and are Cox & Snell R square and Negelkerke R square. In this case the significance of the estimated coefficients is based on Wald‟s statistic. Thus the size of the change in the log odds of the dependent variable event when the corresponding independent variable Xi is increased by one unit and the effect of the other independent variables is held constant. In our research we use logit model to asses the significance of variable on binary dependent variable. We consider frequent and non-frequent visitor group of people to assess their attitude on building Cox‟s Bazar a brand. 3.6 Multidimensional scale It is used for representing perceptions and preferences of respondents spatially by means of a visual display. In our research, we use multidimensional scale for identifying respondent‟s perception about Cox‟s Bazar based on three dimensions than other beaches in the world. In MDS R Square should be examined. R square correlation index that indicates the proportion of variance of the optimally scaled data that can be account for MDS procedure. Spatial map perceived relationship among beaches are represented as geometric relationship among points in a multidimensional space. 3.7 Conjoint Analysis It attends to determine the relative importance of different attributes or combination offered to tourist. It illustrates which combination is more significant for building Cox‟s Bazar a brand. In our research we select important nine profiles. This nine profile is the combination of hotel rent, transportation mode and food facility. We classify all these three attributes into 3 categories like Hotel rent Food 1= 5,000 1= Sea Food 2 = 10,000 2 = Standard Food 3 = 15,000 3 = Foreign Food Transportation Mode 1= Rickshaw 2 = Jeep 3 = Private Car Page : 15 15
- 16. 4.1 ANOVA & ANCOVA Univariate Analysis of Variance T es ts o f Betw ee n -Su bje cts Effe cts Dependent Variable: Building c ox 's Bazar a brand Ty pe III Sum Sourc e of Squares df Mean Square F Sig. Correc ted Model 27.767 a 21 1.322 1.090 .478 Intercept 792.688 1 792.688 653.763 .000 security 3.433 2 1.716 1.416 .298 inad_f oo 3.508 2 1.754 1.446 .291 ins_ent 5.357 1 5.357 4.418 .069 inter_ad .367 1 .367 .302 .597 cs t_tra 2.862 2 1.431 1.180 .356 security * inad_f oo .000 0 . . . security * ins_ent .650 2 .325 .268 .771 inad_f oo * ins_ent .000 0 . . . security * inad_f oo * ins_ .000 0 . . . ent security * inter_ad 1.545 2 .772 .637 .554 inad_f oo * inter_ad 1.786 1 1.786 1.473 .260 security * inad_f oo * inter_ .000 0 . . . ad ins_ent * inter_ad .000 0 . . . security * ins_ent * inter_ .000 0 . . . ad inad_f oo * ins_ent * inter_ .000 0 . . . ad security * inad_f oo * ins_ .000 0 . . . ent * inter_ad security * c st_tra 8.703 2 4.352 3.589 .077 inad_f oo * cs t_tra .000 0 . . . security * inad_f oo * c st_ .000 0 . . . tra ins_ent * c st_tra .643 2 .321 .265 .774 security * ins_ent * cst_tra .000 0 . . . inad_f oo * ins_ent * c st_ .000 0 . . . tra security * inad_f oo * ins_ .000 0 . . . ent * cs t_tra inter_ad * c st_tra .316 1 .316 .261 .623 security * inter_ad * cst_ .058 1 .058 .048 .832 tra inad_f oo * inter_ad * c st_ .000 0 . . . tra security * inad_f oo * inter_ .000 0 . . . ad * cs t_tra ins_ent * inter_ad * cst_ .000 0 . . . tra security * ins_ent * inter_ .000 0 . . . ad * cs t_tra inad_f oo * ins_ent * inter_ .000 0 . . . ad * cs t_tra security * inad_f oo * ins_ .000 0 . . . ent * inter_ad * cs t_tra Error 9.700 8 1.213 Total 1710.000 30 Correc ted Total 37.467 29 a. R Squared = .741 (A djusted R Squared = .061) From this table we find that insufficient entertainment facility is significant. Sufficient entertainment facilities can help to build Cox‟s Bazar a brand. F value is larger than critical value that indicates its Page : 16 16
- 17. significance. Cox‟s Bazar is the largest sea beach in the world but entertainment faculty is not appropriate for foreign tourist. Univariate Analysis of Variance Tes ts of Betw ee n-Subje cts Effe cts Dependent Variable: Building c ox's Bazar a brand Ty pe III Sum Sourc e of Squares df Mean Square F Sig. Correc ted Model 2.029a 4 .507 .358 .836 Intercept 38.334 1 38.334 27.043 .000 w eather .889 1 .889 .627 .436 ins_ent .403 1 .403 .284 .599 inter_ad .163 1 .163 .115 .737 ins_ent * inter_ad .044 1 .044 .031 .861 Error 35.438 25 1.418 Total 1710.000 30 Correc ted Total 37.467 29 a. R Squared = .054 (A djusted R Squared = -.097) From this output of ANCOVA, we find that covariate weather is not significant. Thus it can be said that weather is insignificant as covariate. For building Cox‟s bazaar brand weather is less significant factor. 4.2 Multiple Regression Analysis From the results shown in the SPSS analysis for regression analysis, the following relationship was found for the independent and dependent variables Model Sum m ary Adjusted Std. Error of Model R R Square R Square the Estimate 1 .671 a .450 .241 .990 a. Predictors: (Constant), image ref lec ts pleasure, w ell secured, slogan helps to build brand, inadequate f ood f ac ility, cos t of trav el low , international ad helps to build a brand , ins suf f icient entertainment f acility , nois y beac h env ironment Page : 17 17
- 18. Coefficientsa Unstandardized Standardized Coefficients Coefficients Model B Std. Error Beta t Sig. 1 (Constant) 15.474 3.585 4.316 .000 slogan helps to build .192 .152 .221 1.262 .221 brand international ad helps to -.644 .349 -.379 -1.847 .079 build a brand insufficient -.450 .175 -.536 -2.580 .017 entertainment facility cost of travel low -.314 .147 -.431 -2.133 .045 noisy beach environment -.136 .110 -.280 -1.235 .230 well secured .224 .128 .322 1.742 .096 inadequate food facility -.473 .193 -.444 -2.453 .023 image reflects pleasure -.041 .125 -.060 -.328 .746 a. Dependent Variable: Building Cox’s Bazar a brand We consider 8 variables for explaining relation of these variables with building Cox‟s Bazar a brand. From the table coefficient, we find that significance level of insufficient entertainment facilities is least than any other variable. It represent that sufficient entertainment facility helps to build Cox‟s Bazar a brand. Inadequate food facility also has significant relationship that illustrate that if food facilities is standard, it is able to make an effect on tourist mind that helps to build brand. Here R = .450 R square = .241 It indicates that R ≠ 0 which lead to the rejection of null hypotheses. It means variables have correlation among them. A/T= C+ .221S - .379 IA-.536IE-.431CT- .280BN+ .322SE-.444 IF-.060I Table 1: Independent variable that influence dependent variable Variable name Significance value Entertainment facility 0.17 Food facility 0.23 Cost of travel 0.45 International advertisement 0.79 Page : 18 18
- 19. 4.3 Factor Analysis KMO and Bartle tt's Te s t Kais er-Mey er-Olkin Meas ure of Sampling A dequacy. .531 Bartlett's Test of A pprox. Chi-Square 46.880 Sphericity df 28 Sig. .014 KMO value indicates that the correlation between pair of variables can be explained by other variables and the factor analysis is appropriate. Total Variance Explained Initial Eigenvalues Extraction Sums of Squared Loadings Rotation Sums of Squared Loadings Component Total % of Variance Cumulative % Total % of Variance Cumulative % Total % of Variance Cumulative % 1 2.243 28.035 28.035 2.243 28.035 28.035 2.142 26.772 26.772 2 1.647 20.593 48.627 1.647 20.593 48.627 1.590 19.872 46.645 3 1.407 17.592 66.219 1.407 17.592 66.219 1.566 19.574 66.219 4 .827 10.335 76.555 5 .723 9.031 85.586 6 .532 6.647 92.233 7 .326 4.073 96.306 8 .296 3.694 100.000 Extraction Method: Principal Component Analysis. Interpreting this result we can see Eigen value of variables. The Eigen value for a factor indicates the total variance attributed to that factor. Factor 1 account for variance of 28% and other two factor accounts 20% and 17% respectively. In rotated component matrix factor 1 has high coefficient with variables insufficient entertainment facility, noisy beach environment, cost of travel. Therefore this factor may be labeled as Primary facility. Second factor relates with security and transportation. This factor can be labeled as secondary facility. Third factor relates with logos & symbol, international advertisement, pleasurable image. This factor can be labeled as branding factor. Page : 19 19
- 20. a Rotate d Co m p o ne nt M atrix Component 1 2 3 logos & sy mbol helps to .018 .329 .690 build brand local transportation is not .461 .701 .141 appropriate international ad helps to -.398 -.053 .636 build a brand w ell s ecured -.151 .904 -.022 inss uf f ic ient -.776 .269 -.126 entertainment f acility nois y beach environment .852 .092 -.004 image ref lec ts pleasure -.140 .121 -.770 cost of trav el low .631 .275 -.236 Ex traction Method: Princ ipal Component A naly sis . Rotation Method: V arimax w ith Kaiser Normaliz ation. a. Rotation converged in 6 iterations. Factor Name Variable Name Factor 1- Primary Entertainment facility Facility Beach environment cost of travel Factor 2- Secondary Well security Facility Appropriate transportation Factor 3- Branding International Advertisement Facility Logos & Symbol Pleasurable Image 4.4 Discriminant Analysis The interpretation of the discriminant coefficients is similar to that in multiple regression analysis. The value of the coefficient for a particular predictor depends on the other predictors included in the discriminant function. The signs of the coefficients are arbitrary, but they indicate which variable values result in large and small function values and associate them with particular groups. Generally, predictors with relatively large coefficients contribute more to the discriminating power of the function, as compared with predictors with smaller coefficients are therefore, more important. Page : 20 20
- 21. Tes ts of Equality of Group M eans Wilks ' Lambda F df 1 df 2 Sig. slogan helps to build .989 .303 1 28 .587 brand logos & sy mbol helps to .932 2.059 1 28 .162 build brand local transportation is not .988 .340 1 28 .564 appropriate international ad helps to .936 1.923 1 28 .176 build a brand w ell s ecured .861 4.509 1 28 .043 inadequate f ood f acility .991 .257 1 28 .616 inss uf f ic ient .894 3.332 1 28 .079 entertainment f acility nois y beach environment .771 8.331 1 28 .007 image ref lec ts pleasure .949 1.496 1 28 .231 cost of trav el low .879 3.837 1 28 .060 From this table we find that noisy environment is discriminate mostly. F ratio indicates that when the predictors are considered individually, only security, and logos & symbol differentiate between those who visited Cox‟s Bazar frequently and non-frequently. The Eigenvalue associated with function is 1.66 and it accounts for 100 percent of the explained variance. The canonical correlation associated with that is (0.790)2 indicates that 62 percent of variance. Eigenvalues Canonical Function Eigenvalue % of V arianc e Cumulativ e % Correlation 1 1.666a 100.0 100.0 .790 a. First 1 canonical discriminant f unctions w ere us ed in the analysis. Wilks ' Lam bda Wilks ' Test of Function(s) Lambda Chi-s quare df Sig. 1 .375 22.550 10 .013 Page : 21 21
- 22. Structure Matrix Function 1 noisy beach .433 environment well secured -.318 cost of travel low .294 insufficient -.274 entertainment facility logos & symbol helps .215 to build brand local transportation is -.183 not appropriate international ad helps -.096 to build a brand image reflects .087 pleasure slogan helps to build .082 brand inadequate food .034 facility Pooled within-groups correlations between discriminating variables and standardized canonical discriminant functions Variables ordered by absolute size of correlation within function. These simple correlations between the predictors and the discriminant function are listed in order of magnitude. It represents that noisy beach environment, security, and cost of travel discriminate between groups of frequent visitor and non-frequent visitor. Page : 22 22
- 23. 4.5 Logit Analysis Cas e Proces s ing Sum m ary a Unw eighted Cases N Percent Selected Cas es Included in A naly sis 30 100.0 Mis sing Cases 0 .0 Total 30 100.0 Unselected Cases 0 .0 Total 30 100.0 a. If w eight is in ef f ect, s ee c las sif ication table f or the total number of cases . Dependent Variable Encoding Original Value Internal Value non-f requent 0 f requent v isitor 1 Mode l Sum m ary -2 Log Cox & Snell Nagelkerke Step likelihood R Square R Square 1 28.628 .351 .468 V ariables in the Equation B S.E. Wald df Sig. Ex p(B) Step a INTRA D -.783 .725 1.167 1 .280 .457 1 SECURITY -.870 .413 4.435 1 .035 .419 ENTERTA N -.054 .416 .017 1 .897 .948 COSTTRA .884 .467 3.573 1 .059 2.420 Cons tant 4.171 5.352 .608 1 .436 64.801 a. V ariable(s) entered on step 1: INTRA D, SECURITY , ENTERTA N, COSTTRA. Interpretation According to the Wald statistic, it can be assessed that security is prime issue for frequently visitor and cost of travel also significant issue for frequent visitor. To make Cox‟s Bazar a brand security need to consider very efficiently. Page : 23 23
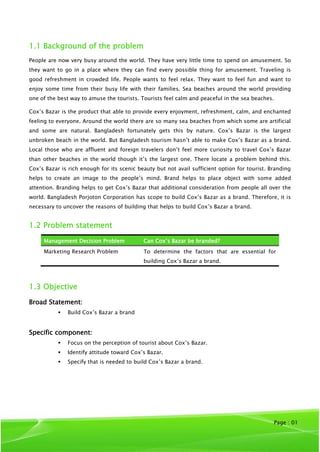
- 24. 4.6 Multidimensional Scale The data of the table were treated as rank ordered and scaled using a non-metric multidimensional scaling procedure. Because one respondent provided these data, an individual level analysis was conducted. Figure Derived Stimulus Configuration Euclidean distance model 2 paradise Brand factor 1 phuket cape_town pataya bondi 0 Primary facility Dimen sion 2 cox_bazar Secondary facility miami -1 hawai -1 0 1 2 In this figure, horizontal axis is labeled as primary facility versus secondary facility of beaches. Beaches with high positive value on this axis are Bondi and Cox‟s Bazar (Primary facility) and negative value (secondary facility) are Pataya and Phuket. The vertical axis labeled as strong branding factor verses weak branding factor. Cox‟s Bazar‟s position on spatial map indicates that Cox‟s Bazar is in higher in primary facility but poor in brand factor. Brands labeled near each other conflict more intensely. In the spatial map, Cox‟s Bazar is in a separate position having no close competition. So, according to the multi- dimension analysis, Cox‟s Bazar has a distinctive position on the respondent‟s mind. Page : 24 24
- 25. 4.7 Conjoint Analysis a Coe fficients Unstandardiz ed Standardized Coef f icients Coef f icients Model B Std. Error Beta t Sig. 1 (Cons tant) 1.772 1.119 1.584 .129 Low price_High c ar_ .067 .164 .113 .410 .686 medium f ood low price_low .096 .149 .159 .643 .528 trans port_high f ood Low price_Medium -.005 .110 -.008 -.041 .967 trans port_low f ood Medium Price_High .131 .116 .238 1.125 .274 Transport_High Food Medium Price_Medium -.092 .124 -.166 -.744 .465 Transport_high Food High pric e_high .266 .147 .447 1.808 .086 tranport_high f ood High pric e_low .061 .107 .119 .571 .575 trans port_medium food high price_medium -.055 .110 -.132 -.504 .620 trans port_high f ood Medium price_high .309 .107 .465 2.885 .009 trans port_low f ood a. Dependent Variable: Pref erence rating of going Cox's Bazar In conjoint analysis, we find that by offering different combination to tourist, they prefer most the combination of high price, high food and high transportation. Here, high price means expensive hotels; basically foreign tourist mostly emphasis on security. For that they want to spend money to be secure. High food means foreign food and high transportation means private car. Tourist wants secure transportation. Foreign tourist likes to use private car as transportation medium for convenience. Food is a prime factor. Local tourists like good quality Bengali food. But foreigners like to taste most of the time foreign food. An Italian tourist prefers to taste most of the time their own food than local sea food. Foreigners like to taste local for one or two times. That‟s why they prefer to take foreign food. Page : 25 25
- 26. 5.1 Conclusion & Recommendations To build Cox‟s Bazar a brand we consider many variables but the most obvious thing that is needed is attitude of our people toward Cox‟s Bazar. It is a valuable asset for us. We need to be rethinking about this treasure. Throughout the research we find that, tourist wants security at first, then entertainment and an environment where they can relax completely. But in Cox‟s Bazar security is not up to that mark which assure tourist not to feel insecure. After that, Bangladeshi culture is not permitting those activities that foreign tourist used to do in other foreign beaches. In foreign beaches male and female tourist can easily take sun bath but in Cox‟s Bazar it is even impossible to think. Entertainment facilities are also insufficient for foreign tourist. Local tourist go Cox‟s Bazar just to see it as it is largest in the world but foreign tourist want to go any beaches to make fun and enjoyment. Though Cox‟s Bazar is the largest sea beach, it is able to fail to attract because of its low advertisement and also because of no logos and symbol. Through this research we also uncover that brand building factor such as image, slogan, international advertisement, logos & symbol facilitate of branding Cox‟s Bazar. Bangladeshi people know the name of Cox‟s Bazar but lots of foreign people are not aware about this largest sea beach. Through advertisement people will know about it which helps to build an image. As we conducted different model to get quantitative information, so we can say that respondents wants to be well secured, wants more entertainment facility, and wants to travel at low cost. Those Page : 26 26
- 27. 5.2 Appendix Good Morning/Good Afternoon everyone, we are conducting a survey for our academic purpose. We are collecting information on how can Cox‟s Bazar be branded. General Information 1. What age group are you in? Under 18 18-25 26-30 31-35 36- 40 41-45 46-50 51-55 Above 56 2. Gender Male Female 3. Your marital status Unmarried Married Others 4. What is the highest level of education you have completed? School Some College Bachelors Masters Doctors Others 5. Your profession Student Unemployed Service-holder Businessman Housewife/husband retired others: be specify______________ 6. Slogans help to build Cox‟s Bazar as a Brand: Extremely Strongly Somewhat Agree Neither Disagree Somewhat Strongly Extremely agree agree agree agree disagree disagree disagree nor disagree 9 8 7 6 5 4 3 2 1 7. Tourists are well secured in Cox‟s Bazar: Extremely Strongly Somewhat Agree Neither Disagree Somewhat Strongly Extremely agree agree agree agree disagree disagree disagree nor disagree 9 8 7 6 5 4 3 2 1 Page : 27 27
- 28. 8. Food facilities in hotels are not adequate: Extremely Strongly Somewhat Agree Neither Disagree Somewhat Strongly Extremely agree agree agree agree disagree disagree disagree nor disagree 1 2 3 4 5 6 7 8 9 9. Logos& Symbols helps to locate easily recognize than competitive destination Extremely Strongly Somewhat Agree Neither Disagree Somewhat Strongly Extremely agree agree agree agree disagree disagree disagree nor disagree 9 8 7 6 5 4 3 2 1 10. Cost of travel in Cox‟s Bazar is affordable: Extremely Strongly Somewhat Agree Neither Disagree Somewhat Strongly Extremely agree agree agree agree disagree disagree disagree nor disagree 9 8 7 6 5 4 3 2 1 11. Beach environment is not comfortable in Cox‟s Bazar: Extremely Strongly Agree Somewhat Neither Somewhat Disagree Strongly Extremely agree agree agree agree disagree disagree disagree nor disagree 1 2 3 4 5 6 7 8 9 12. Local transportation are not appropriate for travelling in Cox‟s Bazar: Extremely Strongly Agree Somewhat Neither Somewhat Disagree Strongly Extremely agree agree agree agree disagree disagree disagree nor disagree 1 2 3 4 5 6 7 8 9 Page : 28 28
- 29. Image about Cox‟s Bazar refers pleasure Extremely Strongly Agree Somewhat Neither Somewhat Disagree Strongly Extremely agree agree agree agree disagree disagree disagree nor disagree 9 8 7 6 5 4 3 2 1 13. Entertainment facilities for tourists are not sufficient in Cox‟s Bazar: Extremely Strongly Agree Somewhat Neither Somewhat Disagree Strongly Extremely agree agree agree agree disagree disagree disagree nor disagree 1 2 3 4 5 6 7 8 9 14. International Advertisement help to build Cox‟s Bazar as a Brand: Extremely Strongly Agree Somewhat Neither Somewhat Disagree Strongly Extremely agree agree agree agree disagree disagree disagree nor disagree 9 8 7 6 5 4 3 2 1 15. Do you think that Cox‟s Bazar can be built a strong brand? Yes No How Many Times you go Cox‟s Bazar in last three years? a) 1-3 b) 3- more than 3 Page : 29 29
- 30. Conjoint Methodology by considering the problem “How Cox-Bazar can be Branded” 1. A combination of rent of Tk 5000 for hotels, private car as transport and a standard food family is desirable. Extremely Strongly Disagree Some Neutral Some Agree Strongly Extremely Disagree Disagree What What Agree Agree Disagree Agree 1 2 3 4 5 6 7 8 9 2. Blending the options of rent of Tk 5000 for hotels, rickshaw as transport and foreign food menu availability is expected. Extremely Strongly Disagree Some Neutral Some Agree Strongly Extremely Disagree Disagree What What Agree Agree Disagree Agree 1 2 3 4 5 6 7 8 9 3. Arranging a package of rent of Tk 5000 for hotels, jeep as transport and local food menu is preferable. Extremely Strongly Disagree Some Neutral Some Agree Strongly Extremely Disagree Disagree What What Agree Agree Disagree Agreed 1 2 3 4 5 6 7 8 9 4. A mixture of Tk, 10,000 as hotel rent, private car as transport and a foreign food menu is appreciable. Extremely Strongly Disagree Some Neutral Some Agree Strongly Extremely Disagree Disagree What What Agree Agree Disagree Agreed 1 2 3 4 5 6 7 8 9 5. An arrangement of Tk, 10,000 as hotels rent, private car as transport and a foreign food menu is desirable. Extremely Strongly Disagree Some Neutral Some Agree Strongly Extremely Disagree Disagree What What Agree Agree Disagree Agreed 1 2 3 4 5 6 7 8 9 Page : 30 30
- 31. 6. Combining a rent of Tk, 10000 for hotels, jeep as transportation and a standard food menu is satisfying. Extremely Strongly Disagree Some Neutral Some Agree Strongly Extremely Disagree Disagree What What Agree Agree Disagree Agreed 1 2 3 4 5 6 7 8 9 7. A blend of rent of Tk, 15,000 for hotel, private car as transport and local food menu as food choice is sufficient Extremely Strongly Disagree Some Neutral Some Agree Strongly Extremely Disagree Disagree What What Agree Agree Disagree Agreed 1 2 3 4 5 6 7 8 9 8. A mixture of rent of Tk, 15000 for hotels, rickshaw as transport and standard food menu is an attractive package. Extremely Strongly Disagree Some Neutral Some Agree Strongly Extremely Disagree Disagree What What Agree Agree Disagree Agreed 1 2 3 4 5 6 7 8 9 9. A combination of rent of Tk, 15000 for hotel, jeep as a transport and foreign food is preferable. Extremely Strongly Disagree Some Neutral Some Agree Strongly Extremely Disagree Disagree What What Agree Agree Disagree Agreed 1 2 3 4 5 6 7 8 9 Page : 31 31
- 32. Regression V ariables Enter ed/Re m ovebd V ariables V ariables Model Entered Remov ed Method 1 cost of travel low , internation al ad helps to build a brand , local trans portat ion is not appropriat e, slogan helps to build brand, w ell secured, inadequat e f ood . Enter f ac ility, image ref lec ts pleasure, logos & sy mbol helps to build brand, nois y beac h environme nt, inss uf f ic ie nt entertainm a ent f acility a. A ll requested variables entered. b. Dependent V ariable: building cox baz ar Model Sum m ary Adjusted Std. Error of Model R R Square R Square the Estimate 1 .608 a .370 .038 1.115 a. Predictors: (Constant), cost of trav el low , international ad helps to build a brand , loc al transportation is not appropriate, slogan helps to build brand, w ell sec ured, inadequate f ood f acility, image ref lects pleas ure, logos & s ymbol helps to build brand, nois y beach environment, inss uf f ic ient entertainment f ac ility Page : 32 32
- 33. ANOVAb Sum of Model Squares df Mean Square F Sig. 1 Regression 13.862 10 1.386 1.116 .400 a Residual 23.605 19 1.242 Total 37.467 29 a. Predictors: (Constant), cost of trav el low , international ad helps to build a brand , local trans portation is not appropriate, slogan helps to build brand, w ell secured, inadequate f ood f acility , image ref lec ts pleasure, logos & symbol helps to build brand, noisy beach environment, inss uf f ic ient entertainment f ac ility b. Dependent Variable: building c ox bazar a Coe fficients Unstandardiz ed Standardized Coef f icients Coef f icients Model B Std. Error Beta t Sig. 1 (Cons tant) 7.960 2.436 3.267 .004 slogan helps to build .249 .185 .287 1.346 .194 brand logos & sy mbol helps to -.245 .209 -.279 -1.173 .255 build brand image ref lec ts pleasure .287 .179 .391 1.606 .125 international ad helps to .065 .199 .080 .325 .749 build a brand w ell s ecured .054 .180 .078 .301 .767 inadequate f ood f acility .006 .180 .008 .033 .974 inss uf f ic ient -.344 .228 -.409 -1.510 .148 entertainment f acility nois y beach environment -.166 .127 -.341 -1.310 .206 local trans portation is not .008 .135 .012 .062 .952 appropriate cost of travel low -.272 .170 -.373 -1.595 .127 a. Dependent V ariable: building c ox bazar Discriminant Analysis Case Proce ss ing Sum m ary Unw eighted Cases N Percent Valid 30 100.0 Ex cluded Mis sing or out-of -range 0 .0 group codes At leas t one mis sing 0 .0 disc riminating variable Both miss ing or out-of -range group codes 0 .0 and at least one missing disc riminating variable Total 0 .0 Total 30 100.0 Page : 33 33
- 34. Group Statis tics V alid N (lis tw is e) V is itor of cox's Baz ar Mean Std. Deviation Unw eighted Weighted Non- f requent visitor slogan helps to build 6.9333 1.38701 15 15.000 brand logos & sy mbol helps to 6.3333 1.11270 15 15.000 build brand image ref lec ts pleasure 6.4000 1.54919 15 15.000 international ad helps to 7.4667 1.12546 15 15.000 build a brand w ell s ecured 5.3333 1.54303 15 15.000 inadequate f ood f acility 5.4667 1.55226 15 15.000 inss uf f ic ient 3.4000 1.50238 15 15.000 entertainment f acility nois y beach environment 3.2000 1.61245 15 15.000 local trans portation is not 5.8667 1.55226 15 15.000 appropriate cost of travel low 5.2667 1.70992 15 15.000 Frequent vis itor slogan helps to build 7.2000 1.26491 15 15.000 brand logos & sy mbol helps to 7.0000 1.41421 15 15.000 build brand image ref lec ts pleasure 6.7333 1.57963 15 15.000 international ad helps to 7.1333 1.68466 15 15.000 build a brand w ell s ecured 4.1333 1.55226 15 15.000 inadequate f ood f acility 5.6000 1.68184 15 15.000 inss uf f ic ient 2.5333 1.06010 15 15.000 entertainment f acility nois y beach environment 5.4000 2.47271 15 15.000 local trans portation is not 5.1333 1.72654 15 15.000 appropriate cost of travel low 6.3333 1.23443 15 15.000 Total slogan helps to build 7.0667 1.31131 30 30.000 brand logos & sy mbol helps to 6.6667 1.29544 30 30.000 build brand image ref lec ts pleasure 6.5667 1.54659 30 30.000 international ad helps to 7.3000 1.41787 30 30.000 build a brand w ell s ecured 4.7333 1.63861 30 30.000 inadequate f ood f acility 5.5333 1.59164 30 30.000 inss uf f ic ient 2.9667 1.35146 30 30.000 entertainment f acility nois y beach environment 4.3000 2.33637 30 30.000 local trans portation is not 5.5000 1.65571 30 30.000 appropriate cost of travel low 5.8000 1.56249 30 30.000 Page : 34 34
- 35. Tes ts of Equality of Group M eans Wilks ' Lambda F df 1 df 2 Sig. slogan helps to build .989 .303 1 28 .587 brand logos & sy mbol helps to .932 2.059 1 28 .162 build brand image ref lec ts pleasure .988 .340 1 28 .564 international ad helps to .986 .406 1 28 .529 build a brand w ell s ecured .861 4.509 1 28 .043 inadequate f ood f acility .998 .051 1 28 .823 inss uf f ic ient .894 3.332 1 28 .079 entertainment f acility nois y beach environment .771 8.331 1 28 .007 local transportation is not .949 1.496 1 28 .231 appropriate cost of trav el low .879 3.837 1 28 .060 Pooled Within-Groups Matrices lo cal lo gos & in ternational in ssuffic ie nt transportation slogan help s symbol helps image reflects ad helps to in adequate entertain ment nois y beach is not cost of to build brand to build brand pleasure build a brand w ell secured food facility facility environment appropria te travel lo w Correlatio n slogan help s to build 1.000 -.014 -.048 .208 -.053 .144 .203 .026 .090 .041 brand lo gos & symbol helps to -.014 1.000 .233 .542 .296 -.214 .086 -.081 -.228 -.232 build brand image reflects ple asure -.048 .233 1.000 .171 .524 .220 -.215 .376 -.009 .271 in ternational ad helps to .208 .542 .171 1.000 .071 -.346 .003 -.182 -.005 .041 build a brand w ell secured -.053 .296 .524 .071 1.000 .121 .194 .179 -.037 .356 in adequate food facility .144 -.214 .220 -.346 .121 1.000 -.384 .486 .064 .180 in ssuffic ie nt .203 .086 -.215 .003 .194 -.384 1.000 -.361 -.004 -.263 entertain ment facility nois y beach environment .026 -.081 .376 -.182 .179 .486 -.361 1.000 -.046 .335 lo cal transportatio n is not .090 -.228 -.009 -.005 -.037 .064 -.004 -.046 1.000 .173 appropria te cost of travel low .041 -.232 .271 .041 .356 .180 -.263 .335 .173 1.000 Page : 35 35
- 36. Analysis 1 Summary of Canonical Discriminant Functions Eigenvalues Canonical Function Eigenvalue % of Varianc e Cumulativ e % Correlation 1 1.589a 100.0 100.0 .783 a. First 1 canonical discriminant f unctions w ere us ed in the analysis. Wilks ' Lam bda Wilks ' Test of Function(s) Lambda Chi-s quare df Sig. 1 .386 21.880 10 .016 Standardize d Canonical Discrim inant Function Coefficie nts Func tion 1 slogan helps to build .162 brand logos & sy mbol helps to .954 build brand image ref lec ts pleasure .245 international ad helps to -.656 build a brand w ell s ecured -1.030 inadequate f ood f acility -.198 inss uf f ic ient .126 entertainment f acility nois y beach environment .342 local trans portation is not -.131 appropriate cost of travel low .812 Page : 36 36
- 37. Structure Matrix Func tion 1 nois y beach environment .433 w ell s ecured -.318 cost of travel low .294 inss uf f ic ient -.274 entertainment f acility logos & sy mbol helps to .215 build brand local trans portation is not -.183 appropriate international ad helps to -.096 build a brand image ref lec ts pleasure .087 slogan helps to build .082 brand inadequate f ood f acility .034 Pooled w ithin-groups c orrelations betw een discriminating variables and standardized canonic al disc riminant f unctions V ariables ordered by absolute s iz e of correlation w ithin func tion. Functions at Group Ce ntroids Func tion Vis itor of cox's Bazar 1 Non- f requent v is itor -1.218 Frequent visitor 1.218 Unstandardized c anonical disc riminant f unctions evaluated at group means Classification Statistics Clas sification Pr oces s ing Sum m ary Proces sed 30 Ex cluded Mis sing or out-of -range 0 group c odes At leas t one mis sing 0 disc riminating variable Used in Output 30 Prior Probabilities for Groups Cases Used in Analys is Vis itor of cox's Bazar Prior Unw eighted Weighted Non- f requent v isitor .500 15 15.000 Frequent visitor .500 15 15.000 Total 1.000 30 30.000 Page : 37 37
- 38. b,c Clas sification Re s ults Predicted Group Membership Non- f requent Frequent V is itor of cox's Baz ar visitor visitor Total Original Count Non- f requent visitor 13 2 15 Frequent vis itor 1 14 15 % Non- f requent visitor 86.7 13.3 100.0 Frequent vis itor 6.7 93.3 100.0 Cross -validateda Count Non- f requent visitor 10 5 15 Frequent vis itor 4 11 15 % Non- f requent visitor 66.7 33.3 100.0 Frequent vis itor 26.7 73.3 100.0 a. Cross v alidation is done only f or those c ases in the analy sis . In cros s validation, eac h case is class if ied by the f unc tions derived f rom all c as es other than that case. b. 90.0% of original grouped c ases correctly c lassif ied. c. 70.0% of cros s-v alidated grouped cas es c orrec tly class if ied. Page : 38 38
- 39. Regression V ariables Enter ed/Re m ovebd V ariables V ariables Model Entered Remov ed Method 1 Medium price_high trans port_ low f ood , Low price_ Medium trans port_ low f ood , High price_high tranport_ high f ood , low price_ low trans port_ high f ood, High price_low trans port_ . Enter medium f ood, Medium Price_High Trans port_ High Food, Medium Price_ Medium Trans port_ high Food, high pric e_ medium trans port_ high f ood , Low price_ High car_ medium a f ood a. A ll requested variables entered. b. Dependent V ariable: Pref erenc e rating of going Cox's Bazar Page : 39 39