Amazon.com - Volatility Sale
•
1 gefällt mir•494 views

Stock market, volatility, Ryan Renicker, Ryan Nolan Renicker, options, investments, active investing, active investment management, portfolio management, portfolio manager, trading, option overlays, gamma, delta, vega, theta, rho, VIX, S&P 500, China, top-down, bottom-up, top down, bottom up, event driven, event-driven, geopolitics, geopolitical, global, ETFs, exchange traded funds, FX, currency, stock market, alternative investments, economy, economics, Ryan N. Renicker, CFA, Ryan Nolan Renicker, CFA

Empfohlen
Empfohlen
Weitere ähnliche Inhalte
Mehr von RYAN RENICKER
Mehr von RYAN RENICKER (20)
Kürzlich hochgeladen
Kürzlich hochgeladen (20)
Amazon.com - Volatility Sale
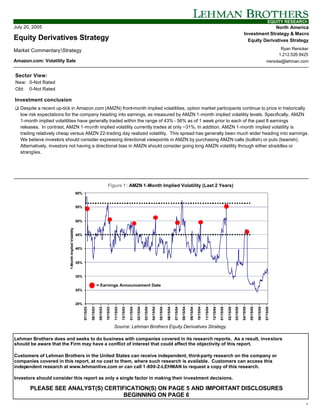
- 1. EQUITY RESEARCH July 20, 2005 North America Investment Strategy & Macro Equity Derivatives Strategy Equity Derivatives Strategy Market CommentaryStrategy Ryan Renicker 1.212.526.9425 Amazon.com: Volatility Sale rrenicke@lehman.com Sector View: New: 0-Not Rated Old: 0-Not Rated Investment conclusion q Despite a recent up-tick in Amazon.com (AMZN) front-month implied volatilities, option market participants continue to price in historically low risk expectations for the company heading into earnings, as measured by AMZN 1-month implied volatility levels. Specifically, AMZN 1-month implied volatilities have generally traded within the range of 43% - 56% as of 1 week prior to each of the past 8 earnings releases. In contrast, AMZN 1-month implied volatility currently trades at only ~31%. In addition, AMZN 1-month implied volatility is trading relatively cheap versus AMZN 22-trading day realized volatility. This spread has generally been much wider heading into earnings. We believe investors should consider expressing directional viewpoints in AMZN by purchasing AMZN calls (bullish) or puts (bearish). Alternatively, investors not having a directional bias in AMZN should consider going long AMZN volatility through either straddles or strangles. Figure 1 : AMZN 1-Month Implied Volatility (Last 2 Years) 60% 55% 50% 1-Month Implied Volatility 45% 40% 35% 30% = Earnings Announcement Date 25% 20% 07/15/03 08/15/03 09/15/03 10/15/03 11/15/03 12/15/03 01/15/04 02/15/04 03/15/04 04/15/04 05/15/04 06/15/04 07/15/04 08/15/04 09/15/04 10/15/04 11/15/04 12/15/04 01/15/05 02/15/05 03/15/05 04/15/05 05/15/05 06/15/05 07/15/05 Source: Lehman Brothers Equity Derivatives Strategy. Lehman Brothers does and seeks to do business with companies covered in its research reports. As a result, investors should be aware that the Firm may have a conflict of interest that could affect the objectivity of this report. Customers of Lehman Brothers in the United States can receive independent, third-party research on the company or companies covered in this report, at no cost to them, where such research is available. Customers can access this independent research at www.lehmanlive.com or can call 1-800-2-LEHMAN to request a copy of this research. Investors should consider this report as only a single factor in making their investment decisions. PLEASE SEE ANALYST(S) CERTIFICATION(S) ON PAGE 5 AND IMPORTANT DISCLOSURES BEGINNING ON PAGE 6 1
- 2. EQUITY RESEARCH • Despite a recent up-tick in Amazon.com (AMZN) front-month implied volatilities, option market participants continue to price in historically low risk expectations for the company heading into earnings, as measured by AMZN 1-month implied volatility levels (Q2 release date: July 26). Figure 2 : AMZN 1-Month Implied Volatility into Earnings 60% 55% 50% 1-Month Implied Volatility 45% 40% 35% 30% = Earnings Announcement Date 25% 20% 07/15/03 08/15/03 09/15/03 10/15/03 11/15/03 12/15/03 01/15/04 02/15/04 03/15/04 04/15/04 05/15/04 06/15/04 07/15/04 08/15/04 09/15/04 10/15/04 11/15/04 12/15/04 01/15/05 02/15/05 03/15/05 04/15/05 05/15/05 06/15/05 07/15/05 Source: Lehman Brothers Equity Derivatives Strategy. • Specifically, AMZN 1-month implied volatilities have generally traded within the range of 43% - 56% as of 1 week prior to each of the past 8 earnings releases. In contrast, AMZN 1-month implied volatility currently trades at only ~31%. Figure 3 : AMZN 1-Month Implied Volatility 7-Days Prior to Earnings (July 2003 – July 2005) 60% Risk expectations relatively low 55% ahead of next week's earnings. 1-Month Implied Vol. 7 Days Prior 50% 45% 40% 35% 30% 25% 20% April 26, 2005 Apr. 22, 2004 July 22, 2004 July 26, 2005 Oct. 21, 2003 Oct. 21, 2004 Jul. 22, 2003 Jan. 27, 2004 Feb. 2, 2005 EPS Announcement Date Source: Lehman Brothers Equity Derivatives Strategy. 2
- 3. EQUITY RESEARCH • In addition, AMZN 1-month implied volatility is trading relatively cheap versus AMZN 22-trading day realized volatility. This spread has generally been much wider heading into earnings (Figure 4). Figure 4 : AMZN 1M Implied – 22D Realized Volatility Spread 7 Days Prior to EPS 30% Implied volatility relatively low vs. realized. 1M Implied - 22D Realized Vol. Spread 25% 20% 15% 10% 5% 0% Jan. 27, 2004 Oct. 21, 2003 Oct. 21, 2004 Feb. 2, 2005 Jul. 22, 2003 Apr. 22, 2004 July 22, 2004 April 26, 2005 July 26, 2005 EPS Announcement Date Source: Lehman Brothers Equity Derivatives Strategy. 3
- 4. EQUITY RESEARCH • Against this backdrop, we believe investors should consider expressing directional viewpoints in AMZN by purchasing AMZN calls (bullish) or puts (bearish). • Alternatively, investors not having a directional bias in AMZN should consider going long AMZN volatility through either straddles or strangles. • Below we plot AMZN’s 1-day stock price return immediately following each of the past 8 earnings releases. On half of these occasions, AMZN moved more than 10%. Figure 5 : AMZN 1-Day Stock Return Following EPS Release (Last 8 Quarters) 20% 15% 15% AMZN 1-Day Return Post EPS 10% 5% 0% -3% -5% -7% -5% -9% -10% -13% -12% -15% -15% April 26, 2005 Apr. 22, 2004 July 22, 2004 Jan. 27, 2004 Jul. 22, 2003 Oct. 21, 2003 Oct. 21, 2004 Feb. 2, 2005 EPS Announcement Date Source: Lehman Brothers Equity Derivatives Strategy. • Lehman Internet analyst Douglas Anmuth expects AMZN to report Q2 2005 revenue of $1.75 billion, pro-forma operating income of $111 million, pro forma fully taxed EPS of $0.14 ($0.08 GAAP), and free cash flow of $149 million. Please see AMZN: Magic for Muggles, What About Investors? (7/15/05, Douglas Anmuth) for further details. 4
- 5. EQUITY RESEARCH Options are not suitable for all investors and the risks of option trading should be weighed against the potential rewards. Supporting documents that form the basis of the recommendations are available on request. Please note that the trade ideas within this report in no way relate to the fundamental ratings applied to European stocks by Lehman Brothers' Equity Research. Analyst Certification: I, Ryan Renicker, hereby certify (1) that the views expressed in this research Industry Note accurately reflect my personal views about any or all of the subject securities or issuers referred to in this Industry Note and (2) no part of my compensation was, is or will be directly or indirectly related to the specific recommendations or views expressed in this Industry Note. 5
- 6. EQUITY RESEARCH Important Disclosures Rating and Price Target Chart: AMZN AMAZON.COM, INC As of 14-Jun-2005 Currency = USD 64.00 60.00 56.00 52.00 48.00 44.00 40.00 36.00 32.00 28.00 24.00 20.00 16.00 12.00 6-02 9-02 12-02 3-03 6-03 9-03 12-03 3-04 6-04 9-04 12-04 3-05 6-05 Closing Price Price Target Recommendation Change Drop Coverage Source: FactSet Date Closing Price Rating Price Target Date Closing Price Rating Price Target 03-Feb-05 35.75 30.00 16-Dec-03 49.50 3-Underweight 27-Feb-04 43.01 36.00 05-Aug-02 12.87 RS-Rating 16-Dec-03 49.50 40.00 Suspended FOR EXPLANATION OF RATINGS REFER TO THE STOCK RATING KEYS LOCATED ON THE PAGE FOLLOWING THE LAST PRICE CHART 6
- 7. EQUITY RESEARCH Important Disclosures: The analysts responsible for preparing this report have received compensation based upon various factors including the Firm’s total revenues, a portion of which is generated by investment banking activities. Related Stocks: Disclosures Ticker Price (07/15) Rating Amazon.com, Inc C,J,K,M AMZN 37.19 3-Underweight C - Lehman Brothers Inc. makes a market in the securities of this company. J - Lehman Brothers Inc. or an affiliate trade(s) regularly in the shares of the subject company. K - Lehman Brothers Inc. has received non-investment banking related compensation from the subject company within the last 12 months. M - The subject company is or during the last 12 months has been a non-investment banking client (securities related services) of Lehman Brothers Inc. Risk Disclosure: AMZN: As Amazon opens more stores and extends its third-party platform, focus could be shifted from the core retail business. Amazon faces increased competition from search providers, portals, and other e-tailers. Amazon is vulnerable to shifts in consumer spending habits. Guide to Lehman Brothers Equity Research Rating System: Our coverage analysts use a relative rating system in which they rate stocks as 1-Overweight, 2- Equal weight or 3-Underweight (see definitions below) relative to other companies covered by the analyst or a team of analysts that are deemed to be in the same industry sector (the “sector coverage universe”). To see a list of the companies that comprise a particular sector coverage universe, please go to www.lehman.com/disclosures In addition to the stock rating, we provide sector views which rate the outlook for the sector coverage universe as 1-Positive, 2-Neutral or 3-Negative (see definitions below). A rating system using terms such as buy, hold and sell is not the equivalent of our rating system. Investors should carefully read the entire research report including the definitions of all ratings and not infer its contents from ratings alone. Stock Rating 1-Overweight - The stock is expected to outperform the unweighted expected total return of the sector coverage universe over a 12-month investment horizon. 2-Equal weight - The stock is expected to perform in line with the unweighted expected total return of the sector coverage universe over a 12- month investment horizon. 3-Underweight - The stock is expected to underperform the unweighted expected total return of the sector coverage universe over a 12- month investment horizon. RS-Rating Suspended - The rating and target price have been suspended temporarily to comply with applicable regulations and/or firm policies in certain circumstances including when Lehman Brothers is acting in a n advisory capacity in a merger or strategic transaction involving the company. Sector View 1-Positive - sector coverage universe fundamentals/valuations are improving. 2-Neutral - sector coverage universe fundamentals/valuations are steady, neither improving nor deteriorating. 3-Negative - sector coverage universe fundamentals/valuations are deteriorating. Stock Ratings From February 2001 to August 5, 2002 (sector view did not exist): This is a guide to expected total return (price performance plus dividend) relative to the total return of the stocks’ local market (i.e. the market where the stock primarily trades) over the next 12 months . 1-Strong Buy - expected to outperform the market by 15 or more percentage points. 2-Buy - expected to outperform the market by 5-15 percentage points. 3-Market Perform - expected to perform in line with the market, plus or minus 5 percentage points. 4-Market Underperform - expected to underperform the market by 5-15 percentage points. 5-Sell - expected to underperform the market by 15 or more percentage points. Distribution of Ratings: Lehman Brothers Global Equity Research has 1717 companies under coverage. 40% have been assigned a 1-Overweight rating which, for purposes of mandatory regulatory disclosures, is classified as Buy rating, 32% of companies with this rating are investment banking clients of the Firm. 42% have been assigned a 2-Equal weight rating which, for purposes of mandatory regulatory disclosures, is classified as Hold rating, 7% of companies with this rating are investment banking clients of the Firm. 18% have been assigned a 3-Underweight rating which, for purposes of mandatory regulatory disclosures, is classified as Sell rating, 87% of companies with this rating are investment banking clients of the Firm. This material has been prepared and/or issued by Lehman Brothers Inc., member SIPC, and/or one of its affiliates (“Lehman Brothers”) and has been approved by Lehman Brothers International (Europe), authorized and regulated by the Financial Services Authority, in connection with its distribution in the European Economic Area. This material is distributed in Japan by Lehman Brothers Japan Inc., and in Hong Kong by Lehman Brothers Asia Limited. This 7
- 8. EQUITY RESEARCH material is distributed in Australia by Lehman Brothers Australia Pty Limited, and in Singapore by Lehman Brothers Inc., Singapore Branch. This material is distributed in Korea by Lehman Brothers International (Europe) Seoul Branch. This document is for information purposes only and it should not be regarded as an offer to sell or as a solicitation of an offer to buy the securities or other instruments mentioned in it. No part of this document may be reproduced in any manner without the written permission of Lehman Brothers. With the exception of disclosures relating to Lehman Brothers, this research report is based on current public information that Lehman Brothers considers reliable, but we make no representation that it is accurate or complete, and it should not be relied on as such. In the case of any disclosure to the effect that Lehman Brothers Inc. or its affiliates beneficially own 1% or more of any class of common equity securities of the subject company, the computation of beneficial ownership of securities is based upon the methodology used to compute ownership under Section 13(d) of the United States' Securities Exchange Act of 1934. In the case of any disclosure to the effect that Lehman Brothers Inc. and/or its affiliates hold a short position of at least 1% of the outstanding share capital of a particular company, such disclosure relates solely to the ordinary share capital of the company. Accordingly, while such calculation represents Lehman Brothers’ holdings net of any long position in the ordinary share capital of the company, such calculation excludes any rights or obligations that Lehman Brothers may otherwise have, or which may accrue in the future, with respect to such ordinary share capital. Similarly such calculation does not include any shares held or owned by Lehman Brothers where such shares are held under a wider agreement or arrangement (be it with a client or a counterparty) concerning the shares of such company (e.g. prime broking and/or stock lending activity). Any such disclosure represents the position of Lehman Brothers as of the last business day of the calendar month preceding the date of this report. This material is provided with the understanding that Lehman Brothers is not acting in a fiduciary capacity. Opinions expressed herein reflect the opinion of Lehman Brothers and are subject to change without notice. The products mentioned in this document may not be eligible for sale in some states or countries, and they may not be suitable for all types of investors. If an investor has any doubts about product suitability, he should consult his Lehman Brothers representative. The value of and the income produced by products may fluctuate, so that an investor may get back less than he invested. Value and income may be adversely affected by exchange rates, interest rates, or other factors. Past performance is not necessarily indicative of future results. If a product is income producing, part of the capital invested may be used to pay that income. © 2005 Lehman Brothers. All rights reserved. Additional information is available on request. Please contact a Lehman Brothers entity in your home jurisdiction. Lehman Brothers policy for managing conflicts of interest in connection with investment research is available at www.lehman.com/researchconflictspolicy. Ratings, earnings per share forecasts and price targets contained in the Firm's equity research reports covering U.S. companies are available at www.lehman.com/disclosures. Complete disclosure information on companies covered by Lehman Brothers Equity Research is available at www.lehman.com/disclosures. 8