2. 0
6
8
10
12
14
16
18
2
4
-6
-8
-10
-12
-14
-16
-18
-2
-4
GLOBAL
TREASURY
GOVERNMENT
RELATED
CORPORATE SECURITISED HIGH YIELD EMERGING
MARKET
SOVEREIGN
(LOCAL)
GLOBAL LOANS EMERGING
MARKET
SOVEREIGN
(HARD)
Over the different stages of a market cycle, different credit sub-asset
classes play different roles. Some are more likely to benefit from a
growth environment, while others are more likely to protect investors’
capital during times of crisis. Market cycles drive the returns of credit
assets. In the first half of 2014, credit asset classes continued to
tighten as the global economy started to recover. The UK and US
economies have both shown signs of growth. Markets have focused on
the potential impact from the possibility and timing of monetary policy
tightening. In Europe, growth is less prominent. Therefore there is likely
to be a longer period of more accommodative monetary policy.
In such a dynamic market environment, some opportunities which
have historically appeared attractive may not always remain so. As
can be seen on the previous page, high yield bonds have seen strong
returns since 2009 as investors hunted for yield in a low interest
rate environment. In the first half of 2014, high yield bonds returned
6.1%. Consequently, over the period, the credit spreads as well as
the yields of high yield bonds have tightened to historical lows. As of
July 2014, Redington’s internal analysis shows that the credit spreads
of high yield bonds are now close to their fair value spread (i.e. credit
spreads compensate for default losses). In this case, therefore the risk
of potential losses in a long-only allocation has started to outweigh
the potential rewards from spreads tightening further. Therefore, a
more dynamic approach which allocates to different credit sub-asset
classes, across the credit quality spectrum and geographical regions,
could better take advantage of the changing market.
Redington believes that carefully selected absolute return bond, credit
relative value and multi-class credit strategies could add value in the
current market environment.
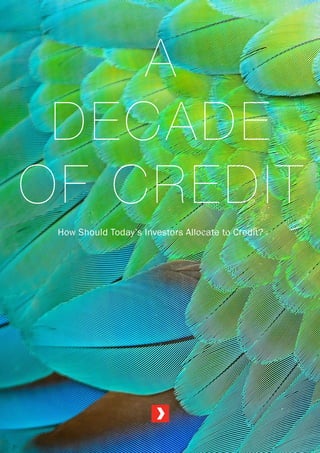
Historical monthly return distribution of the different credit sub-asset classes
Global Treasury, government-related and securitised bonds, represent the conservative end of the credit sub-asset classes. As can
be seen in the chart above, historical returns have a smaller range in these asset classes. On the other extreme, while high yield
bonds, global loans and emerging market debt have much higher returns on the upside, they also expose investors to potentially
large losses on the downside. The return distributions are not symmetric, investors in these asset classes have faced potentially
larger downside than upsides from returns.
How Should Today’s Investors Allocate to Credit?
MONTHLYRETURNS(%)
3. A Decade of CreditThis chart shows the calendar year returns on each credit sub-asset
class since 2003.
Fixed income investments in general have enjoyed strong rallies in the
past decade. For 8 out of the 11 full calendar years in our analysis
horizon, all credit sub-asset classes generated positive returns.
As interest rates fell over the past decade, global treasuries generated
positive returns in every single year. When financial markets became
very distressed in 2008, global treasuries returned 9.1% as investors
sought safe haven assets.
The securitised sector has also performed consistently through time.
Investments in the securitised sector are backed by pools of
financial or physical assets. This collateral provides some degree of
capital protection in distressed market conditions.
When markets are benign, sub-investment grade investments such
as high yield bonds and global loans, have topped the return charts
alongside hard currency and local currency emerging markets’
sovereign debt. However, these assets suffered severe performance
drawdowns in 2008 when all risky assets sold off.
Investment grade corporate bonds have participated in the
aforementioned interest rate rally in the past decade. In 2008,
corporate bonds suffered a modest loss of 5.1% as the combination of
widening credit spreads and falling interest rates offset each other to
some extent.
Corporate bonds which are
rated below investment grade
(high yield bonds have ratings
of BB+/Ba or below). Investors
in high yield bonds look for
compensation through higher
returns for greater exposure to
default risk.
HIGH
YIELD
US Dollar and Euro denominated
leveraged loans are privately
arranged floating rate bank
loans, used to finance
companies, are syndicated by
groups of banks and institutional
investors. Leveraged loans are
senior debt instruments secured
by a lien on the assets of the
borrower. These loans are usually
rated sub investment grade.
GLOBAL
LOANS
Debt investments which are
collateralised by assets such as
property mortgages or public
sector loans. Securitised debt
includes mortgage-backed
securities (‘MBS’), asset-
backed securities (‘ABS’), and
commercial mortgage-backed
securities (‘CMBS’) and covered
bonds.
SECURITISED
Sovereign bonds issued by
emerging market countries
in their own local currencies
(internal debt).
EMERGING
MARKET
SOVEREIGN(Local)
Sovereign bonds issued by
emerging market countries in
foreign currencies (external debt)
such as US Dollars or Euros.
EMERGING
MARKET
SOVEREIGN(Hard)
Bonds issued by local authorities,
supranational entities and
government agencies.
GOVERNMENT
RELATED
Investment grade corporate
bonds.
CORPORATE
Government bonds issued by
developed countries globally.
GLOBAL
TREASURY
Treasury - Barclays Global Aggregate Global Treasury Index (hedged to USD) / Government Related - Barclays Global Aggregate Global Government
Related Index (hedged to USD) / Corporate - Barclays Global Aggregate Global Corporates Index (hedged to USD) / Securitised - Barclays Global
Aggregate Global Securitised Index (hedged to USD) / High Yield - Barclays Global Aggregate Global High Yield Index (hedged to USD) / Global
Loans - 80% Credit Suisse Leveraged Loan Index and 20% Credit Suisse Institutional Western European Leveraged Loan Index (hedged to USD) /
EM Sovereign (Hard Currency) - JP Morgan EMBI Global Diversified Index / EM Sovereign (Local Currency) - JP Morgan GBI-EM Global Diversified
Traded Index
2003 2004 2005 2006 2007 2008 2009 2010 2011 2012 2013 2014 H1
High Yield
29.3%
EM Sov(HARD)
22.2%
EM Sov(LOCAL)
16.9%
EM Sov(LOCAL)
23.0% 15.2%
EM Sov(LOCAL)
18.1%
EM Sov(LOCAL)
-5.2%
EM Sov(LOCAL)
15.7%
EM Sov(LOCAL)
-1.8%
EM Sov(LOCAL)
16.8%
EM Sov(LOCAL)
-9.0%
EM Sov(HARD)
11.6%
EM Sov(HARD)
10.2%
EM Sov(HARD)
9.9%
EM Sov(HARD)
6.2%
EM Sov(HARD)
-12.0%
EM Sov(HARD)
12.2%
EM Sov(HARD)
7.3%
EM Sov(HARD)
17.4%
EM Sov(HARD)
-5.3%
Corporate
3.5%
Corporate
3.6%
Corporate
3.2%
Corporate
7.2%
Corporate
-5.1%
Corporate
4.8%
Corporate
10.9%
Corporate
0.1%
High Yield
12.0%
High Yield
5.6%
High Yield
57.7%
High Yield
15.1%
High Yield
3.6%
High Yield
19.2%
High Yield
6.5%
High Yield
-25.2%
High Yield
2.0%
High Yield
12.2%
Securitised
3.2%
Gov Related
2.8%
Treasury
2.0%
Global Loans
7.5%
Global Loans
2.0%
Global Loans
-28.9%
Global Loans
1.3%
Global Loans
9.7%
Global Loans
6.7%
Securitised
4.9%
Securitised
3.2%
Securitised
4.4%
Securitised
5.7%
Securitised
7.2%
Securitised
5.3%
Securitised
5.7%
Securitised
4.6%
Securitised
-0.4%
Gov Related
4.4%
Gov Related
4.2%
Gov Related
3.7%
Gov Related
6.9%
Gov Related
4.1%
Gov Related
6.0%
Gov Related
-0.9%
Gov Related
4.4%
Treasury
4.8%
Treasury
5.0%
Treasury
3.3%
Treasury
9.1%
Treasury
1.0%
Treasury
3.6%
Treasury
4.5%
Treasury
0.1%
Treasury
5.6%
Treasury
5.5%
EM Sov(HARD)
29.8%
Securitised
5.8%
Global Loans
11.0%
Global Loans
5.7%
Global Loans
5.9%
Global Loans
45.4%
Global Loans
9.8%
Gov Related
6.1%
Gov Related
5.3%
EM Sov(LOCAL)
6.3%
EM Sov(LOCAL)
22.0%
Corporate
6.5%
Corporate
5.5%
Corporate
16.6%
High Yield
6.1%
Treasury
3.8%
EM Sov(HARD)
8.7%
Securitised
3.9%
Global Loans
2.6%
Gov Related
4.2%
EM Sov(LOCAL)
6.0%
Corporate
5.1%
EM Sov(LOCAL)
ANNUALRETURNS(%)ANNUALRETURNS(%)