Weitere ähnliche Inhalte
Ähnlich wie Sf Residential Real Estate Market Report Jan 2010 - Jan 2012
Ähnlich wie Sf Residential Real Estate Market Report Jan 2010 - Jan 2012 (20)
Mehr von Ronny Budiutama (20)
Kürzlich hochgeladen (20)
Sf Residential Real Estate Market Report Jan 2010 - Jan 2012
- 1. Ronny Budiutama Intero Real Estate
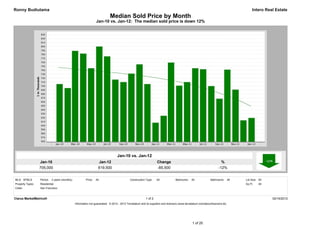
Median Sold Price by Month
Jan-10 vs. Jan-12: The median sold price is down 12%
Jan-10 vs. Jan-12
Jan-10 Jan-12 Change %
705,000 619,500 -85,500 -12%
MLS: SFMLS Period: 2 years (monthly) Price: All Construction Type: All Bedrooms: All Bathrooms: All Lot Size: All
Property Types: Residential Sq Ft: All
Cities: San Francisco
Clarus MarketMetrics® 1 of 2 02/16/2012
Information not guaranteed. © 2012 - 2013 Terradatum and its suppliers and licensors (www.terradatum.com/about/licensors.td).
1 of 20
- 2. Ronny Budiutama Intero Real Estate
Median Sold Price by Month
Jan-10 vs. Jan-12: The median sold price is down 12%
Time Period Median Price # Units Average DOM
Jan-12 619,500 124 82
Dec-11 613,500 226 63
Nov-11 691,000 230 57
Oct-11 741,500 200 53
Sep-11 668,000 205 65
Aug-11 700,000 207 64
Jul-11 742,500 202 61
Jun-11 745,000 263 58
May-11 710,000 220 64
Apr-11 701,000 197 67
Mar-11 759,500 216 65
Feb-11 625,000 123 82
Jan-11 607,500 159 71
Dec-10 705,000 231 66
Nov-10 755,000 184 59
Oct-10 731,500 200 56
Sep-10 710,000 175 59
Aug-10 716,500 204 57
Jul-10 775,000 199 58
Jun-10 800,000 230 59
May-10 745,000 239 56
Apr-10 782,000 203 47
Mar-10 789,000 221 54
Feb-10 695,000 125 62
Jan-10 705,000 121 72
Clarus MarketMetrics® 2 of 2 02/16/2012
Information not guaranteed. © 2012 - 2013 Terradatum and its suppliers and licensors (www.terradatum.com/about/licensors.td).
2 of 20
- 3. Ronny Budiutama Intero Real Estate
Median For Sale vs. Median Sold
Jan-10 vs. Jan-12: The median price of for sale properties is down 12% and the median price of sold properties is down 12%
Jan-10 vs. Jan-12 Jan-10 vs. Jan-12
Jan-10 Jan-12 Change % Jan-10 Jan-12 Change %
749,250 659,000 -90,250 -12% 705,000 619,500 -85,500 -12%
MLS: SFMLS Period: 2 years (monthly) Price: All Construction Type: All Bedrooms: All Bathrooms: All Lot Size: All
Property Types: Residential Sq Ft: All
Cities: San Francisco
Clarus MarketMetrics® 1 of 2 02/16/2012
Information not guaranteed. © 2012 - 2013 Terradatum and its suppliers and licensors (www.terradatum.com/about/licensors.td).
3 of 20
- 4. Ronny Budiutama Intero Real Estate
Median For Sale vs. Median Sold
Jan-10 vs. Jan-12: The median price of for sale properties is down 12% and the median price of sold properties is down 12%
For Sale # Properties Sold # Properties Price
Time Period Median For Sale Median Sold Difference
Jan-12 659,000 549 619,500 124 -39,500
Dec-11 679,000 590 613,500 226 -65,500
Nov-11 685,000 785 691,000 230 6,000
Oct-11 675,000 977 741,500 200 66,500
Sep-11 685,000 1,023 668,000 205 -17,000
Aug-11 655,000 944 700,000 207 45,000
Jul-11 667,525 980 742,500 202 74,975
Jun-11 680,000 958 745,000 263 65,000
May-11 695,000 897 710,000 220 15,000
Apr-11 699,000 910 701,000 197 2,000
Mar-11 675,950 911 759,500 216 83,550
Feb-11 669,000 812 625,000 123 -44,000
Jan-11 649,000 755 607,500 159 -41,500
Dec-10 659,900 811 705,000 231 45,100
Nov-10 699,000 1,032 755,000 184 56,000
Oct-10 699,000 1,147 731,500 200 32,500
Sep-10 709,000 1,147 710,000 175 1,000
Aug-10 687,500 992 716,500 204 29,000
Jul-10 724,888 1,035 775,000 199 50,112
Jun-10 749,000 1,022 800,000 230 51,000
May-10 792,700 965 745,000 239 -47,700
Apr-10 750,000 1,015 782,000 203 32,000
Mar-10 768,000 893 789,000 221 21,000
Feb-10 774,500 760 695,000 125 -79,500
Jan-10 749,250 664 705,000 121 -44,250
Clarus MarketMetrics® 2 of 2 02/16/2012
Information not guaranteed. © 2012 - 2013 Terradatum and its suppliers and licensors (www.terradatum.com/about/licensors.td).
4 of 20
- 5. Ronny Budiutama Intero Real Estate
Sold Properties by Month
Jan-10 vs. Jan-12: The number of Sold properties is up 2%
Jan-10 vs. Jan-12
Jan-10 Jan-12 Change %
121 124 3 +2%
MLS: SFMLS Period: 2 years (monthly) Price: All Construction Type: All Bedrooms: All Bathrooms: All Lot Size: All
Property Types: Residential Sq Ft: All
Cities: San Francisco
Clarus MarketMetrics® 1 of 2 02/16/2012
Information not guaranteed. © 2012 - 2013 Terradatum and its suppliers and licensors (www.terradatum.com/about/licensors.td).
5 of 20
- 6. Ronny Budiutama Intero Real Estate
Sold Properties by Month
Jan-10 vs. Jan-12: The number of Sold properties is up 2%
Full Market Bank Properties Non-Bank Properties
Time Period # Properties Median Price Average DOM # Properties % Bank Median Price # Properties % Non-Bank Median Price
Jan-12 124 619,500 82 38 30.6 506,500 86 69.3 722,750
Dec-11 226 613,500 63 44 19.5 477,000 182 80.5 688,000
Nov-11 230 691,000 57 36 15.7 432,500 194 84.3 762,750
Oct-11 200 741,500 53 34 17.0 458,500 166 83.0 788,500
Sep-11 205 668,000 65 45 21.9 451,000 160 78.0 737,000
Aug-11 207 700,000 64 44 21.3 434,000 163 78.7 753,500
Jul-11 202 742,500 61 36 17.8 453,000 166 82.2 842,250
Jun-11 263 745,000 58 43 16.4 460,000 220 83.7 767,500
May-11 220 710,000 64 46 20.9 451,000 174 79.1 757,500
Apr-11 197 701,000 67 42 21.3 434,000 155 78.7 825,000
Mar-11 216 759,500 65 44 20.4 462,500 172 79.6 811,000
Feb-11 123 625,000 82 41 33.3 500,000 82 66.7 730,000
Jan-11 159 607,500 71 37 23.3 416,000 122 76.7 657,500
Dec-10 231 705,000 66 39 16.9 482,500 192 83.1 777,000
Nov-10 184 755,000 59 25 13.6 450,000 159 86.4 800,000
Oct-10 200 731,500 56 31 15.5 500,000 169 84.5 770,000
Sep-10 175 710,000 59 35 20.0 460,000 140 80.0 752,000
Aug-10 204 716,500 57 34 16.7 473,500 170 83.3 757,500
Jul-10 199 775,000 58 37 18.6 450,000 162 81.4 826,000
Jun-10 230 800,000 59 35 15.2 568,200 195 84.8 895,000
May-10 239 745,000 56 47 19.7 450,000 192 80.3 796,500
Apr-10 203 782,000 47 42 20.7 490,500 161 79.3 845,000
Mar-10 221 789,000 54 44 19.9 478,500 177 80.1 837,000
Feb-10 125 695,000 62 37 29.6 520,000 88 70.4 750,000
Jan-10 121 705,000 72 32 26.4 556,000 89 73.5 750,000
Clarus MarketMetrics® 2 of 2 02/16/2012
Information not guaranteed. © 2012 - 2013 Terradatum and its suppliers and licensors (www.terradatum.com/about/licensors.td).
6 of 20
- 7. Ronny Budiutama Intero Real Estate
Under Contract Properties by Month
Jan-10 vs. Jan-12: The number of Under Contract properties is up 39%
Jan-10 vs. Jan-12
Jan-10 Jan-12 Change %
127 177 50 +39%
MLS: SFMLS Period: 2 years (monthly) Price: All Construction Type: All Bedrooms: All Bathrooms: All Lot Size: All
Property Types: Residential Sq Ft: All
Cities: San Francisco
Clarus MarketMetrics® 1 of 2 02/16/2012
Information not guaranteed. © 2012 - 2013 Terradatum and its suppliers and licensors (www.terradatum.com/about/licensors.td).
7 of 20
- 8. Ronny Budiutama Intero Real Estate
Under Contract Properties by Month
Jan-10 vs. Jan-12: The number of Under Contract properties is up 39%
Full Market Bank Properties Non-Bank Properties
Time Period # Properties Median Price Average DOM # Properties % Bank Median Price # Properties % Non-Bank Median Price
Jan-12 177 629,000 63 54 30.5 427,450 123 69.5 749,000
Dec-11 157 585,000 72 50 31.9 479,900 107 68.2 685,000
Nov-11 222 599,900 69 56 25.2 439,350 166 74.8 699,000
Oct-11 256 652,000 64 67 26.2 474,000 189 73.8 758,000
Sep-11 222 699,444 59 35 15.8 488,000 187 84.2 779,000
Aug-11 219 675,000 62 50 22.8 432,500 169 77.2 738,000
Jul-11 223 649,888 57 48 21.5 434,778 175 78.5 725,000
Jun-11 222 699,000 63 44 19.8 427,450 178 80.2 762,000
May-11 240 722,000 56 40 16.7 449,000 200 83.3 798,000
Apr-11 216 727,000 58 37 17.1 488,000 179 82.9 788,000
Mar-11 232 698,500 68 65 28.0 439,900 167 72.0 799,000
Feb-11 192 739,000 64 39 20.3 469,900 153 79.7 799,000
Jan-11 149 629,500 82 52 34.9 446,200 97 65.1 699,900
Dec-10 148 629,500 80 42 28.4 416,950 106 71.6 674,500
Nov-10 199 739,000 69 27 13.6 465,300 172 86.4 788,944
Oct-10 210 734,000 58 32 15.2 471,700 178 84.8 798,500
Sep-10 216 731,500 56 39 18.1 480,000 177 81.9 799,000
Aug-10 172 671,400 65 40 23.3 449,450 132 76.7 744,000
Jul-10 202 724,944 60 34 16.8 438,000 168 83.2 799,000
Jun-10 208 709,950 57 36 17.3 491,900 172 82.7 799,000
May-10 204 849,500 59 31 15.2 499,900 173 84.8 950,000
Apr-10 267 719,000 53 51 19.1 450,000 216 80.9 773,500
Mar-10 224 771,500 47 39 17.4 474,900 185 82.6 799,000
Feb-10 192 769,000 51 40 20.8 407,000 152 79.2 837,000
Jan-10 127 699,000 66 37 29.1 479,900 90 70.9 767,000
Clarus MarketMetrics® 2 of 2 02/16/2012
Information not guaranteed. © 2012 - 2013 Terradatum and its suppliers and licensors (www.terradatum.com/about/licensors.td).
8 of 20
- 9. Ronny Budiutama Intero Real Estate
New Properties by Month
Jan-10 vs. Jan-12: The number of New properties is down 15%
Jan-10 vs. Jan-12
Jan-10 Jan-12 Change %
270 229 -41 -15%
MLS: SFMLS Period: 2 years (monthly) Price: All Construction Type: All Bedrooms: All Bathrooms: All Lot Size: All
Property Types: Residential Sq Ft: All
Cities: San Francisco
Clarus MarketMetrics® 1 of 2 02/16/2012
Information not guaranteed. © 2012 - 2013 Terradatum and its suppliers and licensors (www.terradatum.com/about/licensors.td).
9 of 20
- 10. Ronny Budiutama Intero Real Estate
New Properties by Month
Jan-10 vs. Jan-12: The number of New properties is down 15%
Full Market Bank Properties Non-Bank Properties
Time Period # Properties Median Price # Properties % Bank Median Price # Properties % Non-Bank Median Price
Jan-12 229 629,000 59 25.8 420,000 170 74.2 744,000
Dec-11 119 555,000 45 37.8 476,000 74 62.2 629,000
Nov-11 148 673,000 39 26.4 459,999 109 73.7 749,000
Oct-11 260 681,500 52 20.0 401,875 208 80.0 727,500
Sep-11 397 735,000 74 18.6 449,000 323 81.4 798,000
Aug-11 288 649,000 58 20.1 472,450 230 79.9 717,500
Jul-11 330 692,000 62 18.8 492,450 268 81.2 738,500
Jun-11 349 698,000 78 22.4 427,450 271 77.7 775,000
May-11 279 699,000 65 23.3 430,000 214 76.7 761,500
Apr-11 293 779,000 43 14.7 475,000 250 85.3 849,500
Mar-11 345 699,000 75 21.7 439,900 270 78.3 798,500
Feb-11 287 695,000 72 25.1 450,550 215 74.9 799,000
Jan-11 274 686,500 69 25.2 467,500 205 74.8 750,000
Dec-10 103 560,000 46 44.7 494,450 57 55.3 695,000
Nov-10 198 656,944 64 32.3 414,800 134 67.7 797,000
Oct-10 320 699,500 44 13.8 467,450 276 86.2 768,500
Sep-10 458 799,000 63 13.8 460,900 395 86.2 849,000
Aug-10 277 650,000 54 19.5 444,750 223 80.5 699,000
Jul-10 316 699,000 63 19.9 479,400 253 80.1 749,000
Jun-10 337 699,000 55 16.3 474,500 282 83.7 799,000
May-10 306 749,000 57 18.6 459,000 249 81.4 829,000
Apr-10 407 750,000 78 19.2 451,950 329 80.8 849,000
Mar-10 379 759,000 68 17.9 534,950 311 82.1 799,000
Feb-10 297 789,000 60 20.2 507,722 237 79.8 849,000
Jan-10 270 770,000 57 21.1 480,200 213 78.9 799,888
Clarus MarketMetrics® 2 of 2 02/16/2012
Information not guaranteed. © 2012 - 2013 Terradatum and its suppliers and licensors (www.terradatum.com/about/licensors.td).
10 of 20
- 11. Ronny Budiutama Intero Real Estate
For Sale Properties by Month
Jan-10 vs. Jan-12: The number of For Sale properties is down 17%
Jan-10 vs. Jan-12
Jan-10 Jan-12 Change %
664 549 -115 -17%
MLS: SFMLS Period: 2 years (monthly) Price: All Construction Type: All Bedrooms: All Bathrooms: All Lot Size: All
Property Types: Residential Sq Ft: All
Cities: San Francisco
Clarus MarketMetrics® 1 of 2 02/16/2012
Information not guaranteed. © 2012 - 2013 Terradatum and its suppliers and licensors (www.terradatum.com/about/licensors.td).
11 of 20
- 12. Ronny Budiutama Intero Real Estate
For Sale Properties by Month
Jan-10 vs. Jan-12: The number of For Sale properties is down 17%
Full Market Bank Properties Non-Bank Properties
Time Period # Properties Median Price Average DOM # Properties % Bank Median Price # Properties % Non-Bank Median Price
Jan-12 549 659,000 79 148 27.0 450,000 401 73.0 749,000
Dec-11 590 679,000 97 156 26.4 475,500 434 73.6 749,000
Nov-11 785 685,000 85 185 23.6 459,000 600 76.4 749,000
Oct-11 977 675,000 74 236 24.2 459,450 741 75.8 749,000
Sep-11 1,023 685,000 69 241 23.6 469,900 782 76.4 759,000
Aug-11 944 655,000 76 239 25.3 459,900 705 74.7 749,000
Jul-11 980 667,525 72 252 25.7 449,925 728 74.3 750,000
Jun-11 958 680,000 74 251 26.2 435,000 707 73.8 785,000
May-11 897 695,000 74 220 24.5 448,944 677 75.5 799,000
Apr-11 910 699,000 72 213 23.4 450,000 697 76.6 799,000
Mar-11 911 675,950 72 253 27.8 449,000 658 72.2 795,000
Feb-11 812 669,000 79 233 28.7 459,900 579 71.3 795,000
Jan-11 755 649,000 92 230 30.5 449,975 525 69.5 770,000
Dec-10 811 659,900 104 227 28.0 435,000 584 72.0 779,000
Nov-10 1,032 699,000 86 230 22.3 437,450 802 77.7 789,000
Oct-10 1,147 699,000 73 212 18.5 450,000 935 81.5 779,000
Sep-10 1,147 709,000 68 227 19.8 463,500 920 80.2 789,000
Aug-10 992 687,500 77 233 23.5 459,000 759 76.5 750,000
Jul-10 1,035 724,888 73 231 22.3 474,500 804 77.7 799,000
Jun-10 1,022 749,000 69 224 21.9 472,232 798 78.1 828,500
May-10 965 792,700 65 215 22.3 476,000 750 77.7 879,000
Apr-10 1,015 750,000 60 233 23.0 468,000 782 77.0 862,000
Mar-10 893 768,000 62 205 23.0 478,000 688 77.0 858,000
Feb-10 760 774,500 67 186 24.5 445,750 574 75.5 875,000
Jan-10 664 749,250 83 183 27.6 453,321 481 72.4 869,000
Clarus MarketMetrics® 2 of 2 02/16/2012
Information not guaranteed. © 2012 - 2013 Terradatum and its suppliers and licensors (www.terradatum.com/about/licensors.td).
12 of 20
- 13. Ronny Budiutama Intero Real Estate
Expired Properties by Month
Jan-10 vs. Jan-12: The number of Expired properties is down 43%
Jan-10 vs. Jan-12
Jan-10 Jan-12 Change %
74 42 -32 -43%
MLS: SFMLS Period: 2 years (monthly) Price: All Construction Type: All Bedrooms: All Bathrooms: All Lot Size: All
Property Types: Residential Sq Ft: All
Cities: San Francisco
Clarus MarketMetrics® 1 of 2 02/16/2012
Information not guaranteed. © 2012 - 2013 Terradatum and its suppliers and licensors (www.terradatum.com/about/licensors.td).
13 of 20
- 14. Ronny Budiutama Intero Real Estate
Expired Properties by Month
Jan-10 vs. Jan-12: The number of Expired properties is down 43%
Full Market Bank Properties Non-Bank Properties
Time Period # Properties Median Price Average DOM # Properties % Bank Median Price # Properties % Non-Bank Median Price
Jan-12 42 624,450 118 11 26.2 430,000 31 73.8 849,000
Dec-11 113 770,000 118 17 15.0 490,000 96 85.0 797,000
Nov-11 92 669,000 99 18 19.6 459,450 74 80.4 761,500
Oct-11 84 629,750 101 23 27.4 450,000 61 72.6 725,000
Sep-11 84 668,500 104 22 26.2 402,500 62 73.8 731,944
Aug-11 99 772,191 92 22 22.2 449,419 77 77.8 800,000
Jul-11 101 699,000 91 23 22.8 435,000 78 77.2 785,500
Jun-11 86 769,000 107 17 19.8 399,000 69 80.2 850,000
May-11 48 784,000 108 7 14.6 434,900 41 85.4 850,000
Apr-11 76 676,500 113 21 27.6 425,000 55 72.4 788,000
Mar-11 62 652,750 106 18 29.0 499,500 44 71.0 764,000
Feb-11 54 622,000 116 16 29.6 479,500 38 70.4 799,000
Jan-11 81 699,000 118 17 21.0 409,000 64 79.0 779,000
Dec-10 182 799,000 115 24 13.2 421,000 158 86.8 843,500
Nov-10 125 738,000 108 22 17.6 488,500 103 82.4 789,000
Oct-10 103 695,000 95 14 13.6 446,000 89 86.4 729,000
Sep-10 104 749,000 106 20 19.2 564,500 84 80.8 750,000
Aug-10 131 799,000 101 29 22.1 479,900 102 77.9 899,000
Jul-10 118 848,500 89 18 15.2 468,700 100 84.8 897,500
Jun-10 95 788,000 98 20 21.1 458,950 75 79.0 879,000
May-10 76 744,000 77 15 19.7 459,000 61 80.3 895,000
Apr-10 89 749,000 87 24 27.0 490,000 65 73.0 850,000
Mar-10 61 849,000 77 11 18.0 488,888 50 82.0 891,500
Feb-10 54 742,000 90 9 16.7 665,000 45 83.3 779,000
Jan-10 74 799,000 142 20 27.0 550,000 54 73.0 897,000
Clarus MarketMetrics® 2 of 2 02/16/2012
Information not guaranteed. © 2012 - 2013 Terradatum and its suppliers and licensors (www.terradatum.com/about/licensors.td).
14 of 20
- 15. Ronny Budiutama Intero Real Estate
Supply & Demand by Month
Jan-10 vs. Jan-12: The number of for sale properties is down 17% and the number of sold properties is up 2%
Jan-10 vs. Jan-12 Jan-10 vs. Jan-12
Jan-10 Jan-12 Change % Jan-10 Jan-12 Change %
664 549 -115 -17% 121 124 3 +2%
MLS: SFMLS Period: 2 years (monthly) Price: All Construction Type: All Bedrooms: All Bathrooms: All Lot Size: All
Property Types: Residential Sq Ft: All
Cities: San Francisco
Clarus MarketMetrics® 1 of 2 02/16/2012
Information not guaranteed. © 2012 - 2013 Terradatum and its suppliers and licensors (www.terradatum.com/about/licensors.td).
15 of 20
- 16. Ronny Budiutama Intero Real Estate
Supply & Demand by Month
Jan-10 vs. Jan-12: The number of for sale properties is down 17% and the number of sold properties is up 2%
# Properties Average DOM # Properties Average DOM
Time Period For Sale For Sale Sold Sold
Jan-12 549 79 124 82
Dec-11 590 97 226 63
Nov-11 785 85 230 57
Oct-11 977 74 200 53
Sep-11 1,023 69 205 65
Aug-11 944 76 207 64
Jul-11 980 72 202 61
Jun-11 958 74 263 58
May-11 897 74 220 64
Apr-11 910 72 197 67
Mar-11 911 72 216 65
Feb-11 812 79 123 82
Jan-11 755 92 159 71
Dec-10 811 104 231 66
Nov-10 1,032 86 184 59
Oct-10 1,147 73 200 56
Sep-10 1,147 68 175 59
Aug-10 992 77 204 57
Jul-10 1,035 73 199 58
Jun-10 1,022 69 230 59
May-10 965 65 239 56
Apr-10 1,015 60 203 47
Mar-10 893 62 221 54
Feb-10 760 67 125 62
Jan-10 664 83 121 72
Clarus MarketMetrics® 2 of 2 02/16/2012
Information not guaranteed. © 2012 - 2013 Terradatum and its suppliers and licensors (www.terradatum.com/about/licensors.td).
16 of 20
- 17. Ronny Budiutama Intero Real Estate
The Average Days on Market by Month
Jan-10 vs. Jan-12: The average days on market is down 4%
Jan-10 vs. Jan-12
Jan-10 Jan-12 Change %
66 63 -2 -4%
MLS: SFMLS Period: 2 years (monthly) Price: All Construction Type: All Bedrooms: All Bathrooms: All Lot Size: All
Property Types: Residential Sq Ft: All
Cities: San Francisco
Clarus MarketMetrics® 1 of 2 02/16/2012
Information not guaranteed. © 2012 - 2013 Terradatum and its suppliers and licensors (www.terradatum.com/about/licensors.td).
17 of 20
- 18. Ronny Budiutama Intero Real Estate
The Average Days on Market by Month
Jan-10 vs. Jan-12: The average days on market is down 4%
Time Period Average DOM # UC Units
Jan-12 63 177
Dec-11 72 157
Nov-11 69 222
Oct-11 64 256
Sep-11 59 222
Aug-11 62 219
Jul-11 57 223
Jun-11 63 222
May-11 56 240
Apr-11 58 216
Mar-11 68 232
Feb-11 64 192
Jan-11 82 149
Dec-10 80 148
Nov-10 69 199
Oct-10 58 210
Sep-10 56 216
Aug-10 65 172
Jul-10 60 202
Jun-10 57 208
May-10 59 204
Apr-10 53 267
Mar-10 47 224
Feb-10 51 192
Jan-10 66 127
Clarus MarketMetrics® 2 of 2 02/16/2012
Information not guaranteed. © 2012 - 2013 Terradatum and its suppliers and licensors (www.terradatum.com/about/licensors.td).
18 of 20
- 19. Ronny Budiutama Intero Real Estate
Months Supply of Inventory
Jan-10 vs. Jan-12: The average months supply of inventory is down 49%
Jan-10 vs. Jan-12
Jan-10 Jan-12 Change %
3.6 1.9 -1.8 -49%
MLS: SFMLS Period: 2 years (monthly) Price: All Construction Type: All Bedrooms: All Bathrooms: All Lot Size: All
Property Types: Residential Sq Ft: All
Cities: San Francisco
Clarus MarketMetrics® 1 of 2 02/16/2012
Information not guaranteed. © 2012 - 2013 Terradatum and its suppliers and licensors (www.terradatum.com/about/licensors.td).
19 of 20
- 20. Ronny Budiutama Intero Real Estate
Months Supply of Inventory
Jan-10 vs. Jan-12: The average months supply of inventory is down 49%
# Units For Sale # UC Units UC Average
Time Period Last Day of Month During Month MSI DOM
Jan-12 330 177 1.9 63
Dec-11 320 157 2.0 72
Nov-11 471 222 2.1 69
Oct-11 637 256 2.5 64
Sep-11 717 222 3.2 59
Aug-11 626 219 2.9 62
Jul-11 656 223 2.9 57
Jun-11 650 222 2.9 63
May-11 609 240 2.5 56
Apr-11 618 216 2.9 58
Mar-11 617 232 2.7 68
Feb-11 566 192 2.9 64
Jan-11 525 149 3.5 82
Dec-10 481 148 3.2 80
Nov-10 708 199 3.6 69
Oct-10 834 210 4.0 58
Sep-10 827 216 3.8 56
Aug-10 689 172 4.0 65
Jul-10 715 202 3.5 60
Jun-10 719 208 3.5 57
May-10 685 204 3.4 59
Apr-10 659 267 2.5 53
Mar-10 608 224 2.7 47
Feb-10 514 192 2.7 51
Jan-10 463 127 3.6 66
Clarus MarketMetrics® 2 of 2 02/16/2012
Information not guaranteed. © 2012 - 2013 Terradatum and its suppliers and licensors (www.terradatum.com/about/licensors.td).
20 of 20