SlideShare ist ein Scribd-Unternehmen logo
1 von 8
Downloaden Sie, um offline zu lesen
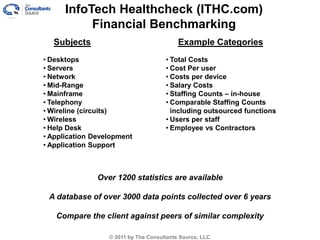
InfoTech Healthcheck (ITHC.com)
           Financial Benchmarking
  Subjects                                 Example Categories
• Desktops                            • Total Costs
• Servers                             • Cost Per user
• Network                             • Costs per device
• Mid-Range                           • Salary Costs
• Mainframe                           • Staffing Counts – in-house
• Telephony                           • Comparable Staffing Counts
• Wireline (circuits)                   including outsourced functions
• Wireless                            • Users per staff
• Help Desk                           • Employee vs Contractors
• Application Development
• Application Support


               Over 1200 statistics are available

 A database of over 3000 data points collected over 6 years

   Compare the client against peers of similar complexity

                  © 2011 by The Consultants Source, LLC
Financial Benchmarking
                     Example Statistics
•Cost Per User                         •Hardware Percent of Cost
•Total User Count                      •Software Percent of Cost
•Total Direct Costs                    •Staffing Percent of Cost
•Hardware Cost Per User                •Transmission Percent of Cost
•Software Cost Per User                •Facilities Percent of Cost
•Staffing Cost Per User                •Outsourcing Percent of Cost
•Transmission Cost Per User            •Average Cost Per Staff
•Facilities Cost Per User              •Average Cost Per Management
•Sourcing Cost Per User                 Staff
•Total Hardware Cost                   •Average Cost Per Desktop
•Total Software Cost                    Support Staff
•Total Staffing Cost                   •Average Cost Per Training Staff
•Total Transmission Cost               •Average Cost Per Plan & Process
•Total Facilities Cost                  Staff
•Total Outsourcing Cost


                     © 2011 by The Consultants Source, LLC
Financial Benchmarking Results
   Comparison of Total IT costs compared against
          Peers, Industry, and Averages


         © 2011 by The Consultants Source, LLC
Financial Benchmarking Results
 Comparison of IT Cost per User compared against
         Peers, Industry, and Averages


        © 2011 by The Consultants Source, LLC
Financial Benchmarking Results
 Comparison of Client IT costs compared against Peers,
   Industry, and Averages by Subject and key Metrics


          © 2011 by The Consultants Source, LLC
Financial Benchmarking Results
     Comparison of Client IT Complexity


     © 2011 by The Consultants Source, LLC
Putting It All Together

                                           “STATISTICS and                          “WHAT/HOW TO
  “WHAT and WHERE”                         COMPARISONS”                                IMPROVE”
 Financial Management:                        Financial                             IT Best Practices
                                            Benchmarking:                                Audit:


  SERVICE                                 COST            PEER                 BASELINE              BEST
  COSTING         BILL OF IT                           COMPARISONS             CURRENT             PRACTICES
                                        STATISTICS                              STATE

                   SERVICE              QUANTIFY
BUDGETING &        QUALITY              FINANCIAL                               PEER               WHAT/HOW
FORECASTING            &               OPPORTUNITY                           COMPARISONS          TO IMPROVE
                  UTILIZATION


                                          CONSULTING PARTNERS


                                    TECHNOLOGY ECONOMICS PARTNERS


              © 2011 by The Consultants Source, LLC www.TheConsultantsSource.com   312-835-4742
Thank You!

           Questions?

      More Information:
WWW.TheConsultantsSource.com

Info@TheConsultantsSource.com

         312-835-4742


       © 2011 by The Consultants Source, LLC

Weitere ähnliche Inhalte

Andere mochten auch

Kasus benchmarking
Kasus benchmarkingKasus benchmarking
Kasus benchmarkinganitalistia
 
Construction Future Wales Performance Management (Benchmarking) 2016
Construction Future Wales Performance Management (Benchmarking) 2016Construction Future Wales Performance Management (Benchmarking) 2016
Construction Future Wales Performance Management (Benchmarking) 2016Rae Davies
 
Hotel benchmarking
Hotel benchmarkingHotel benchmarking
Hotel benchmarkingJohn Sutton
 

Andere mochten auch (6)

Kasus benchmarking
Kasus benchmarkingKasus benchmarking
Kasus benchmarking
 
Colored Benchmarking Diagrams
Colored Benchmarking DiagramsColored Benchmarking Diagrams
Colored Benchmarking Diagrams
 
Construction Future Wales Performance Management (Benchmarking) 2016
Construction Future Wales Performance Management (Benchmarking) 2016Construction Future Wales Performance Management (Benchmarking) 2016
Construction Future Wales Performance Management (Benchmarking) 2016
 
Coca Cola Vs Pepsi
Coca Cola Vs PepsiCoca Cola Vs Pepsi
Coca Cola Vs Pepsi
 
Hotel benchmarking
Hotel benchmarkingHotel benchmarking
Hotel benchmarking
 
Benchmarking
BenchmarkingBenchmarking
Benchmarking
 

Ähnlich wie IT Financial Benchmarking Content And Reports

Behind the Curtain of IT Cost Transparency - By: Carl Stumpf Managing Directo...
Behind the Curtain of IT Cost Transparency - By: Carl Stumpf Managing Directo...Behind the Curtain of IT Cost Transparency - By: Carl Stumpf Managing Directo...
Behind the Curtain of IT Cost Transparency - By: Carl Stumpf Managing Directo...Melissa Luongo
 
Presentation from State of Iowa's Cost Transparency Journey at ITFM Week 2014
Presentation from State of Iowa's Cost Transparency Journey at ITFM Week 2014Presentation from State of Iowa's Cost Transparency Journey at ITFM Week 2014
Presentation from State of Iowa's Cost Transparency Journey at ITFM Week 2014Apptio
 
IDC White Paper (Sony Interviewee) - Role & Benefits of Quality in Delivering...
IDC White Paper (Sony Interviewee) - Role & Benefits of Quality in Delivering...IDC White Paper (Sony Interviewee) - Role & Benefits of Quality in Delivering...
IDC White Paper (Sony Interviewee) - Role & Benefits of Quality in Delivering...Anthony J. Gutierrez
 
The IT Chargeback Journey
The IT Chargeback JourneyThe IT Chargeback Journey
The IT Chargeback JourneyPete Hidalgo
 
IT Operations with the Mainframe: How the State of Oregon has created Custome...
IT Operations with the Mainframe: How the State of Oregon has created Custome...IT Operations with the Mainframe: How the State of Oregon has created Custome...
IT Operations with the Mainframe: How the State of Oregon has created Custome...CA Technologies
 
Nesma autumn conference - the gains of unit based pricing - Sytse van der Schaaf
Nesma autumn conference - the gains of unit based pricing - Sytse van der SchaafNesma autumn conference - the gains of unit based pricing - Sytse van der Schaaf
Nesma autumn conference - the gains of unit based pricing - Sytse van der SchaafNesma
 
Justifying capacity management by demonstrating the return on investment
Justifying capacity management by demonstrating the return on investmentJustifying capacity management by demonstrating the return on investment
Justifying capacity management by demonstrating the return on investmentMetron
 
Justifying capacity management by demonstrating the return on investment
Justifying capacity management by demonstrating the return on investmentJustifying capacity management by demonstrating the return on investment
Justifying capacity management by demonstrating the return on investmentMetron
 
Webcast 24 Feb 12 - TCO of Payroll Delivery_Final
Webcast 24 Feb 12 - TCO of Payroll Delivery_FinalWebcast 24 Feb 12 - TCO of Payroll Delivery_Final
Webcast 24 Feb 12 - TCO of Payroll Delivery_FinalRudi De Roeck
 
What’s your score? Using XLAs to quantify service experience
What’s your score? Using XLAs to quantify service experienceWhat’s your score? Using XLAs to quantify service experience
What’s your score? Using XLAs to quantify service experiencenexthink
 
IBM RACEv - Ferramenta para análise técnico e financeira para Plataforma Main...
IBM RACEv - Ferramenta para análise técnico e financeira para Plataforma Main...IBM RACEv - Ferramenta para análise técnico e financeira para Plataforma Main...
IBM RACEv - Ferramenta para análise técnico e financeira para Plataforma Main...Anderson Bassani
 
Considering EDI-as-a-Service? 10 Best Practices to Guide Your Decision
Considering EDI-as-a-Service? 10 Best Practices to Guide Your DecisionConsidering EDI-as-a-Service? 10 Best Practices to Guide Your Decision
Considering EDI-as-a-Service? 10 Best Practices to Guide Your DecisionCleo
 
Encoursa Webinar: Advanced Indirect Rates
Encoursa Webinar: Advanced Indirect RatesEncoursa Webinar: Advanced Indirect Rates
Encoursa Webinar: Advanced Indirect RatesRobert E Jones
 
Cloud economics webinar 230317
Cloud economics webinar 230317Cloud economics webinar 230317
Cloud economics webinar 230317Krishnan K ☁
 
Cloud Economics and calculating CTO - AWSome Day Zurich 112016
Cloud Economics and calculating CTO - AWSome Day Zurich 112016Cloud Economics and calculating CTO - AWSome Day Zurich 112016
Cloud Economics and calculating CTO - AWSome Day Zurich 112016Amazon Web Services
 
Making driver-based planning and budgeting work
Making driver-based planning and budgeting workMaking driver-based planning and budgeting work
Making driver-based planning and budgeting workAnaplan
 
SafeNet EMS Showcase: Today's Evolving Licensing Landscape
SafeNet EMS Showcase: Today's Evolving Licensing LandscapeSafeNet EMS Showcase: Today's Evolving Licensing Landscape
SafeNet EMS Showcase: Today's Evolving Licensing Landscapeguestab2d72b
 
SafeNet EMS Showcase: Ingredients for an Evolution
SafeNet EMS Showcase: Ingredients for an EvolutionSafeNet EMS Showcase: Ingredients for an Evolution
SafeNet EMS Showcase: Ingredients for an Evolutionguestab2d72b
 

Ähnlich wie IT Financial Benchmarking Content And Reports (20)

Behind the Curtain of IT Cost Transparency - By: Carl Stumpf Managing Directo...
Behind the Curtain of IT Cost Transparency - By: Carl Stumpf Managing Directo...Behind the Curtain of IT Cost Transparency - By: Carl Stumpf Managing Directo...
Behind the Curtain of IT Cost Transparency - By: Carl Stumpf Managing Directo...
 
SampleProject1
SampleProject1SampleProject1
SampleProject1
 
Presentation from State of Iowa's Cost Transparency Journey at ITFM Week 2014
Presentation from State of Iowa's Cost Transparency Journey at ITFM Week 2014Presentation from State of Iowa's Cost Transparency Journey at ITFM Week 2014
Presentation from State of Iowa's Cost Transparency Journey at ITFM Week 2014
 
IDC White Paper (Sony Interviewee) - Role & Benefits of Quality in Delivering...
IDC White Paper (Sony Interviewee) - Role & Benefits of Quality in Delivering...IDC White Paper (Sony Interviewee) - Role & Benefits of Quality in Delivering...
IDC White Paper (Sony Interviewee) - Role & Benefits of Quality in Delivering...
 
The IT Chargeback Journey
The IT Chargeback JourneyThe IT Chargeback Journey
The IT Chargeback Journey
 
IT Operations with the Mainframe: How the State of Oregon has created Custome...
IT Operations with the Mainframe: How the State of Oregon has created Custome...IT Operations with the Mainframe: How the State of Oregon has created Custome...
IT Operations with the Mainframe: How the State of Oregon has created Custome...
 
Nesma autumn conference - the gains of unit based pricing - Sytse van der Schaaf
Nesma autumn conference - the gains of unit based pricing - Sytse van der SchaafNesma autumn conference - the gains of unit based pricing - Sytse van der Schaaf
Nesma autumn conference - the gains of unit based pricing - Sytse van der Schaaf
 
Justifying capacity management by demonstrating the return on investment
Justifying capacity management by demonstrating the return on investmentJustifying capacity management by demonstrating the return on investment
Justifying capacity management by demonstrating the return on investment
 
Justifying capacity management by demonstrating the return on investment
Justifying capacity management by demonstrating the return on investmentJustifying capacity management by demonstrating the return on investment
Justifying capacity management by demonstrating the return on investment
 
Webcast 24 Feb 12 - TCO of Payroll Delivery_Final
Webcast 24 Feb 12 - TCO of Payroll Delivery_FinalWebcast 24 Feb 12 - TCO of Payroll Delivery_Final
Webcast 24 Feb 12 - TCO of Payroll Delivery_Final
 
What’s your score? Using XLAs to quantify service experience
What’s your score? Using XLAs to quantify service experienceWhat’s your score? Using XLAs to quantify service experience
What’s your score? Using XLAs to quantify service experience
 
IBM RACEv - Ferramenta para análise técnico e financeira para Plataforma Main...
IBM RACEv - Ferramenta para análise técnico e financeira para Plataforma Main...IBM RACEv - Ferramenta para análise técnico e financeira para Plataforma Main...
IBM RACEv - Ferramenta para análise técnico e financeira para Plataforma Main...
 
Considering EDI-as-a-Service? 10 Best Practices to Guide Your Decision
Considering EDI-as-a-Service? 10 Best Practices to Guide Your DecisionConsidering EDI-as-a-Service? 10 Best Practices to Guide Your Decision
Considering EDI-as-a-Service? 10 Best Practices to Guide Your Decision
 
Encoursa Webinar: Advanced Indirect Rates
Encoursa Webinar: Advanced Indirect RatesEncoursa Webinar: Advanced Indirect Rates
Encoursa Webinar: Advanced Indirect Rates
 
Cloud economics webinar 230317
Cloud economics webinar 230317Cloud economics webinar 230317
Cloud economics webinar 230317
 
Crystal Qube™ Presentation
Crystal Qube™ PresentationCrystal Qube™ Presentation
Crystal Qube™ Presentation
 
Cloud Economics and calculating CTO - AWSome Day Zurich 112016
Cloud Economics and calculating CTO - AWSome Day Zurich 112016Cloud Economics and calculating CTO - AWSome Day Zurich 112016
Cloud Economics and calculating CTO - AWSome Day Zurich 112016
 
Making driver-based planning and budgeting work
Making driver-based planning and budgeting workMaking driver-based planning and budgeting work
Making driver-based planning and budgeting work
 
SafeNet EMS Showcase: Today's Evolving Licensing Landscape
SafeNet EMS Showcase: Today's Evolving Licensing LandscapeSafeNet EMS Showcase: Today's Evolving Licensing Landscape
SafeNet EMS Showcase: Today's Evolving Licensing Landscape
 
SafeNet EMS Showcase: Ingredients for an Evolution
SafeNet EMS Showcase: Ingredients for an EvolutionSafeNet EMS Showcase: Ingredients for an Evolution
SafeNet EMS Showcase: Ingredients for an Evolution
 

IT Financial Benchmarking Content And Reports

  • 1. InfoTech Healthcheck (ITHC.com) Financial Benchmarking Subjects Example Categories • Desktops • Total Costs • Servers • Cost Per user • Network • Costs per device • Mid-Range • Salary Costs • Mainframe • Staffing Counts – in-house • Telephony • Comparable Staffing Counts • Wireline (circuits) including outsourced functions • Wireless • Users per staff • Help Desk • Employee vs Contractors • Application Development • Application Support Over 1200 statistics are available A database of over 3000 data points collected over 6 years Compare the client against peers of similar complexity © 2011 by The Consultants Source, LLC
  • 2. Financial Benchmarking Example Statistics •Cost Per User •Hardware Percent of Cost •Total User Count •Software Percent of Cost •Total Direct Costs •Staffing Percent of Cost •Hardware Cost Per User •Transmission Percent of Cost •Software Cost Per User •Facilities Percent of Cost •Staffing Cost Per User •Outsourcing Percent of Cost •Transmission Cost Per User •Average Cost Per Staff •Facilities Cost Per User •Average Cost Per Management •Sourcing Cost Per User Staff •Total Hardware Cost •Average Cost Per Desktop •Total Software Cost Support Staff •Total Staffing Cost •Average Cost Per Training Staff •Total Transmission Cost •Average Cost Per Plan & Process •Total Facilities Cost Staff •Total Outsourcing Cost © 2011 by The Consultants Source, LLC
  • 3. Financial Benchmarking Results Comparison of Total IT costs compared against Peers, Industry, and Averages © 2011 by The Consultants Source, LLC
  • 4. Financial Benchmarking Results Comparison of IT Cost per User compared against Peers, Industry, and Averages © 2011 by The Consultants Source, LLC
  • 5. Financial Benchmarking Results Comparison of Client IT costs compared against Peers, Industry, and Averages by Subject and key Metrics © 2011 by The Consultants Source, LLC
  • 6. Financial Benchmarking Results Comparison of Client IT Complexity © 2011 by The Consultants Source, LLC
  • 7. Putting It All Together “STATISTICS and “WHAT/HOW TO “WHAT and WHERE” COMPARISONS” IMPROVE” Financial Management: Financial IT Best Practices Benchmarking: Audit: SERVICE COST PEER BASELINE BEST COSTING BILL OF IT COMPARISONS CURRENT PRACTICES STATISTICS STATE SERVICE QUANTIFY BUDGETING & QUALITY FINANCIAL PEER WHAT/HOW FORECASTING & OPPORTUNITY COMPARISONS TO IMPROVE UTILIZATION CONSULTING PARTNERS TECHNOLOGY ECONOMICS PARTNERS © 2011 by The Consultants Source, LLC www.TheConsultantsSource.com 312-835-4742
  • 8. Thank You! Questions? More Information: WWW.TheConsultantsSource.com Info@TheConsultantsSource.com 312-835-4742 © 2011 by The Consultants Source, LLC