Enhancing and Restoring Safety & Quality Cultures - Dave Litwiller - May 2024...
Anatomy of a market decline: Why it pays to think long term
1. Anatomy of a Market Decline
Market declines Since 1926, the S&P 500 has dropped by 10% or more on 15 different occasions and 20% or
can be unsettling more on eight occasions. During each of these declines, nervous investors have worried and
for investors wondered if the stock market could ever recover after falling so far in such a short amount of
time. Despite a lot of negative talk and pessimism from so-called financial experts claiming,
“Well!! THIS time it’s different!,” the market has always rebounded to new highs. Sure, in
many cases it took more patience and time to get back lost gains, but in each case we did.
It is tough to keep perspective and focus on the big picture during difficult times like these.
Considering the points below can help prevent you from making rash or emotional decisions.
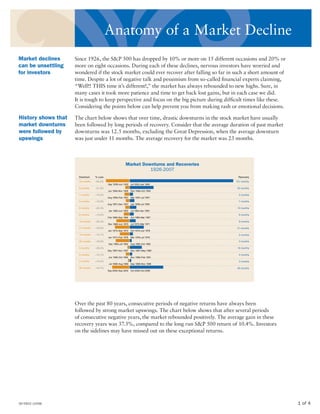
History shows that The chart below shows that over time, drastic downturns in the stock market have usually
market downturns been followed by long periods of recovery. Consider that the average duration of past market
were followed by downturns was 12.5 months, excluding the Great Depression, when the average downturn
upswings was just under 11 months. The average recovery for the market was 23 months.
Market Downturns and Recoveries
1926-2007
Over the past 80 years, consecutive periods of negative returns have always been
followed by strong market upswings. The chart below shows that after several periods
of consecutive negative years, the market rebounded positively. The average gain in these
recovery years was 37.3%, compared to the long run S&P 500 return of 10.4%. Investors
on the sidelines may have missed out on these exceptional returns.
1 of 4
92-0602 (1008)
2. Periods of Consecutive Negative Stock Returns
1926-2007
Some investors may take pause about investing while the economy is in a recession. The U.S.
Investors have
economy has gone through ten recessions in the past 50 years. Looking back at past stock
benefited from
performance during recessions, we see that stocks always came back quickly, even during times
investing during
when the economy was officially in a recession. According to Birinyi Associates, stocks tend to
a recession
hit the bottom two-thirds of the way into a recession. This pattern demonstrates that selling
out of positions while in a recession would be an ill-advised strategy that would cause investors
to miss the post-recession market correction.
Post recession stock performance has also shown exceptional returns over time for both small
and large stocks.
Stock Performance During Recessions
1946-2007
Hypothetical value
of $1 invested at
the beginning of
1946. Assumes
reinvestment of
income and no
transaction costs
or taxes. This is
for illustrative
purposes only and
not indicative of
any investment. An
investment cannot
be made directly to
an index.
2 of 4
3. Stock Performance After Recessions
1945-2007
Cumulative
returns of large
and small stocks
after recessions
1945-2007. This
is for illustrative
purposes only and
not indicative of
any investment. An
investment cannot
be made directly
in an index.
Troubling economic The recent decline in the stock market should serve as a reminder that, historically, some of the best
times can prove times to have entered the market have been during extremely dark periods with high volatility:
good for investors • The best five-year return in the S&P 500 since 1926, actually started during the Great
over time Depression when stocks rallied 367% from May 1932 to May 1937.
• The second best five-year period began in 1982, during an economy experiencing one of its
worst recessions since World War II and featuring double-digit levels of unemployment.
• The third period occurred during the 1994 Federal Reserve rate tightening that sent the dollar in
a downward spiral.
Three Best Periods to Enter the U.S. Stock Market
Since 1926
Great Depression
Largest Fed
Worst recession in Tightening in
367% a quarter century 20 Years
267%
251%
May 1932 July 1982 December 1994
Subsequent 5-Year Return
Source: Morningstar Encorr
3 of 4