Call Girl Lucknow Mallika 7001305949 Independent Escort Service Lucknow
2009 Ritmos Circadianos Y Adipositos Obe
1. nature publishing group articles
adipocyte Biology
Circadian Rhythm of Clock Genes
in Human Adipose Explants
Cecilia Gómez-Santos1, Purificación Gómez-Abellán1, Juan A. Madrid1, Juan J. Hernández-Morante1,
Juan A. Lujan2, José M. Ordovas3 and Marta Garaulet1
To analyze in severely obese women the circadian expression of the clock genes hPer2, hBmal1, and hCry1 in
explants from subcutaneous (SAT) and visceral (VAT) adipose tissue (AT), in order to elucidate whether this circadian
clockwork can oscillate accurately and independently of the suprachiasmatic nucleus (SCN) and if glucocorticoid
metabolism-related genes such as glucocorticoid receptor (hGr) and 11β-hydroxysteroid dehydrogenase 1 (h11βHsd1)
and the transcription factor peroxisome proliferator activated receptor γ (hPPARγ) are part of the clock controlled
genes. AT biopsies were obtained from morbid obese patients (BMI ≥40 kg/m2) (n = 7). Anthropometric variables were
measured and fasting plasma lipids and lipoprotein concentrations were analyzed. In order to carry out rhythmic
expression analysis, AT explants were cultured during 24 h and gene expression was performed at the following times
(T): 0, 6, 12, and 18 h, with quantitative real-time PCR. Clock genes oscillated accurately and independently of the
SCN in AT explants. Their intrinsic oscillatory mechanism regulated the timing of other genes such as hPPARγ and
glucocorticoid-related genes. Circadian patterns differed between VAT and SAT. Correlation analyses between the
genetic circadian oscillation and components of the metabolic syndrome (MetS) revealed that subjects with a higher
sagittal diameter showed an increased circadian variability in hPer2 expression (r = 0.91; P = 0.031) and hBmal1
(r = 0.90; P = 0.040). Data demonstrate the presence of peripheral circadian oscillators in human AT independently of
the central circadian control mechanism. This knowledge paves the way for a better understanding of the circadian
contribution to medical conditions such as obesity and MetS.
Obesity (2009) doi:10.1038/oby.2009.164
IntroductIon The objective of the present research was to analyze the
Circadian rhythms are ingrained in our lives; however, little circadian expression of the clock genes hPer2, hBmal1 and hCry1
attention has been paid to their metabolic consequences. It has in AT explants from morbid obese women from subcutaneous
been suggested that disruption of the circadian system may be (SAT) and visceral (VAT) AT, in order to elucidate whether this
related to expression of the metabolic syndrome (MetS) (1). circadian clockwork can oscillate accurately and independently
Thus, shift work, sleep deprivation and exposure to bright light of the SCN and if glucocorticoid metabolism-related genes such
at night have been shown to be related to increased adiposity as that glucocorticoid receptor (hGr) and 11β-hydroxysteroid
and prevalence of MetS (1,2). dehydrogenase 1 (h11βHsd1) and the master transcription
Recent findings support the notion that rhythmic factor peroxisome proliferator activated receptor γ (hPPARγ)
expression of circadian genes exists not only in the brain are controlled by clock genes.
but in several other tissues (3,4). Along these lines, we have
shown clock gene expression in human adipose tissue (AT) Methods and Procedures
(5) and demonstrated that this expression was associated subjects
with different components of the MetS (5). An important VAT and SAT abdominal AT biopsies were obtained from severely
question is whether this circadian clockwork can oscillate obese women (n = 7), age: 49 ± 10 years, and BMI: 43.6 ± 5.2 kg/m2,
undergoing laparoscopic gastric bypass surgery due to obesity, from the
accurately and independently of the suprachiasmatic nucleus General Surgery Service of “Virgen de la Arrixaca” Hospital. The day
(SCN) in human AT and whether other genes are controlled before the surgery all patients were synchronized having lunch at 1430
by this process. hours and having dinner at 2100 hours. The AT biopsies were taken
Department of Physiology, University of Murcia, Murcia, Spain; 2General Surgery Service, University Hospital “Virgen de la Arrixaca,” Murcia, Spain;
1
Jean Mayer US Department of Agriculture Human Nutrition Research Center on Aging, Tufts University School of Medicine, Boston, Massachusetts, USA.
3
Correspondence: Marta Garaulet (garaulet@um.es)
Received 13 March 2009; accepted 28 April 2009; advance online publication 28 May 2009. doi:10.1038/oby.2009.164
obesity 1
2. articles
adipocyte Biology
as paired samples from the two AT depots: VAT (omental) and SAT at which the peak of a rhythm occurs, expressed in hours). Differences
(abdominal) at the beginning of the surgical procedure (estimated time in rhythmicity among the genes studied and between AT depots were
of biopsies sampling from 1000 to 1400 hours). analyzed comparing the amplitude and the % of variance by ANOVA
The protocols were approved by the Ethics Committee of the “Virgen and paired t-test. The significance of the rhythms was determined by
de la Arrixaca” University Hospital, and the subjects signed a written rejection of the zero amplitude hypotheses with a threshold of 60%. All
informed consent before the biopsies were obtained. statistical analyses were carried out using SPSS for windows (release
15.0; SPSS, Chicago, IL). The level of significance for all statistical tests
clinical characteristics and hypotheses was set at P < 0.05.
BMI, waist and hip circumference, and skinfolds (biceps, triceps,
results
suprailiac, and subscapular) were measured with a Harpenden caliper
(Holtain, Crymych, UK). Total body fat (%) was measured by bio- characteristics of the population and basal gene expression
impedance with a TANITA Model TBF-300 (TANITA Corporation Table 1 contains general characteristics of the women studied.
of America, Arlington Heights, IL). Sagittal diameter and coronal The average values for waist circumference, glucose, and
diameter were measured at the level of the iliac crest (L4–5) using a systolic pressure exceeded the cutoff points proposed by the
Holtain Kahn Abdominal Caliper. Fasting Plasma concentrations of
International Diabetes Federation (8) for the definition of
triacylglycerols, total cholesterol, high-density lipoprotein, and low-
density lipoprotein cholesterol were determined with commercial kits MetS.
(Roche Diagnostics, Mannheim, Germany). Arterial pressure was Basal gene expression for the genes under investigation, was
also measured. similar for both SAT and VAT depots. Analysis of the relations
among genes within each of the groups (Clock genes and other
at culture
functional genes) showed significant and positive correlations
Explants were placed at 37 °C for 24 h in a humidified atmosphere
containing 7% CO2 in 100 mm diameter dishes. AT (800–1,000 mg) was in the SAT (P < 0.05). However, these significant correlations
placed in 5 ml of Dulbecco’s modified Eagle’s medium supplemented were absent within the VAT. Furthermore, when we analyzed
with 10% fetal bovine serum. the relation between the expression of clock genes and MetS
On the next day, the adipose explants were collected to perform gene features, we found that hPer2 expression in SAT correlated
expression analysis at the following times (T): 0, 6, 12, and 18 in which T0
negatively with BMI (r = −0.86; P = 0.048) and with thigh
was arbitrarily defined as 0800 hours, because this was the usual waking
time for patients, T6 as 1400 hours, T12 as 2000 hours, and T18 as 0200 circumference (r = −0.93; P = 0.024) whereas hBmal1 showed
hours. All cultures were performed in duplicates. significant correlation with body fat variables (r = −0.92; P =
0.011), total cholesterol (r = −0.99; P = 0.002), low-density
analysis of gene expression lipoprotein Cholesterol (r = −0.97; P = 0.006), and glucose
Reverse transcription was performed using random hexamers as primers
concentrations (r = −0.89; P = 0.041).
and Thermoscript reverse transcriptase (Invitrogen, Cergy-Pontoise,
France) with 1 μg total RNA for each sample.
Quantitative real-time PCR was performed using an ABI PRISM 7900
HT Sequence Detection System as described by the provider (Applied table 1 clinical characteristics of the population studied
Biosystems, Foster City, CA). PCR Master MIX (Perkin-Elmer, Norwalk, Patients (n = 7)
CT) containing Hot Start Taq DNA polymerase was used. Taqman probes
for hPer2, hBmal1, hCry1 and 18S rRNA as internal control were also Age (year) 49 ± 10
supplied by Applied Biosystems (Assay-by-Design). All samples were Weight (kg) 107.90 ± 10.18
determined as duplicates, and for a negative control the same setup was
Height (cm) 157.57 ± 5.13
used except for the addition of reverse transcriptase. No PCR product
was detected under these latter conditions. In brief, clock genes mRNA BMI (kg/m2) 43.57 ± 5.16
and 18S RNA were amplified in separated wells at 95 °C for 10 min and Body fat (%) 44.03 ± 6.00
thereafter repeating cycles comprised of 95 °C for 30 s and 60 °C for 60 s
for annealing and extension steps. During the extension step increase in WC (cm) 126.66 ± 7.15
fluorescence was measured in real-time. HC (cm) 136.37 ± 10.30
Data were obtained as Ct values according to the manufacturer’s
guidelines, and used to determine ΔCt values (ΔCt = Ct of the target WHR 0.93 ± 0.06
gene—Ct of the housekeeping gene (18S)) of each sample. Fold changes Sagittal diameter (cm) 22.64 ± 4.23
of gene expression were calculated by the 2−ΔΔCt method (6).
Coronal diameter (cm) 31.21 ± 3.59
statistical analysis VA/SApredicted 0.65 ± 0.29
Clinical and anthropometric data are presented as means ± s.d. The Cholesterol (mg/dl) (mmol/l) 163.18 ± 46.01 (4.22 ± 1.19)
results for gene expression, expressed in arbitrary units, are pre-
sented as means ± s.e.m. Paired t-test was used for comparing data Triglycerides (mg/dl) (mmol/l) 87.68 ± 33.65 (0.99 ± 0.38)
from the samples derived from the two adipose depots in each indi- HDL-cholesterol(mg/dl) (mmol/l) 50.27 ± 8.89 (1.30 ± 0.23)
vidual subject.
The single cosinor method was used to analyze for circadian rhythm LDL-cholesterol(mg/dl) (mmol/l) 109.04 ± 38.66 (2.82 ± 1.00)
individually and as a group (7). This inferential method involves fitting Glucose (mg/dl) (mmol/l) 106.64 ± 16.03 (5.92 ± 0.89)
a curve of a predefined period by the least squares method. The rhythm
Systolic pressure (mm Hg) 144.28 ± 23.70
characteristics and their 95% confidence intervals estimated by this
method include the mesor (middle value of the fitted cosine repre- Diastolic pressure (mm Hg) 72.86 ± 12.53
senting a rhythm-adjusted mean), the amplitude (half the difference Data are presented as means ± s.d.
between the minimum and maximum of the fitted cosine function), WC, Waist circumference; HC, Hip circumference; WHR, waist-to-hip ratio;
and the temporal location of maximum value or acrophase (the time VA/SApredicted, Visceral Area/subcutaneous Areapredicted.
2 www.obesityjournal.org
3. articles
adipocyte Biology
a hPer2 b hPpary
50 12 (1.02)
(0.68)
Relative expression (AU)
Relative expression (AU)
40 (0.77) 10
(1.94)
30 (0.49) 8
20 6
(1.48) (.42) (1.21) (0.81) (0.44)
10 (1.01) 4
0 (0.42) (0.60) 2
(0.33) (0.94) (1.16)
−10 0
0 6 12 18 0 6 12 18
Zeitgeber time (h) Zeitgeber time (h)
(1.26) hBmal1 h11βHsd1
10 12
Relative expression (AU)
Relative expression (AU)
(0.43) (1.10)
8 (0.26) 10
(0.98) (0.45)
6 8
(0.28)
4 (0.84) 6
(1.27) (0.49)
(0.45)
2 4 (0.40)
(0.17) (0.31) (0.40)
0 2
(0.77)
−2 0
0 6 12 18 0 6 12 18
Zeitgeber time (h) Zeitgeber time (h)
hCry1 hGr
3.5 (0.61) 10 (1.64)
(0.88)
Relative expression (AU)
Relative expression (AU)
3
8
2.5 (0.63) (0.71)
2 (0.21)
6
(0.33)
1.5 (0.47) 4 (1.32)
1 (0.43) (0.45) (0.33) (1.44)
(2.84)
2
0.5 (0.61) (0.44)
0 0
0 6 12 18 0 6 12 18
Zeitgeber time (h) Zeitgeber time (h)
Visceral adipose tissue
Subcutaneous adipose tissue
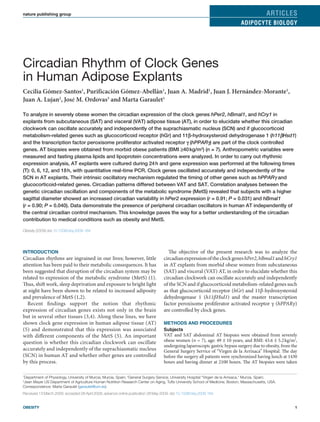
Figure 1 Circadian rhythms of all genes studied in total population. Rhythmic expression of clock genes (hPer2, hBmal1, and hCry1) (a) and other
functional genes in human adipose tissue (hPPARγ, h11βHsd1, and hGr) (b) in both subcutaneous and visceral tissues. Adipose depots were isolated
at 6-h intervals over the course of the day from adipose tissue cultures (time at 0, 6, 12, and 18 hours). Results are presented relative to the lowest
basal relative expression for each gene. Data of relative expression are represented as Arbitrary Units (AU).Data are reported as means ± s.e.m.
(s.e.m. of ΔCt are represented in parenthesis).
circadian gene expression Phase map of the genes studied
Figure 1 shows mean circadian rhythms for the three clock Figure 2 shows phase map of gene expression for clock genes and
genes (Figure 1a) as well as for the other AT functional genes other functional genes. Average acrophases (the time at which
studied (hPPARγ, hGr, and h11βHsd1) (Figure 1b). We have the peak of a rhythm occurs, expressed in hours) imputed from
observed circadian expression patterns for all the genes (data cosinor analysis of hPer2, hBmal1, hCry1, hPPARγ, h11βHsd1
recently published for glucocorticoid metabolism-related and and hGr were plotted against 24 h-time scale. An interesting
PPARγ genes (9)) investigated in these subjects except for the finding was that clock genes anticipated in their expression to
housekeeping gene 18S. Parameters imputed from each sub- the other genes implicated both, SAT (P = 0.003) and VAT AT
ject obtained by cosinor analysis (7) defining the circadian (P = 0.01) metabolism. The response of hPPARγ, h11βHsd1,
rhythms as mesor, amplitude, acrophase and percentage of and hGr to the action of clock genes seemed to be faster in VAT
variance are shown in Supplementary Table S1 online. These than in SAT (11.3 h vs. 16.3 h, respectively).
data indicate that among the clock genes examined, hPer2
was the one showing the highest circadian oscillation (P = dIscussIon
0.001), followed by hCry1 and hBmal1. hBmal1 oscillated We have demonstrated in human AT the presence of active
with approximately the same phase as hPer2. In addition, circadian clock mechanisms and confirmed their periodic
VAT showed a higher cadence than SAT for all the genes nature. An important consideration is that this rhythm persists
examined. ex vivo for at least two circadian cycles after surgery. These results
Correlation analyses between the genetic circadian oscillation are consistent with previously reported findings for clock genes
(amplitude) and components of the MetS revealed that those in cells extracted from other tissues (10–13). The persistency of
subjects with a higher sagittal diameter showed an increased gene expression oscillations in vitro strongly suggests the exist-
circadian variability in hPer2 SAT expression (r = 0.91; P = ence of an intracellular circadian clock system directly regulat-
0.031) and hBmal1 (r = 0.90; P = 0.040). ing local cell functions (14). Previously, we provided evidence of
obesity 3
4. articles
adipocyte Biology
a −6 0 6 12 18 24 30 b −6 0 6 12 18 24 30 on Bmal1 transcription through their activity on retinoic
acid–related orphan receptor response elements . PPARα also
hPparγ hPparγ
induces Bmal1 and Rev-Erbα transcription through its action
h11βHsd1 h11βHsd1 on PPRE located in their respective promoters. Most of these
hGr hGr
genes are highly regulated by fatty acids and are implicated
in AT metabolism. Therefore, we could hypothesize that AT
hPer2 hPer2
could present an especial circadian behavior influenced by its
hBmal1 hBmal particular characteristics such as: fat cell size and number, fatty
hCry1 hCry1 acid composition, etc. Further studies focusing on these genes
expression in human AT will be necessary.
Acrophase (h) Acrophase (h) Our results are at odds with “ex vivo” analyses of circadian
gene expression in synchronized cultures of human adipose-
Figure 2 Phase map of genes studied in both subcutaneous and derived cells (21). One important difference between both
visceral tissues. Acrophases imputed from cosinor analyses of all genes
studied in subcutaneous (a) and visceral (b) depots for total population.
studies is that we performed our study in severely obese
Values are shown as mean ± s.d. for clock genes (squares) and other women, whereas in Wu et al. study women were normal
functional genes (diamonds). weight (21). As has been previously demonstrated chronodis-
ruption could be present in these obese subjects, explaining
clock genes expression and demonstrated that it was associated discrepancies (22). Other interesting difference is that in the
with different components of MetS (5). However, it remained current study, primary AT cells were used, in contrast to the
to be elucidated whether this circadian clockwork could oscil- study of Wu et al. which was performed in secondary cultures
late accurately and independently of the SCN in human AT, and of adipose-derived stem cells.
which other genes were controlled in this process. It has been established that VAT adiposity is more closely asso-
An interesting observation obtained from the present work ciated with the MetS than SAT adiposity. In the present work
was that 24 h rhythmic expression patterns was observed VAT behaves remarkably different from SAT. Expression of the
for all the genes investigated, except for the housekeeping genes examined showed significant correlation in SAT; however,
gene (18S), suggesting their potential role in the circadian no such correlation was apparent in VAT. These results resemble
machinery in human AT. Among the clock genes studied, those previously reported for some clock genes (5). Moreover,
hPer2 was the gene with the highest oscillation pattern. our data show that the rhythm of the genes studied was more
Similar results were obtained in AT from other diurnal and robust in VAT than in SAT fat depot, consistent with previous
nocturnal mammals (15,16). data in mice (14). Glucocorticoids are circadian key hormones
Our current data in women are consistent with our previous strongly implicated in the MetS physiopathology (23). Recently,
findings in men showing an inverse relationship between basal it has been demonstrated that glucocorticoids genes show cir-
hPer2 expression and obesity parameters (5). The fact that cir- cadian patterns (9). One of objective of the present study was to
cadian oscillations of hPer2 were positively related with sagittal elucidate if glucocorticoids genes circadian expression could be
diameter strongly supports a role for hPer2 in the physiological in some way related to clock genes behavior in human AT. Our
disturbances leading to the MetS (5). results indicate that hGr and h11βHsd together with hPPARγ,
The hBmal1 gene also showed significant correlations with oscillated in antiphase in extra- and intra-abdominal depots
components of the MetS, both in terms of its basal expres- (9), suggesting that the internal circadian regulation of each fat
sion and in its rhythm. Bmal1 has been shown to play essen- depot metabolism could act in a region dependent manner.
tial roles in the regulation of adipocyte differentiation and Moreover, when acrophases, time at which the peak of a
lipogenesis (17,18). rhythm occurs, for the genes analyzed were plotted against
An important aspect of circadian regulation is that rhythms 24-h time scale, we observed the presence of two markedly
are expressed in a particular phase relationship to one another. different groups: one for the clock genes and the other for
With respect to hBmal1, our data show that this clock gene hPPARγ, hGr and hHsd. From these results we could hypoth-
oscillated with approximately the same phase as hPer2, esize that hPPARγ and glucocorticoids genes are associated to
instead of being antiphasic as anticipated from data previously clock genes (24). It has been reported that hPPARγ can directly
obtained in other peripheral tissues (19). This unusual phase regulate the transcription of clock genes (25). Further studies
relationship has also been previously described. Similar results focusing on the regulatory circadian mechanisms and tran-
have been obtained in human peripheral blood mononuclear scriptional targets of hPPARγ, especially those related with
cells (19) and in mouse bone marrow (20). It is essential to note energy balance and lipoprotein metabolism (26) may pro-
that in addition to Per2 and Cry1, other genes are involved in vide insights into the pathogenesis of MetS. Interesting, the
the regulation of Bmal1 in the molecular circadian oscillator. response to the action of clock genes in VAT preceded that in
Indeed, a secondary stabilizing loop is established by the nega- SAT by 7 h, suggesting an AT site specific differential response
tive, orphan nuclear hormone receptor that is encoded on the to the clock genes output signals. The one weakness of this
noncoding strand of the thyroid hormone receptor α-gene, study is the limited number of patients included, which is due
and positive, retinoic acid–related orphan receptor-α effect to the considerable difficulties in obtaining enough fat from
4 www.obesityjournal.org