Withdrawals in retirement may limit how long your savings last.
•
0 likes•2,010 views


Recommended
Recommended
More Related Content
More from Putnam Investments
More from Putnam Investments (20)
Recently uploaded
Recently uploaded (20)
Withdrawals in retirement may limit how long your savings last.
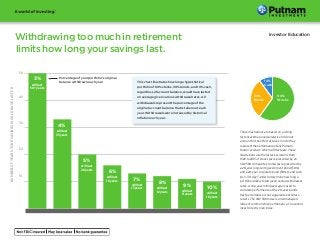
- 1. These illustrations are based on a rolling historical time period analysis and do not account for the effect of taxes, nor do they representtheperformanceofanyPutnam fundor product, which will fluctuate. These illustrations use the historical returns from 1926 to 2013 of stocks (as represented by an S&P 500 composite), bonds (as represented by a 20-year long-term government bond (50%) and a 20-year corporate bond (50%)), and cash (U.S. 30-day T-bills) to determine how long a portfolio is likely to last given various withdrawal rates. A one-year rolling average is used to calculate performance of the 20-year bonds. Past performance is not a guarantee of future results. The S&P 500 Index is an unmanaged index of common stock performance. You cannot invest directly in an index. 0 10 20 30 40 50 50 40 30 20 10 Percentage of your portfolio’s original balance withdrawn each year NUMBEROFYEARSYOURSAVINGSWOULDHAVELASTED 3% willlast 50+years 4% willlast 33years 5% willlast 20years 6% willlast 16years 7% willlast 13years 8% willlast 12years 9% willlast 11years 10% willlast 10years This chart illustrates how long a hypothetical portfolio of 60% stocks, 30% bonds, and 10% cash, regardless of account balance, would have lasted on average given various withdrawal rates. All withdrawals represent the percentage of the original account balance that is taken out each year. Withdrawals were increased by historical inflation each year. Withdrawing too much in retirement limits how long your savings last. Investor Education 60% Stocks 30% Bonds 10% Cash
- 2. The chart below shows how various asset allocations affected a portfolio’s expected longevity. It assumes that 5% of the original account balance was withdrawn each year and that withdrawals were increased by historical inflation each year. Investing too conservativelyinretirement may limit how long your savings last. These illustrations are based on a rolling historical time period analysis and do not account for the effect of taxes, nor do they representtheperformanceofanyPutnamfund or product, which will fluctuate. These illustrations use the historical returns from 1926 to 2013 of stocks (as represented by an S&P 500 composite), bonds (as represented by a 20-year long-term government bond (50%) and a 20-year corporate bond (50%)), and cash (U.S. 30-day T-bills) to determine how long a portfolio is likely to last given various withdrawal rates. A one-year rolling average is used to calculate performance of the 20-year bonds. Past performance is not a guarantee of future results. The S&P 500 Index is an unmanaged index of common stock performance. You cannot invest directly in an index. Investors should carefully consider the investment objectives, risks, charges, and expenses of a fund before investing. For a prospectus, or a summary prospectus if available, containing this and other information for any Putnam fund or product, call your financial representativeorcallPutnamat 1-800-225-1581. Please read the prospectus carefully before investing. LIKELIHOOD YOUR PORTFOLIO WOULD HAVE LASTED 80%–100% 60%–79% 0%–59% PORTFOLIO TYPE ALLOCATION 20 YEARS 30 YEARS 40 YEARS Conservative 20% Stocks 50% Bonds 30% Cash 89% 28% 3% Balanced 60% Stocks 30% Bonds 10% Cash 96% 76% 53% Growth 80% Stocks 20% Bonds 0% Cash 96% 79% 67% Putnam Retail Management Putnam Investments | One Post Office Square | Boston, MA 02109 | putnam.comII788 286237 2/14