Putnam Perspectives: Equity Outlook Q3 2014
•
1 gefällt mir•2,306 views

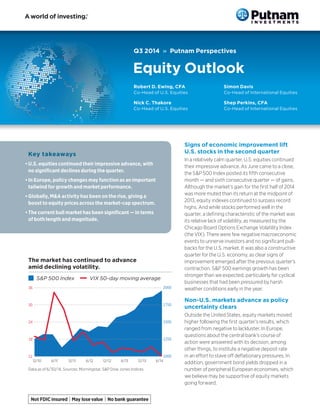
U.S. equities continued their impressive advance, with no significant declines during the quarter. In Europe, policy changes may function as an important tailwind for growth and market performance. Globally, M&A activity has been on the rise, giving a boost to equity prices across the market-cap spectrum. The current bull market has been significant — in terms of both length and magnitude.

Empfohlen
Empfohlen
Weitere ähnliche Inhalte
Was ist angesagt?
Was ist angesagt? (20)
Ähnlich wie Putnam Perspectives: Equity Outlook Q3 2014
Ähnlich wie Putnam Perspectives: Equity Outlook Q3 2014 (20)
Mehr von Putnam Investments
Mehr von Putnam Investments (20)
Kürzlich hochgeladen
Kürzlich hochgeladen (20)
Putnam Perspectives: Equity Outlook Q3 2014
- 1. Q3 2014 » Putnam Perspectives Equity Outlook Key takeaways • U.S. equities continued their impressive advance, with no significant declines during the quarter. • In Europe, policy changes may function as an important tailwind for growth and market performance. • Globally, M&A activity has been on the rise, giving a boost to equity prices across the market-cap spectrum. • The current bull market has been significant — in terms of both length and magnitude. Signs of economic improvement lift U.S. stocks in the second quarter In a relatively calm quarter, U.S. equities continued their impressive advance. As June came to a close, the S&P 500 Index posted its fifth consecutive month — and sixth consecutive quarter — of gains. Although the market’s gain for the first half of 2014 was more muted than its return at the midpoint of 2013, equity indexes continued to surpass record highs. And while stocks performed well in the quarter, a defining characteristic of the market was its relative lack of volatility, as measured by the Chicago Board Options Exchange Volatility Index (the VIX). There were few negative macroeconomic events to unnerve investors and no significant pull- backs for the U.S. market. It was also a constructive quarter for the U.S. economy, as clear signs of improvement emerged after the previous quarter’s contraction. S&P 500 earnings growth has been stronger than we expected, particularly for cyclical businesses that had been pressured by harsh weather conditions early in the year. Non-U.S. markets advance as policy uncertainty clears Outside the United States, equity markets moved higher following the first quarter’s results, which ranged from negative to lackluster. In Europe, questions about the central bank’s course of action were answered with its decision, among other things, to institute a negative deposit rate in an effort to stave off deflationary pressures. In addition, government bond yields dropped in a number of peripheral European economies, which we believe may be supportive of equity markets going forward. The market has continued to advance amid declining volatility. n S&P 500 Index — VIX 50-day moving average 1000 1250 1500 1750 2000 12 18 24 30 36 12/10 12/11 6/12 12/126/11 6/146/13 12/13 Data as of 6/30/14. Sources: Morningstar, S&P Dow Jones Indices. Robert D. Ewing, CFA Co-Head of U.S. Equities Nick C. Thakore Co-Head of U.S. Equities Simon Davis Co-Head of International Equities Shep Perkins, CFA Co-Head of International Equities
- 2. 2 Q3 2014 | Equity Outlook The continued low-interest-rate environment, in our view, is a significant factor behind the market’s improved performance. In addition, we saw better growth in some developed markets than we have seen over the past three to four years, which has helped to boost investor confi- dence. The growth may not have been as dramatic as some observers were hoping, but it’s still better than we have seen for some time. U.S. equities For U.S. markets, the notable theme was a lack of notable themes For yet another quarter, investors saw no significant pullback in the U.S. equity market. In fact, it has been 32 months since the market has had a decline of 10% or more — the standard definition of a correction. This secular bull market is also notable for its magnitude; stocks have appreciated to a greater extent than during many previous runs. In the relatively quiet market environment year to date, the energy and utility sectors have outperformed, while financials, telecommunications, and consumer sectors have lagged. For the U.S. economy in the second quarter, we began to see clear signs of improvement after the first-quarter contraction, which had been driven to a large extent by harsh winter weather. Considering the weak start to the year, corporate earnings development has been construc- tive. After a two-year period in which earnings growth essentially moved sideways, we are starting to see year- over-year advances again. First-quarter S&P 500 earnings growth was in the mid-single-digit range — higher than our expectations. Perhaps even more important is that earnings expectations for the remainder of 2014 have not changed, an encouraging trend considering the soft first quarter. Another positive factor is the tremendous amount of merger-and-acquisition activity in today’s market, with many accretive deals — that is, deals that should boost earnings growth. A healthy resurgence in M&A activity bodes well for equities In April, the value of announced 2014 mergers and acqui- sitions worldwide topped $1 trillion — only the third time it has passed that level so early in the year, according to Reuters. Also, in addition to the increased activity, stocks of acquiring companies are outperforming, which has not been the case in the past few years. A likely reason is that equity investors, seeking growth opportunities, believe that these deals will be accretive and can stimulate growth for the companies and the economy. Market scorecard Select equity index performance as of 6/30/14 Index name Q2 2014 (cumulative) 1 year 3 years (annualized) 5 years (annualized) 10 years (annualized) MSCI EM Index (ND) 6.60% 14.31% -0.39% 9.24% 11.94% S&P 500 Index 5.23 24.61 16.58 18.83 7.78 Russell 1000 Value Index 5.10 23.81 16.92 19.23 8.03 MSCI World Index (ND) 4.86 24.05 11.81 14.99 7.25 MSCI EAFE Index (ND) 4.09 23.57 8.10 11.77 6.93 MSCI Europe Index (ND) 3.30 29.28 8.67 13.03 7.54 Russell 2000 Growth Index 1.72 24.73 14.49 20.50 9.04 Sources: S&P Dow Jones Indices, MSCI. Quarterly gains were strong and broad-based.
- 3. PUTNAM INVESTMENTS | putnam.com 3 U.S. merger and acquisition spending on the rise n Deal volume (announced deals) — Aggregate deal value 1/13 2/13 3/13 4/13 5/13 6/13 7/13 8/13 9/13 10/13 11/13 12/13 1/14 2/14 3/14 4/14 U.S. merger and acquisition spending on the rise Source: FactSet. ■ Deal Volume (announced deals) ■ Aggregate Deal Value (USD Billions, right-hand side) $300B 250 200 150 100 50 0 1,200 1,000 800 600 400 200 0 Source: FactSet. With most deals today, we are finding the acquisitions to be natural strategic extensions for the businesses. The deals can create synergies that make the resulting companies more productive and efficient, and as long as the buyer isn’t overpaying, they are generally positive for equity investors. Another factor driving M&A activity is the perception that interest rates, which have been low for years, might rise — potentially in the near future. CEOs and corporate boardrooms are realizing that the most attrac- tive deal-financing windows are open now, but maybe they won’t be open or as attractive for long. Keeping an eye on valuations We remain watchful for sectors or stocks whose valua- tions may have become stretched, particularly in light of the market’s multi-year rally. Within the Russell 1000 Growth universe, for example, there has been a subset of momentum growth stocks whose valuations advanced to unreasonable levels, and many of these stocks have corrected sharply. In most cases, we believe the selloffs were not the result of company-specific problems. When- ever declines are unrelated to fundamentals, it can create opportunity. In this growth-momentum area, we are focused on finding companies with strong growth poten- tial combined with valuations that are more reasonable following the declines. Elsewhere in the equity market, dividend-paying stocks have made a strong performance comeback in 2014. To the surprise of almost every investor, interest rates, as measured by the yield of the 10-year Treasury, have fallen since the end of 2013. As a result, investors have been favoring stocks of companies that pay dividends as well as those that have the potential to grow their dividends. Over the past five years, we have seen a significant number of U.S. companies begin to pay a dividend, and the market tends to reward companies that do so. We saw more dividend initiations in the first quarter of 2014 than in the first quarter of 2013, which was a record year for dividend initiations. A more cautious approach for 2014’s second half From a fundamental perspective, U.S. economic growth is accelerating, the corporate earnings outlook is solid, and valuations remain reasonable, particularly considering the level of interest rates. As for sentiment, some indica- tors suggest that investors have become more bullish, but statistics continue to show that, overall, investors remain underexposed to equities. The current bull market has been significant — in terms of both length and magni- tude — and some areas of the market could be described as frothy. Investors need to be mindful of the market’s run, and as we look to the second half of the year, our approach is slightly more conservative than it has been in recent quarters. Acquirers are faring well as M&A activity gathers steam.
- 4. 4 Q3 2014 | Equity Outlook Non-U.S. equities European stimulus a net benefit for stocks Outside the United States, better growth returned in the second quarter and a variety of uncertainties diminished, leading to improved market performance. In early June, the European Central Bank made the first in what could potentially be a series of policy decisions to stimulate the economy and reduce the risk of deflation. As expected, the ECB cut its key refinancing rate from 0.25% to a new historic low of 0.15%. Also, it took the unprecedented step of instituting a negative deposit rate of -0.10%, which would effectively charge banking institutions a fee to park money at the ECB. By making this move, the ECB hopes to encourage banks to lend more and thereby get more capital working in the economy, but it is an experimental measure that has yet to be tested on a large scale. Targeted measures to boost growth Another measure that we believe could potentially be quite helpful was the ECB’s implementation of targeted long-term refinancing operations [TLTROs], which are also designed to encourage lending and stimulate growth. Clearly, ECB actions can have a meaningful impact on the share prices of banks as well as the markets in general. For equity portfolios with a pro-cyclical bias, this could trans- late into highly positive news. The introduction of TLTROs will allow banks to borrow funds from the ECB for four years at a very low cost. This will be especially beneficial to peripheral European banks, which have typically had to borrow at much higher rates. This will enable the banks to lend money at relatively low rates to consumers and corporate entities and still make an attractive profit on the spread between those rates and their TLTRO funding cost. A number of European banks, particularly in Spain and Italy, performed well in the second quarter — both because of the TLTRO announcement and because government borrowing costs declined during the period, which had a positive effect on the banks. Will corporations take the funding bait? At a recent financial-market conference in Madrid, many companies acknowledged that TLTROs could be quite helpful. But they also suggested there is a credit demand problem in the market — that is, too few corporations are confident enough in the economic recovery to borrow more at this stage. After all, just because the ECB has announced it is ready to hand out money at low cost doesn’t mean European corporations will start lining up to borrow. Again, the ECB is trying new measures to stimu- late the economy. We consider these promising avenues but by no means a guaranteed cure. Nevertheless, if demand for credit picks up, then we think at some point TLTRO funding could become extremely attractive to lending institutions. Reforms in Japan are moving slowly In Japan, a consumption tax hike was implemented at the start of the second quarter. While there is fear that this will be a headwind, early signs suggests that any nega- tive impact on the economy has been muted. It is also worth pointing out that while the tax went from 5% to 8% in April, this is just the beginning. Policymakers plan to raise it again in October 2015 from 8% to 10%, depending on the economy’s condition. In any case, the earnings momentum of Japanese companies is still strong, in our view, and the exporters stand to benefit from the relatively weak yen. Setting records for record-setting Since 1968, the market has hit new highs in 24 different years.* Of those years with record-setting closes, the median number of days that saw a new high is 22, and only six years saw the market reach a new high more than 40 times. The year 2013 was one of those six years, and 2014 — with 22 record closes through June 30 — could be on track to be number 7. Years with highest number of record-setting market closes (since 1968) 1985: 43 1997: 45 1987: 46 1998: 47 1995: 77 2013: 45 1Based on daily close for S&P 500 Index, April 18, 1968–June 30, 2014.
- 5. PUTNAM INVESTMENTS | putnam.com 5 The Bank of Japan, too, has been waiting to see what effects the tax hike produces before the BoJ delivers any further rounds of monetary easing. All of this policy- related change is rather slow-moving, of course, as is the so-called “third arrow” of the government’s structural reform agenda. In our view, the latter has become more of a growth strategy, in which we expect to see a gradual reduction of corporate tax rates and the creation of special economic zones. The latter will likely take the form of geographical locations in which businesses will have greater flexibility in hiring and firing, for example, and where much-needed growth in institutions like teaching hospitals may be able to occur. The emerging market rally: memorable moment or enduring trend? The second quarter saw emerging-market assets make a strong advance. However, with the possible exceptions of India, Indonesia, and Mexico, which have implemented painful reforms, we think most emerging markets still run the risk of funding problems if U.S. interest rates rise, which we expect will happen. Countries such as Turkey, South Africa, and Brazil are contending with different forms of structural fragility, including rising current account deficits and interest rates that may be too low relative to inflation. The rally has indeed been strong in a variety of emerging markets, but the trend could easily reverse as foreign capital becomes a flight risk if U.S. rates tick higher. Challenges to China’s growth China appears to be relatively fragile due to its credit bubble that has been building for quite some time. At the moment, the government is walking a tightrope between not deflating this bubble too quickly and transitioning the economy away from being over-reliant on exports toward domestic consumption. When the authorities worry about slowing growth, they have tended to announce measures that are perceived to stimulate the economy to maintain a minimum 7% growth rate, but the downside risks remain. As an export-manufacturing base, for example, China has arguably been overtaken by Mexico, given rampant wage cost inflation in China. In addition, China’s recent crackdown on corruption may carry unforeseen negative consequences for growth. Recent heightened attention on state officials’ patronage of Macau casinos, for example, has led to a marked drop in VIP gambling. To the extent China slows, that can have an outsized impact on regional trade among other devel- oping economies in Asia. While we think it is most likely that China will achieve something close to a 7% growth rate, the challenges to the country’s economic transition raise the potential that China may disappoint, despite healthy growth figures. Valuation and dividend yield As of 6/30/14 Index 12-month trailing P/E 12-month forward P/E Dividend yield S&P 500 Index 22.31 15.43 2.01% MSCI EAFE Index 19.44 13.06 3.24% MSCI World Index 20.59 14.51 2.52% Sources: S&P Dow Jones Indices, MSCI. Non-U.S. stocks are somewhat cheaper than their U.S. counterparts.
- 6. Opportunities outweigh risks outside the United States We feel that international stocks offer numerous opportunities to investors at the present time. Valuations, earnings recoveries, and restructuring opportunities all continue to make the case for international stock investing fairly compelling. We believe gradual healing for Europe is under way. With positive external factors, including improving U.S. growth, stable Chinese growth, and incrementally recovering global corporate confidence, our outlook for Europe and other developed-market equities is quite positive. We are attentive to the risks posed by various political transitions in emerging-market countries such as India, Indonesia, and Brazil. Political regime change is rarely a seamless process, so there is room for economic and market disappointments. Also, while growth appears stable in China, markets tend to be sensitive to any signs of softer economic data in this country. Other geopolitical risks remain. The situation in Ukraine, for example, has effectively become a civil war. Iraq, too, is in crisis, as is South Sudan, where ethnic tensions have similarly destabilized economic progress and political coherence. Having said that, although geopolitical crises appear to have become the norm, the opportunities in international stocks outweigh many of the risks, in our view. Index definitions The Chicago Board Options Exchange (CBOE) Volatility Index is a key measure of market expectations of near-term volatility conveyed by S&P 500 stock index option prices. MSCI EAFE Index is an unmanaged index of equity securities from developed countries in Western Europe, the Far East, and Australasia. MSCI Emerging Markets Index is a free float-adjusted market capitalization index that is designed to measure equity market performance in the global emerging markets. MSCI Europe Index is an unmanaged index of Western European equity securities. MSCI World Index is an unmanaged index of equity securities from developed countries. Russell 1000 Value Index is an unmanaged capitalization-weighted index of large-cap stocks chosen for their value orientation. Russell 2000 Growth Index is an unmanaged index of those companies in the small-cap Russell 2000 Index chosen for their growth orientation. You cannot invest directly in an index. S&P 500 Index is an unmanaged index of common stock performance. Indexes assume reinvestment of all distributions and do not account for fees. It is not possible to invest directly in an index.
- 7. Active management, fundamental research, and new insights to capture the growth potential of equities Equity investing at Putnam features a tenured and talented team of portfolio managers backed by an integrated group of research analysts with worldwide reach. Our research organization is structured to focus fundamental analysis on the factors that matter most in global equity markets. Simon Davis Co-Head of International Equities Investing since 1988 Joined Putnam in 2000 Robert D. Ewing, CFA Co-Head of U.S. Equities Investing since 1990 Joined Putnam in 2008 Shep Perkins, CFA Co-Head of International Equities Investing since 1993 Joined Putnam in 2011 Nick C. Thakore Co-Head of U.S. Equities Investing since 1993 Joined Putnam in 2008 The views and opinions expressed are those of the authors (Simon Davis and Shep Perkins, Co-Heads of International Equities, and Robert D. Ewing and Nick C. Thakore, Co-Heads of U.S. Equities) as of June 30, 2014, are subject to change with market conditions, and are not meant as investment advice. Consider these risks before investing: International investing involves certain risks, such as currency fluctuations, economic instability, and political developments. Investments in small and/or midsize companies increase the risk of greater price fluctuations. Bond investments are subject to interest-rate risk, which means the prices of a fund’s bond investments are likely to fall if interest rates rise. Bond investments also are subject to credit risk, which is the risk that the issuer of the bond may default on payment of interest or principal. Interest-rate risk is generally greater for longer-term bonds, and credit risk is generally greater for below-investment-grade bonds, which may be considered speculative. Unlike bonds, funds that invest in bonds have ongoing fees and expenses. Lower-rated bonds may offer higher yields in return for more risk. Funds that invest in government securities are not guaranteed. Mortgage-backed securities are subject to prepayment risk. Commodities involve the risks of changes in market, political, regulatory, and natural conditions. Investors should carefully consider the investment objectives, risks, charges, and expenses of a fund before investing. For a prospectus, or a summary prospectus if available, containing this and other information for any Putnam fund or product, call your financial representative or call Putnam at 1-800-225-1581. Please read the prospectus carefully before investing.
- 8. Putnam Retail Management putnam.com CM0300 289014 7/14 Market update putnam.com/equity Research putnam.com/perspectives putnam.com/white-papers Find us