UPA Ministers on Google Map: What Ministers Want

Source: http://www.olinksmap.com/index.php/site/viewProject?v=16 , best viewed in google chrome Not too many days ago, when PMO published its minsters’ balance sheet on their website, it was placed as frontline news in all leading media agencies in India. In the social media too, it received many favourable and unfavourable comments from its online readers. Mostly, people were surprised to know the huge degree of mismatch between the figures they expected and what was declared. We will stay away on making any qualified statement on this, however believing if the figures are real and unbiased – here is what our analysis suggests. 1. Geographical Representation – Locations where regional parties have strong presence has lower council representation. 2. Asset Summary – Eastern region lags far behind others. 3. Immovable Assets – Preferred choice in North & Central India 4. Cash & Deposits - As important as immovable assets for North & Central, preferred choice of Cabinet ministers from South 5. Jewelleries & Vehicles – Major shifts to Central & Southern regions; South enjoys the fleet of luxury vehicles

Empfohlen
Weitere ähnliche Inhalte
Mehr von Puneet Mishra
Kürzlich hochgeladen
Kürzlich hochgeladen (20)
UPA Ministers on Google Map: What Ministers Want
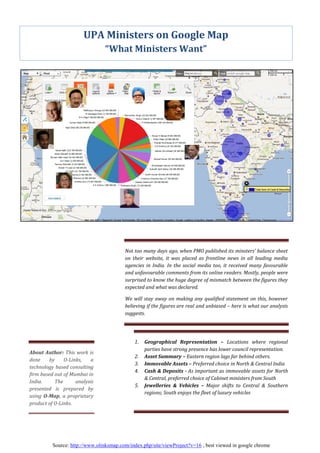
- 1. UPA Ministers on Google Map “What Ministers Want” Not too many days ago, when PMO published its minsters’ balance sheet on their website, it was placed as frontline news in all leading media agencies in India. In the social media too, it received many favourable and unfavourable comments from its online readers. Mostly, people were surprised to know the huge degree of mismatch between the figures they expected and what was declared. We will stay away on making any qualified statement on this, however believing if the figures are real and unbiased – here is what our analysis suggests. 1. Geographical Representation – Locations where regional parties have strong presence has lower council representation. About Author: This work is 2. Asset Summary – Eastern region lags far behind others. done by O-Links, a 3. Immovable Assets – Preferred choice in North & Central India technology based consulting 4. Cash & Deposits - As important as immovable assets for North firm based out of Mumbai in & Central, preferred choice of Cabinet ministers from South India. The analysis 5. Jewelleries & Vehicles – Major shifts to Central & Southern presented is prepared by regions; South enjoys the fleet of luxury vehicles using O-Map, a proprietary product of O-Links. Source: http://www.olinksmap.com/index.php/site/viewProject?v=16 , best viewed in google chrome
- 2. INTERESTING FINDINGS 1. Geographical Representation Cabinet State As of September 15, 2011 Indian union council members are uniformly distributed across India as seen in markers plotted in blue colour in the above pictorial However, once these marker places are transformed into representation of India. clusters, we see prominence of Kerala, TamilNadu in Southern region, West Bengal in Eastern region, and Delhi & nearby areas in Northern region. For the uninitiated, formation of Notable Ownership in Companies Clusters is nothing but comprising members from close Kamal Span Air, EMC Projects, EMC proximity region, in to one point on the map. One interesting Nath Steel, Unique Technobuild, Alzo Investments highlight (in light orange) is the lowest representation from the S. Jagath J Hotels, Jam Hotels & Resorts, region combining parts of – Eastern UP, Bihar, Chhattisgarh, rakshakan Pranav Communications Orissa, and Eastern MP. Area-wise it is ~20% of India, and a Milind Fender Consultant, Punit Deora little more in population terms, whereas, it has council Deora Trust representation of about 4% only. This could be attributed to the Rajiv ARVR Communications, BAG dominance of regional (state) level parties in these areas. One Shukla Films, Skyline Telemedia may also note that these are the regions where Naxalite movements are highly active, though it cannot be attributed. 2. Asset Summary – East Lags far behind Now for the picture of the year, that summarizes the asset sizes represented by bubbles. Council members have generated enough asset size from all parts of India other than the East. Be it the worth of properties under their name, bank balance, jewelleries or vehicles, Council Members in east are outdone by a big margin by their fellow mates from North, South and Central India. Mr. Vincent Pala from Shillong is the lone warrior of East, to give a healthy competition to ministers from other regions. The list of top rankers from different parts North: Mr. Kapil Sibal, Mr. Ashwani Kumar, Ms. Ambika Soni and Mr. Virbhadra Singh Central: Mr. Scindia, Mr. Praful Patel and Mr. Kamal Nath West: Mr. Sharad Pawar, Mr. Milind Deora and Mr. Rajiv Shukla South: Mr. Alagiri, Mr. Chidambaram, Mr. Napoleon, Mr. Jayanthi Narayan, Mr. Purandeswari and Mr. V K Chandra Deo from South Source: http://www.olinksmap.com/index.php/site/viewProject?v=16 , best viewed in google chrome
- 3. 3. Immovable Properties – North & Central India Dominates As shown in another map, Council Members from Central and North India have amassed huge immovable assets over the years. So, does it suggest a preference of the immovable asset class over others by the people representatives from this region? Or have they equally invested into other forms of assets too? (Please note that inherited and gifted properties are not included in this asset class) 4. Cash & Deposits – As important as Immovable for North & Central; preferred choice of Cabinet Ministers from South, also Here, it’s almost a tie between the North, Central and South regions. In fact, this asset class is highly preferred by Mr. Scindia (70% asset as cash & investments). And, there are 9 other members who have scored well above INR 6 million in this asset class. One step further, we plotted separately as per the designation of these members – Cabinet Ministers, and State Ministers. One remarkable observation in South regions is that Cabinet Ministers tend to have much significant wealth in financial instruments as compared to State Ministers. Source: http://www.olinksmap.com/index.php/site/viewProject?v=16 , best viewed in google chrome
- 4. 5. Jewelleries & Vehicles – Central in Jewellery and South in Vehicles Jewellery class shows shift of wealth towards Central zone. A strong cluster of ministers in Central region including Mr. Scindia, Mr. Kamal Nath and Mr. Praful Patel show their choice to invest in jewellery. Southern region too has a noticeable presence in this asset class led by Mr. Alagiri. While plotted alone for the cabinet ministers, preference for jewellery becomes more prominent in South. When it comes to spending money (rather investing) on vehicles, it is led by Mr. Jagathrakshakan from Arakkonam constituency. In general, South is far-far ahead of the rest of the India. Number of luxury vehicles and SUVs owned by the Minsters in South suggests the influence of world-class automobiles among politicians in this region. Apart from South, Mr. Vincent Pala in North-East has a sizeable fleet of vehicles to be proud of. CONCLUSION While the information provided by our Ministers may throw up many more exciting analyses, we have done our bit. The representation shows the preference of Savings or Investments of our Ministers coming from different regions. Does this extrapolate to mean that the population of these regions also have the same preferences? May be, May be not. But if you look at the general South Indian population, they do prefer Gold as compared to their Northern counterparts and also, the Jewellery business is a booming business in the South. Well for now, we will reserve our comments, but we do hope our readers enjoyed our findings. DATA & APPROACH All figures are taken from the “Assets & Liabilities of the Union Council of Ministers [2010-11]” published on http://pmindia.nic.in/rti.htm. Further assets have been broken in 5 different classes 1) Immovable Assets – Agricultural and Non-Agricultural lands, buildings, etc. (not including the assets inherited or been gifted) 2) Cash & Deposits – Cash, Saving Balances, FDs, Insurance, Shares, Any other financial investments net of liabilities 3) Vehicles – Bike, Tractor, Car or any other type of motor vehicle in possession 4) Jewellery – Gold, Diamond, Silver, etc. 5) Companies – Business ownership These figures also include the assets owned by family members. The data was prepared in a CSV file. The asset details of Mr. S Jaipal Reddy were not sufficient, so not included in analysis. The same file was uploaded as a project on olinksmap.com, our proprietary tool, available for public viewing and uploads. The company’s’ worth of certain ministers such as Mr. Kamal Nath was too high and considered as outlier. Further minsters were categorized into two different data-sets Cabinet and State. Also, there is one more level of classification whether the minister is member of Lok Sabha or Rajya Sabha. Source: http://www.olinksmap.com/index.php/site/viewProject?v=16 , best viewed in google chrome