
Recommended
More Related Content
Viewers also liked
Similar to Positive Phase 3 Sarcoma Data Boosts ARIAD Pharma
Similar to Positive Phase 3 Sarcoma Data Boosts ARIAD Pharma (20)
More from James Hilbert
More from James Hilbert (17)
Recently uploaded
Recently uploaded (20)
Positive Phase 3 Sarcoma Data Boosts ARIAD Pharma
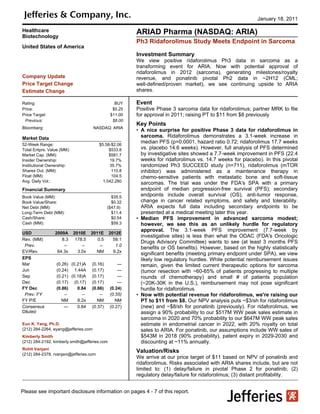
- 1. January 18, 2011 Healthcare ARIAD Pharma (NASDAQ: ARIA) Biotechnology Ph3 Ridaforolimus Study Meets Endpoint in Sarcoma United States of America Investment Summary We view positive ridaforolimus Ph3 data in sarcoma as a transforming event for ARIA. Now with potential approval of ridaforolimus in 2012 (sarcoma), generating milestones/royalty Company Update revenue, and ponatinib pivotal Ph2 data in ~2H12 (CML; Price Target Change well-defined/proven market), we see continuing upside to ARIA Estimate Change shares. Rating: BUY Event Price: $5.25 Positive Phase 3 sarcoma data for ridaforolimus; partner MRK to file Price Target: $11.00 for approval in 2011; raising PT to $11 from $8 previously Previous: $8.00 Key Points Bloomberg: NASDAQ: ARIA • A nice surprise for positive Phase 3 data for ridaforolimus in Market Data sarcoma. Ridaforolimus demonstrates a 3.1-week increase in 52-Week Range: $5.58-$2.06 median PFS (p=0.0001, hazard ratio 0.72; ridaforolimus 17.7 weeks Total Entprs. Value (MM): $533.8 vs. placebo 14.6 weeks). However, full analysis of PFS determined Market Cap. (MM): $581.7 by investigative sites showed a 7.7-week improvement in PFS (22.4 Insider Ownership: 19.7% weeks for ridaforolimus vs. 14.7 weeks for placebo). In this pivotal Institutional Ownership: 35.7% randomized Ph3 SUCCEED study (n=711), ridaforolimus (mTOR Shares Out. (MM): 110.8 inhibitor) was administered as a maintenance therapy in Float (MM): 104.5 chemo-sensitive patients with metastatic bone and soft-tissue Avg. Daily Vol.: 1,042,280 sarcomas. The trial was under the FDA's SPA with a primary Financial Summary endpoint of median progression-free survival (PFS); secondary Book Value (MM): $35.5 endpoints include overall survival (OS), anti-tumor response, Book Value/Share: $0.32 change in cancer related symptoms, and safety and tolerability. Net Debt (MM): ($47.9) ARIA expects full data including secondary endpoints to be Long-Term Debt (MM): $11.4 presented at a medical meeting later this year. Cash/Share: $0.54 • Median PFS improvement in advanced sarcoma modest; Cash (MM): $59.3 however, we see this as an unlikely hurdle for regulatory approval. The 3.1-week PFS improvement (7.7-week by USD 2009A 2010E 2011E 2012E investigative sites) is less than what the ODAC (FDA's Oncologic Rev. (MM) 8.3 178.5 0.5 58.1 Drugs Advisory Committee) wants to see (at least 3 months PFS Prev. -- -- -- 1.0 benefits or OS benefits). However, based on the highly statistically EV/Rev. 64.3x 3.0x NM 9.2x significant benefits (meeting primary endpoint under SPA), we view EPS likely low regulatory hurdles. While potential reimbursement issues Mar (0.26) (0.21)A (0.16) — remain, given the limited current therapeutic options for sarcoma Jun (0.24) 1.44A (0.17) — (tumor resection with ~60-65% of patients progressing to multiple Sep (0.21) (0.18)A (0.17) — rounds of chemotherapy) and small # of patients population Dec (0.17) (0.17) (0.17) — (~20K-30K in the U.S.), reimbursement may not pose significant FY Dec (0.86) 0.84 (0.66) (0.24) hurdle for ridaforolimus. Prev. FY -- -- -- (0.55) • Now with potential revenue for ridaforolimus, we're raising our FY P/E NM 6.2x NM NM PT to $11 from $8. Our NPV analysis puts ~$3/sh for ridaforolimus Consensus — 0.84 (0.37) (0.27) (new) and ~$8/sh for ponatinib (previously). For ridaforolimus, we Diluted assign a 90% probability to our $517M WW peak sales estimate in sarcoma in 2020 and 70% probability to our $647M WW peak sales Eun K. Yang, Ph.D. estimate in endometrial cancer in 2022, with 20% royalty on total (212) 284-2264, eyang@jefferies.com sales to ARIA. For ponatinib, our assumptions include WW sales of Kimberly Smith $543M in 2018 (90% probability), patent expiry in 2029-2030 and (212) 284-2192, kimberly.smith@jefferies.com discounting at ~11% annually. Rohit Vanjani Valuation/Risks (212) 284-2378, rvanjani@jefferies.com We arrive at our price target of $11 based on NPV of ponatinib and ridaforolimus. Risks associated with ARIA shares include, but are not limited to: (1) delay/failure in pivotal Phase 2 for ponatinib; (2) regulatory delay/failure for ridaforolimus; (3) distant profitability. Please see important disclosure information on pages 4 - 7 of this report.
- 2. (NASDAQ:ARIA) • We assume MRK to submit regulatory filings for ridaforolimus by end-2011 after full data analysis/presentation, with potential approval in 2H12. ARIA views the highly significant median PFS p-value (p=0.0001) and hazard ratio (HR=0.72; 28% reduction in risks) on full analysis of 552 PFS events (in 711 patients) as most important to the FDA under the SPA agreement. Given the wide distribution in patient responses, ARIA does not view the modest point difference in median PFS will impact ridaforolimus' approvability in sarcoma. • We assume $50M in milestone payments from partner Merck in 2012. ARIA is now positioned to receive $65M in potential regulatory milestones from partner Merck (MRK, $33.82, Hold) upon NDA acceptance in the U.S. ($25M), U.S. approval ($25M), EU approval ($10M), and Japan approval ($5M). For royalty revenues for ridaforolimus, we now assume $7M in 2012 (on $35M in sales), $14M in 2013 (on $71M in sales), and $29M in 2014 (on $146M in sales). • Pivotal Phase 2 for ponatinib (AP24534) in CML/Ph+ ALL began in Sept. 2010; data in 2H12 with potential approval in 1H13 (by our estimate). ARIA expects to enroll 320 patients in 6 cohorts, including CP (chronic phase), n=160, AP (accelerated phase), n=80, and BP (blast phase) of CML (n=80; Ph+ ALL grouped w/ blast phase), +/- the T315i mutation (roughly 50/50 in each cohort). This registration study, PACE (Ponatinib Ph+ ALL and CML Evaluation), is single-arm enrolling 2nd-line (T315i mutation following BCR-ABL therapy) and 3rd-line patients (dosed 1x daily, 45mg). ARIA expects to complete patient enrollment by end-2011 and collect 6-month FU response data for filing by mid-2011. Thus, we expect data in 2H12 and potential approval in 1H13 (vs. ARIA's estimate of its market launch in late-2012/early-2013). ARIA expects >$600M in sales 5 years from launch in 2nd- and 3rd-line CML, with peak sales at >$900M. In 2018 (5 years from our estimated launch in 2013), we assume $543M in WW sales in 2nd- and 3rd-line CML. • Large market opportunity for marketed BCR-ABL drugs, with total sales of ~$4.5B in 2009 for all indications. For CML, estimated sales were ~$3B for Gleevec (imatinib), ~$400M for Sprycel (dasatinib), and ~$200M for Tasigna (nilotinib). Thus, we view our annual sales assumption of $543M for ponatinib in 2018 as reasonable. • Estimated current cash of ~$100M sufficient through 2H12. Including $57.4M in net proceeds from the recent raise on 10/26/10 (16M shares at $3.70/sh), ARIA expects to end the year with $102M in cash, which it estimates to be sufficient to fund the completion of the Phase 2 ponatinib registrational trial (350 patients enrollment completion in 4Q11) and NDA filing preparation 2H12. This does not include any milestone payment from a potential partnership for ponatinib (for certain territories) or the current MRK partnership for ridaforolimus. • Upcoming events include: (1) regulatory filing for ridaforolimus by partner MRK by end-2011; (2) completion of patient enrollment in pivotal Phase 2 study for ponatinib in advanced CML/Ph+ ALL by end 2011; (3) pivotal Phase 2 data/potential NDA filing for ponatinib in advanced CML/Ph+ ALL in 2H12; and (4) potential approval of ridaforolimus in 2H12. Company Description Founded in 1991, Ariad Pharmaceuticals focuses on drug discovery and development for cancers by regulating cell signaling with small-molecule drugs. Its lead drug candidate, ridaforolimus (a potent mTOR inhibitor), is in a Phase 3 trial for metastatic sarcomas, licensed to Merck. Its two proprietary products include ponatinib in pivotal Phase 2 for CML/Ph+ ALL and AP26113 entering Phase I for cancer in 2H11. Targeted cancer therapy market, such as Ariad's products, is estimated at ~$30 billion in 2009. Ariad's business strategy includes: (1) to build a pipeline portfolio of targeted cancer therapies; (2) to establish an oncology-focused specialty force in the U.S.; and (3) to leverage its cell-signaling technologies (ARGENT, NF-kB intellectual property) for further revenue opportunities. Ariad has a strong intellectual property position, covering its mTOR inhibitor (ridaforolimus), various families of kinase inhibitors, and cell-signaling regulation technologies. Please see important disclosure information on pages 4 - 7 of this report. Eun K. Yang, Ph.D. , eyang@jefferies.com, (212) 284-2264 Page 2 of 7
- 3. (NASDAQ:ARIA) Ariad Pharmaceuticals, Inc. (ARIA) Income Statement ($ in thousands except per share) 2008 2009 1Q 2Q 3Q 4QE 2010E 1QE 2QE 3QE 4QE 2011E 2012E 2013E 2014E 2015E Revenues Product Sales (U.S.) Ponatinib (AP24534; BCR-ABL inhibitor) 22,425 86,283 116,916 % growth y/y Others Royalty on ponatinib (ex-U.S.) 5,986 22,022 32,841 Royalty from MRK on ridaforolimus 7,050 14,171 29,147 43,146 % growth y/y Total license revenue 7,082 8,302 2,154 175,049 1,242 55 178,500 125 125 125 125 500 51,000 11,000 1,000 1,000 Total Revenues 7,082 8,302 2,154 175,049 1,242 55 178,500 125 125 125 125 500 58,050 53,583 138,453 193,903 % growth y/y 97.7% 17.2% 2050.1% -99.7% 11510.1% -7.7% 158.4% 40.1% Expenses Cost of Goods Sold - - - - - - - - - - - - - 4,485 8,628 5,846 % gross margin 80.0% 90.0% 95.0% Royalty on ridaforolimus sales from MRK - - - R&D 50,841 63,447 14,835 13,814 13,168 15,920 57,737 16,050 16,450 16,550 16,770 65,820 70,427 73,949 77,646 81,528 % growth y/y 28.5% 24.8% -16.4% -12.6% -8.5% 2.7% -9.0% 8.2% 19.1% 25.7% 5.3% 14.0% 7.0% 5.0% 5.0% 5.0% % of total revenues 32.3% 13164.0% 121.3% 138.0% 56.1% 42.0% SG&A 28,092 16,888 4,574 4,001 3,670 4,255 16,500 4,300 4,350 4,400 4,440 17,490 20,988 30,433 39,562 49,453 % growth y/y 13.7% -39.9% 10.9% -16.9% 5.7% -4.9% -2.3% -6.0% 8.7% 19.9% 4.3% 6.0% 20.0% 45.0% 30.0% 25.0% % of total revenues 3498.0% 36.2% 56.8% 28.6% 25.5% Total Expenses 78,933 80,335 19,409 17,815 16,838 20,175 74,237 20,350 20,800 20,950 21,210 83,310 91,415 108,866 125,837 136,827 Income (loss) from Operations (EBIT) (71,851) (72,033) (17,255) 157,234 (15,596) (20,120) 104,263 (20,225) (20,675) (20,825) (21,085) (82,810) (33,365) (55,284) 12,616 57,076 % growth y/y 18.4% 0.3% -244.7% -179.4% -59.7% 65.7% -122.8% 352.4% Other income, net (int. income/expense) 799 (7,975) (6,143) 2,114 (4,804) 33 (8,800) (750) (750) (750) (750) (3,000) (500) 100 1,000 2,000 Earnings (Loss) Before Taxes (71,052) (80,008) (23,398) 159,348 (20,400) (20,087) 95,463 (20,975) (21,425) (21,575) (21,835) (85,810) (33,865) (55,184) 13,616 59,076 Provision for Taxes Tax Rate Net Income (loss) - GAAP (71,052) (80,008) (23,398) 159,348 (20,400) (20,087) 95,463 (20,975) (21,425) (21,575) (21,835) (85,810) (33,865) (55,184) 13,616 59,076 EPS (LPS) - Basic (1.02) (0.86) (0.21) 1.44 (0.18) (0.17) 0.85 (0.16) (0.17) (0.17) (0.17) (0.66) (0.24) (0.39) 0.10 0.41 EPS (LPS) - Diluted (1.02) (0.86) (0.21) 1.35 (0.18) (0.17) 0.84 (0.16) (0.19) (0.17) (0.17) (0.66) (0.24) (0.39) 0.09 0.39 % growth y/y (diluted) Shares - Basic 69,791 93,330 109,016 110,290 110,810 121,364 112,870 128,578 129,221 129,867 130,516 129,545 140,908 141,330 142,037 142,747 Shares - Diluted 69,791 93,330 109,016 116,079 110,810 121,364 114,317 128,578 129,221 129,867 130,516 129,545 140,908 141,330 152,037 152,747 Cash, cash equivalents & investments 39,068 40,362 25,442 61,755 59,305 101,618 101,618 84,393 66,718 61,693 43,608 43,608 118,743 78,560 107,176 181,252 Source: Company reports and Jefferies & Company, Inc. Please see important disclosure information on pages 4 - 7 of this report. Eun K. Yang, Ph.D. , eyang@jefferies.com, (212) 284-2264 Page 3 of 7
- 4. (NASDAQ:ARIA) ANALYST CERTIFICATIONS I, Eun Yang, Ph.D., certify that all of the views expressed in this research report accurately reflect my personal views about the subject security(ies) and subject company(ies). I also certify that no part of my compensation was, is, or will be, directly or indirectly, related to the specific recommendations or views expressed in this research report. I, Kimberly Smith, certify that all of the views expressed in this research report accurately reflect my personal views about the subject security(ies) and subject company(ies). I also certify that no part of my compensation was, is, or will be, directly or indirectly, related to the specific recommendations or views expressed in this research report. I, Rohit Vanjani, certify that all of the views expressed in this research report accurately reflect my personal views about the subject security(ies) and subject company(ies). I also certify that no part of my compensation was, is, or will be, directly or indirectly, related to the specific recommendations or views expressed in this research report. Important Disclosures As is the case with all Jefferies employees, the analyst(s) responsible for the coverage of the financial instruments discussed in this report receive compensation based in part on the overall performance of the firm, including investment banking income. We seek to update our research as appropriate, but various regulations may prevent us from doing so. Aside from certain industry reports published on a periodic basis, the large majority of reports are published at irregular intervals as appropriate in the analyst's judgement. An individual involved in the preparation of this report owns shares of Merck & Co. common stock. Jefferies makes a market in ARIAD Pharmaceuticals, Inc. Meanings of Jefferies & Company, Inc, Ratings Buy - Describes stocks that we expect to provide a total return (price appreciation plus yield) of 15% or more within a 12-month period. Hold - Describes stocks that we expect to provide a total return (price appreciation plus yield) of plus 15% or minus 10% within a 12-month period. Underperform - Describes stocks that we expect to provide a total negative return (price appreciation plus yield) of 10% or more within a 12-month period. Our focus on mid-capitalization and growth companies implies that many of the companies we cover are typically more volatile than the overall stock market, which can be amplified for companies with an average stock price consistently below $10. For companies in this category only, the expected total return (price appreciation plus yield) for Buy rated stocks is 20% or more within a 12-month period. For Hold rated stocks with an average stock price consistently below $10, the expected total return (price appreciation plus yield) is plus or minus 20% within a 12-month period. For Underperform rated stocks with an average stock price consistently below $10, the expected total return (price appreciation plus yield) is minus 20% within a 12-month period. NR - The investment rating and price target have been temporarily suspended. Such suspensions are in compliance with applicable regulations and/or Jefferies & Company, Inc. policies. CS - Coverage Suspended. Jefferies & Company, Inc. has suspended coverage of this company. NC - Not covered. Jefferies & Company, Inc. does not cover this company. Restricted - Describes issuers where, in conjunction with Jefferies engagement in certain transactions, company policy or applicable securities regulations prohibit certain types of communications, including investment recommendations. Monitor - Describes stocks whose company fundamentals and financials are being monitored, and for which no financial projections or opinions on the investment merits of the company are provided. Valuation Methodology Jefferies' methodology for assigning ratings may include the following: market capitalization, maturity, growth/value, volatility and expected total return over the next 12 months. The price targets are based on several methodologies, Please see important disclosure information on pages 4 - 7 of this report. Eun K. Yang, Ph.D. , eyang@jefferies.com, (212) 284-2264 Page 4 of 7
- 5. (NASDAQ:ARIA) which may include, but are not restricted to, analyses of market risk, growth rate, revenue stream, discounted cash flow (DCF), EBITDA, EPS, cash flow (CF), free cash flow (FCF), EV/EBITDA, P/E, PE/growth, P/CF, P/FCF, premium (discount)/average group EV/EBITDA, premium (discount)/average group P/E, sum of the parts, net asset value, dividend returns, and return on equity (ROE) over the next 12 months. Risk which may impede the achievement of our Price Target This report was prepared for general circulation and does not provide investment recommendations specific to individual investors. As such, the financial instruments discussed in this report may not be suitable for all investors and investors must make their own investment decisions based upon their specific investment objectives and financial situation utilizing their own financial advisors as they deem necessary. Past performance of the financial instruments recommended in this report should not be taken as an indication or guarantee of future results. The price, value of, and income from, any of the financial instruments mentioned in this report can rise as well as fall and may be affected by changes in economic, financial and political factors. If a financial instrument is denominated in a currency other than the investor's home currency, a change in exchange rates may adversely affect the price of, value of, or income derived from the financial instrument described in this report. In addition, investors in securities such as ADRs, whose values are affected by the currency of the underlying security, effectively assume currency risk. Rating and Price Target History for: ARIAD Pharmaceuticals, Inc. (ARIA) as of 01-17-2011 11/06/08 05/07/09 05/05/10 01/05/11 B:$6 B:$4 B:$6 B:$8 6 5 4 3 2 1 0 Q1 Q2 Q3 Q1 Q2 Q3 Q1 Q2 Q3 Q1 2008 2009 2010 2011 Created by BlueMatrix Rating and Price Target History for: Merck & Co. (MRK) as of 01-17-2011 09/16/10 10/25/10 11/15/10 01/11/11 01/14/11 I:H:$39 H:$39.8 H:$37.8 H:$37 H:$34.5 48 40 32 24 16 8 Q1 Q2 Q3 Q1 Q2 Q3 Q1 Q2 Q3 Q1 2008 2009 2010 2011 Created by BlueMatrix Please see important disclosure information on pages 4 - 7 of this report. Eun K. Yang, Ph.D. , eyang@jefferies.com, (212) 284-2264 Page 5 of 7
- 6. (NASDAQ:ARIA) Distribution of Ratings IB Serv./Past 12 Mos. Rating Count Percent Count Percent BUY [BUY] 580 51.60 44 7.59 HOLD [HOLD] 498 44.30 25 5.02 SELL [UNPF] 46 4.10 5 10.87 OTHER DISCLOSURES This material has been prepared by Jefferies & Company, Inc. a U.S.-registered broker-dealer, employing appropriate expertise, and in the belief that it is fair and not misleading. The information upon which this material is based was obtained from sources believed to be reliable, but has not been independently verified, therefore, we do not guarantee its accuracy. Additional and supporting information is available upon request. This is not an offer or solicitation of an offer to buy or sell any security or investment. Any opinion or estimates constitute our best judgment as of this date, and are subject to change without notice. Jefferies & Company, Inc. and Jefferies International Limited and their affiliates and their respective directors, officers and employees may buy or sell securities mentioned herein as agent or principal for their own account. Upon request Jefferies & Company, Inc. may provide specialized research products or services to certain customers focusing on the prospects for individual covered stocks as compared to other covered stocks over varying time horizons or under differing market conditions. While the views expressed in these situations may not always be directionally consistent with the long-term views expressed in the analyst's published research, the analyst has a reasonable basis and any inconsistencies can be reasonably explained. Additional information for UK and Canadian investors This material has been issued by Jefferies & Company, Inc. ("JEFCO") and in the United Kingdom ("UK") is approved and distributed by Jefferies International Limited ("JIL") which is authorized and regulated by the Financial Services Authority ("FSA"). In the UK, this material is intended for use only by persons who have, or have been assessed as having, suitable professional experience and expertise, or by persons to whom it can be otherwise lawfully distributed. For Canadian investors, this material is intended for use only by professional or institutional investors. None of the investments or investment services mentioned or described herein is available to other persons or to anyone in Canada who is not a "Designated Institution" as defined by the Securities Act (Ontario). For investors in the Republic of Singapore, this material is provided by JEFCO through Jefferies Singapore Limited ("JSL") pursuant to Regulation 32C of the Financial Advisers Regulations. The material contained in this document is intended solely for accredited, expert or institutional investors, as defined under the Securities and Futures Act (Cap. 289 of Singapore). If there are any matters arising from, or in connection with this material, please contact JSL in Singapore at 80 Raffles Place #15-20, UOB Plaza 2, Singapore 048624, telephone: +65 6551 3950. The information set forth herein was obtained from sources believed to be reliable, but has not been independently verified by JIL, JSL or JEFCO. Therefore, except for any obligation under the rules of the FSA we do not guarantee its accuracy. Additional and supporting information is available upon request. This is not an offer or solicitation of an offer to buy or sell any security or derivative instrument, or to make any investment. Any opinion or estimate constitutes the preparer's best judgment as of the date of preparation, and is subject to change without notice. JIL, JSL, JEFCO, their associates or affiliates, and their respective officers, directors, and employees may have long or short positions in, or may buy or sell any of the securities, derivative instruments or other investments mentioned or described herein, either as agent or as principal for their own account. Upon request JEFCO may provide specialized research products or services to certain customers focusing on the prospects for individual covered stocks as compared to other covered stocks over varying time horizons or under differing market conditions. While the views expressed in these situations may not always be directionally consistent with the long-term views expressed in the analyst's published research, the analyst has a reasonable basis and any inconsistencies can be reasonably explained. This material does not constitute a personal recommendation or take into account the particular investment objectives, financial situations, or needs of individual clients. Clients should consider whether any advice or recommendation in this report is suitable for their particular circumstances and, if appropriate, seek professional advice, including tax advice. The price and value of the investments referred to herein and the income from them may fluctuate. Past performance is not a guide to future performance, future returns are not guaranteed, and a loss of original capital may Please see important disclosure information on pages 4 - 7 of this report. Eun K. Yang, Ph.D. , eyang@jefferies.com, (212) 284-2264 Page 6 of 7
- 7. (NASDAQ:ARIA) occur. Fluctuations in exchange rates could have adverse effects on the value or price of, or income derived from, certain investments. JEFCO research reports are disseminated and available primarily electronically, and, in some cases, in printed form. Electronic research is simultaneously available to all clients. This report or any portion hereof may not be reprinted, sold or redistributed without the written consent of JEFCO. JIL has adopted a conflicts management policy in connection with the preparation and publication of research, the details of which are available upon request in writing to: The Compliance Officer, Jefferies International Limited, Vintners Place, 68 Upper Thames Street, London EC4V 3BJ; telephone +44 (0)20 7029 8000; facsimile +44 (0)20 7029 8010. For Important Disclosure information, please visit our website at https://jefferies.bluematrix.com/bluematrix/JefDisclosure or call 1.888.JEFFERIES. Upon request Jefferies International Limited may provide specialized research products or services to certain customers focusing on the prospects for individual covered stocks as compared to other covered stocks over varying time horizons or under differing market conditions. While the views expressed in these situations may not always be directionally consistent with the long-term views expressed in the analyst's published research, the analyst has a reasonable basis and any inconsistencies can be reasonably explained. © 2011 Jefferies & Company, Inc, Please see important disclosure information on pages 4 - 7 of this report. Eun K. Yang, Ph.D. , eyang@jefferies.com, (212) 284-2264 Page 7 of 7