
Empfohlen
Empfohlen
Weitere ähnliche Inhalte
Was ist angesagt?
Was ist angesagt? (19)
Ähnlich wie M3505
Ähnlich wie M3505 (20)
Kürzlich hochgeladen
Kürzlich hochgeladen (20)
M3505
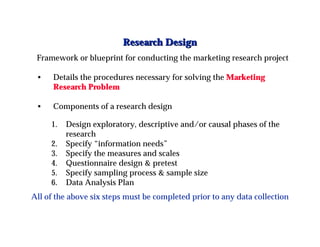
- 1. Research Design Framework or blueprint for conducting the marketing research project • Details the procedures necessary for solving the Marketing Research Problem • Components of a research design 1. Design exploratory, descriptive and/or causal phases of the research 2. Specify “information needs” 3. Specify the measures and scales 4. Questionnaire design & pretest 5. Specify sampling process & sample size 6. Data Analysis Plan All of the above six steps must be completed prior to any data collection
- 2. FIGURE 4.1 A Classification of Marketing Research Designs Research Design 1 Exploratory Research Design Conclusive Research Design 2 Descriptive Research 3 Causal Research Cross-Sectional Longitudinal Design Design Single Multiple Cross-Sectional Cross-Sectional Important Note: The Typical MR Project uses 2 of the 3 Research designs in conjunction
- 3. MKTG. DECISION- MAKING PROCESS Recognizing and defining decision problem Exploratory research Identifying courses of action Evaluating courses of action Conclusive research 1. Descriptive Selecting a course 2. Causal of action Performance-monitoring Implementing research Feedback
- 4. Table 4.2 A Comparison of Basic Research Designs Exploratory Descriptive Causal Objective: Discovery of ideas and insights Describe market characteristics Determine cause and effect or functions relationships Characteristics: Flexible Marked by the prior formulation Manipulation of one or more Versatile of specific hypotheses independent variables Often the front end of total Preplanned and structured Control of other mediating research design design variables Methods: Expert surveys Secondary data Experiments Pilot surveys Surveys Case studies Panels Secondary data Observational and other data Qualitative research IMPORTANT CONCEPT: The Marketing Manager’s “Causal” Model based on Judgment & Experience MKTG. = M.R. + MKTG.. Mgr.'s DECISION INFO “CAUSAL” MODEL
- 5. Three Research Approaches Research Purpose Research Question Hypothesis Exploratory research 1. What new product should be What alternative ways are there to ------------------ E developed? provide lunches for school children? X 2. What product appeal will be What benefits do people seek from the Constructs unknown P effective in advertising? product? L 3. How can our service be What is the nature of any customer Suspect that an image of improved? dissatisfaction? impersonalization is a problem Descriptive research 4. How should a new product be Where do people now buy similar Upper-class buyers use specialty stores distributed? products? and middle-class buyers use C department stores. 5. What should be the target O segment? What kinds of people now buy the Older people buy our brand, whereas N product, and who buys our brand? the young marrieds are heavy users of competitors. C 6. How should our product be What is our current image? changed? We are regarded as being L conservatives and behind the times. U Causal research S 7. Will an increase in the service staff be profitable? What is the relationship of size of service staff and revenue? For small organizations an increase of 50% or less will generate marginal I revenue in excess of marginal costs. V 8. Which advertising program for What would get people out of cars and Advertising program A generates public transit should be run? into public transit? more new riders than program B. E 9. Should a new budget or “no Will the “no frills” airfare generate The new airfare will attract sufficient frills” class of airfare be sufficient new passengers to offset the revenue from new passengers. introduced? loss of revenue from existing passengers switching from economy class?
- 6. The Uncertainty Associated With the Research Problem Determines the Research Methodology Exploratory research Descriptive research Causal research Decreasing certainty Increasing certainty Degree of problem Unaware of problem Aware of problem Problem clearly defined definition “Our sales are “What kinds of “Would buyers declining and we people buy our prefer this new don’t know why” product? Who buys package design?” our competitors’ Possible products?” situation faced “Would buyers be “What features do “Which of these interested in this buyers prefer in our two ad campaigns new product product?” is more effective?” idea?”
- 7. Relationship Among the Research Designs Descriptive Research 1 1R 2 2R Exploratory Research 3R 3 Causal Research
- 8. DESCRIPTIVE RESEARCH Table 4.4 Cross-Sectional Data May Not Show Change TIME PERIOD Period 1 Period 2 Brand Purchased Survey Survey Brand A 200 200 Brand B 300 300 Brand C 500 500 1000 1000
- 9. DESCRIPTIVE RESEARCH Table 4.5 Longitudinal Data May Show Substantial Change BRAND PURCHASED IN PERIOD 2 Brand A Brand B Brand C Brand Brand A 100 50 50 200 purchased Brand B 25 100 175 300 in Period 1 Brand C 75 150 275 500 200 300 500 1000 DIAGONAL ENTRIES REPEAT PURCHASERS (BOXED) OFF-DIAGONAL ENTRIES SWITCHERS
- 10. Table 4.3 Relative Advantages and Disadvantages of Longitudinal and Cross-Sectional Designs Evaluation Cross-Sectional Longitudinal Criteria Design Design Detecting change - + Large amount of - + data collection Accuracy - + Representative + - sampling Response bias + - Note: A + indicates a relative advantage over the other design whereas a - indicates a relative disadvantage.
- 11. The Best Marketing Researchers Use: The Concept of Backward Marketing Research
- 12. TYPES OF DATA IN MARKETING RESEARCH Table 5.1 A Comparison of Primary and Secondary Data PRIMARY Data collected by the researcher for the specific purpose of addressing the research problem at hand SECONDARY Data previously collected for other purposes PRIMARY DATA SECONDARY DATA Collection purpose For the problem at hand For other problems Collection process Very involved Rapid and easy Collection cost High Relatively low Collection time Long Short RELATE TO SCOPE OF MARKETING RESEARCH PROJECT IMPORTANT NOTE: Secondary data requires more interpretation & analysis
- 13. Secondary Data Advantages * May provide a better understanding of research problem * May provide a solution * May aid in designing method for primary research * May alert researcher to unforeseen problems * May provide necessary background information and build creativity for the research report
- 14. Advantages of Secondary Data Readily available Inexpensive to find Alternative to primary data collection Alert researcher to potential problem areas Clarify research problems and hypotheses Provide possible solution to marketing problems
- 15. Secondary Data Limitations * Lack of availability UNITS OF MEASUREMENT BIAS? * Lack of relevance OLD DEFINITION OF “CLASSES” DATA * Inaccurate data ACCURACY * Insufficient data UNKNOWN Q: To use or not to use? A: Trade-off limitations with advantages AT A MINIMUM Use secondary data for STEP 2 of the Mktg.. Research Process (“Developing an Approach to the Problem,” pg. 25)
- 16. Disadvantages of Secondary Data Units of measurement may be different units instead of dollars Statistical procedures may be misleading indices on very large bases Class or category definitions may differ categories of $10,000 when $20,000 is needed Outdated publications 1990 Census data no longer valid Reliability, validity, accuracy problems key segments not represented
- 17. Figure 5.1 A Classification of Secondary Data Secondary Data Internal External Require Ready to Further Published Computerized Syndicated Use Processing Materials Databases Services Sales and Cost Data by Product Geography Customers Time
- 18. Figure 5.2 A Classification of Published Secondary Sources Published Secondary Data General Government Business Sources Sources Other Published Statistical Census Government Guides Directories Indexes Materials Data Data Publications Findex Business Sales & Mktg. Periodicals Mgmt. Survey Index of Buying Power Predicasts F&S Index
- 19. CENSUS DATA • Easy access • Reasonable price • Accurate • Machine readable 1990 census of { CENSUS OF POPULATION CENSUS OF HOUSING population and housing MANUFACTURING tabulation & RETAIL TRADE publication program WHOLESALE TRADE TRANSPORTATION AGRICULTURE BUSINESS • SOME CENSUS DATA IS “ESTIMATED” RATHER THAN BASED ON A COUNT (Note: The Homer Babbidge Library is the “official” repository for census information)
- 20. SUBJECTS IN THE 1990 CENSUS CLASSIFIED AS COMPLETE-COUNT OR SAMPLE ITEMS Population Housing Items collected at every household (“complete-count items”) Household type Number of units at address Sex Complete plumbing facilities Race Number of rooms Age Tenure (whether the unit is owned or rented) Marital status Condominium identification 1 Spanish/Hispanic origin or descent Value of home (for owner-occupied units and condominiums) Rent (for renter-occupied units) Vacant for rent, for sale, and so forth; and period of vacancy Additional items collected at sample households* School enrollment Type of unit Educational attainment Stories in building and presence of elevator State or foreign country of birth Year built Citizenship and year of immigration Year moved into this house1 Current language and English proficiency Acreage and crop sales Ancestry Source of water Place of residence 5 years ago Sewage disposal Activity 5 years ago Heating equipment Veteran status and period of service Fuels used for house heating, water heating, and cooking Presence of solar heat Presence of disability or handicap Costs of utilities and fuels Children ever born Complete kitchen facilities NOTE: Census definitions change from Marital history Number of bedrooms time to time Employment status last week Number of bathrooms Hours worked last week Telephone Place of work Travel time to work Number of automobiles Means of transportation to work Number of light trucks and vans Persons in carpool Homeowner shelter costs for mortgage, real-estate taxes, and Year last worked hazard insurance Industry Occupation Class of worker Work in 1989 and weeks looking for work in 1989 Amount of income by source1 and total income in 1989
- 21. SUBJECTS IN THE 1990 CENSUS CLASSIFIED AS COMPLETE-COUNT OR SAMPLE ITEMS (continued) Population Housing Derived variables (illustrative examples) Families Persons per room (“crowding”) Family type and size Household size Poverty status Plumbing facilities Population density Institutions and other group quarters Size of place Gross rent Farm residence 1 Changed relative to 1980. * For most areas of the country in 1990, one out of every six housing units or households received the sample form. Areas estimated to contain 2500 or fewer persons in 1980 had a 3-out-of-every-6 sampling rate, which is required in order to obtain reliable statistics needed for participation in certain federal programs. Source: The 1990 Census Questionnaire (American Demographics, 1989).
- 22. Resellers of Census Information • “MERGE” census & other data • Private companies have formed a growth industry • Fast, efficient, means of accessing census information • New products such as computer graphics and geographic information systems (Many of these companies advertise inAmerican Demographics magazine) available in the Library
- 23. Figure 5.3 A Classification of Computerized Databases Computerized Databases On-line Off-line Numeric Full-Text Directory Special Bibliographic Purpose Databases Databases Databases Databases Databases ABI/INFORM CONNECTICUT LEXIS DATA MANAGER NEXIS WILSON BUSINESS ABSTRACTS the “best” source of info. on CT?
- 24. TABLE 5.2 Selected Offerings of the Popular On-Line Vendors DOW JONES DIALOG COMPUSERVE Disclosure II Disclosure II (business Standard & Poor’s General Dow Jones News database) Information File Current Quotes Management Contents Washington Post Wall Street Journal Standard & Poor’s Corporate World Book Encyclopedia Academic American Description Microquote (stock Encyclopedia Books in Print information) Cineman Movie Reviews Electronic Yellow Pages Business Information Wire AP News Magazine Index AP News Comp*U*Store AP News Comp*U*Store OAG OAG OAG
- 25. Figure 6.1 A Classification of Marketing Research Data Marketing Research Data Secondary Primary Data Data Exploratory Qualitative Quantitative Data Data Exploratory Descriptive Causal Survey Data Observational Experimental & Other Data Data