Measuring america - manufacturing
•
0 likes•224 views

Key stats from the manufacturing sector in USA
Recommended

Recommended
More Related Content
What's hot
What's hot (18)
Viewers also liked
Viewers also liked (20)
Similar to Measuring america - manufacturing
Similar to Measuring america - manufacturing (20)
More from Prayukth K V
More from Prayukth K V (20)
Recently uploaded
Recently uploaded (20)
Measuring america - manufacturing
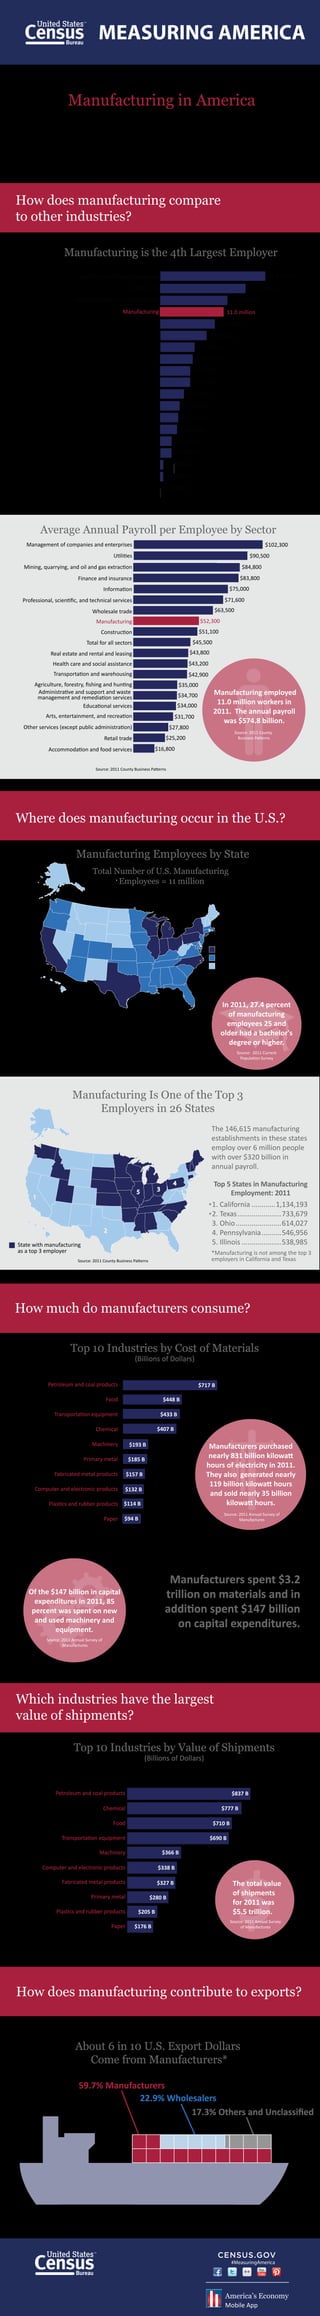
- 1. MEASURING AMERICA November 13, 2013 Manufacturing in America Manufacturing plays a major role in our economy. According to the Census Bureau's latest County Business Patterns, the manufacturing sector includes almost 300,000 establishments with 11 million employees producing goods that we consume domestically or export abroad. The nation relies on several key Census Bureau programs to track America's manufacturing. The most recent year's data from some of these programs are highlighted below. How does manufacturing compare to other industries? Manufacturing is the 4th Largest Employer 18.1 million Health care and social assistance 14.7 million Retail trade Accommodation and food services 11.6 million Manufacturing 11.0 million Administrative and support and waste management and remediation services Professional, scientific, and technical services 9.4 million 7.9 million Finance and insurance 5.9 million Wholesale trade 5.6 million Construction 5.2 million Other services (except public administration) 5.2 million Transportation and warehousing 4.1 million Educational services 3.4 million Information 3.1 million Management of companies and enterprises 2.9 million Arts, entertainment, and recreation 2.0 million Real estate and rental and leasing 1.9 million Mining, quarrying, and oil and gas extraction 0.7 million Utilities 0.6 million Agriculture, forestry, fishing and hunting 0.2 million Source: 2011 County Business Patterns Average Annual Payroll per Employee by Sector Management of companies and enterprises $102,300 Utilities $90,500 Mining, quarrying, and oil and gas extraction $84,800 $83,800 Finance and insurance $75,000 Information $71,600 Professional, scientific, and technical services $63,500 Wholesale trade Manufacturing $52,300 Construction $51,100 $45,500 Total for all sectors Real estate and rental and leasing $43,800 Health care and social assistance $43,200 Transportation and warehousing $42,900 Agriculture, forestry, fishing and hunting Administrative and support and waste management and remediation services Educational services $35,000 Manufacturing employed 11.0 million workers in 2011. The annual payroll was $574.8 billion. $34,700 $34,000 Arts, entertainment, and recreation $31,700 Other services (except public administration) $27,800 Source: 2011 County Business Patterns $25,200 Retail trade $16,800 Accommodation and food services Source: 2011 County Business Patterns Where does manufacturing occur in the U.S.? Manufacturing Employees by State Total Number of U.S. Manufacturing Employees = 11 million More than 400,000 (10 states) 100,000 to 399,000 (24 states) Less than 99,000 (16 states and D.C.) In 2011, 27.4 percent of manufacturing employees 25 and older had a bachelor's degree or higher. Source: 2011 County Business Patterns Source: 2011 Current Population Survey Manufacturing Is One of the Top 3 Employers in 26 States The 146,615 manufacturing establishments in these states employ over 6 million people with over $320 billion in annual payroll. 5 1 Top 5 States in Manufacturing Employment: 2011 * 1. California ............1,134,193 * 2. Texas ......................733,679 3. Ohio .......................614,027 4. Pennsylvania..........546,956 5. Illinois ....................538,985 4 3 2 State with manufacturing as a top 3 employer *Manufacturing is not among the top 3 employers in California and Texas Source: 2011 County Business Patterns How much do manufacturers consume? Top 10 Industries by Cost of Materials (Billions of Dollars) Petroleum and coal products $717 B Food $448 B Transportation equipment $433 B $407 B Chemical Machinery $193 B Primary metal $185 B Fabricated metal products $157 B Computer and electronic products $132 B Plastics and rubber products $114 B Manufacturers purchased nearly 831 billion kilowatt hours of electricity in 2011. They also generated nearly 119 billion kilowatt hours and sold nearly 35 billion kilowatt hours. $94 B Source: 2011 Annual Survey of Manufactures Paper Source: 2011 Annual Survey of Manufactures Manufacturers spent $3.2 trillion on materials and in addition spent $147 billion on capital expenditures. Of the $147 billion in capital expenditures in 2011, 85 percent was spent on new and used machinery and equipment. Source: 2011 Annual Survey of Manufactures Source: 2011 Annual Survey of Manufactures Which industries have the largest value of shipments? Top 10 Industries by Value of Shipments (Billions of Dollars) Petroleum and coal products $837 B $777 B Chemical Food $710 B Transportation equipment $690 B Machinery $366 B Computer and electronic products $338 B Fabricated metal products $327 B Primary metal Plastics and rubber products Paper $280 B $205 B $176 B The total value of shipments for 2011 was $5.5 trillion. Source: 2011 Annual Survey of Manufactures Source: 2011 Annual Survey of Manufactures How does manufacturing contribute to exports? About 6 in 10 U.S. Export Dollars Come from Manufacturers* 59.7% Manufacturers 22.9% Wholesalers 17.3% Others and Unclassified *Note: Graphic shows the known value of the portion of U.S. exports that could be matched to specific companies. Source: A Profile of U.S. Importing and Exporting Companies, 2010-2011 #MeasuringAmerica America’s Economy Mobile App